Skip to content

Cybersecurity dashboards

Cybersecurity dashboard examples

Three dashboards for a security team: alerts, incidents, patching and phishing tests by asset group, the uptime and tickets beside them, and how fast a fix can reach production. Open any of them to see it in full, then use it as a template for your own data.
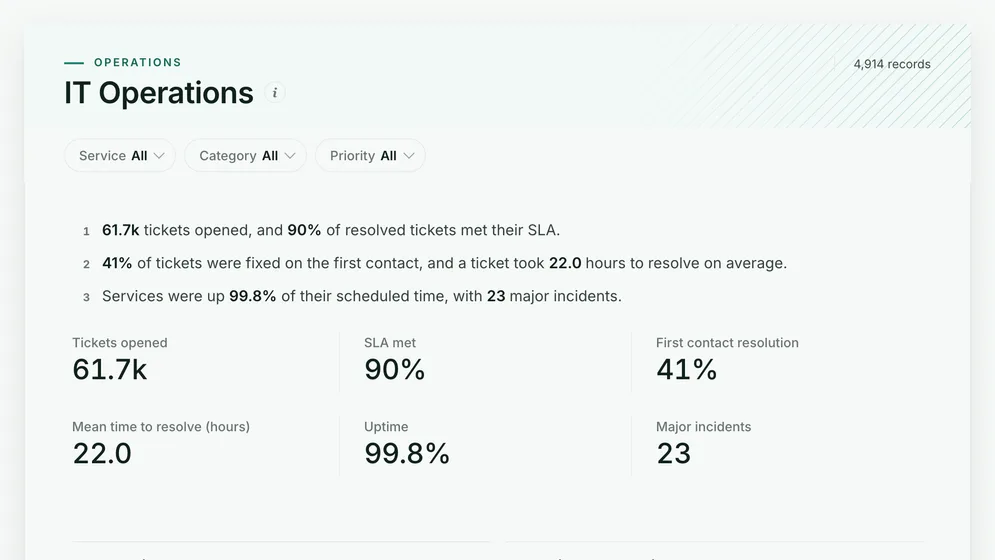
IT Operations dashboard: Tickets opened, SLA met, First contact resolution, Mean time to resolve (hours) and Uptime tiles.
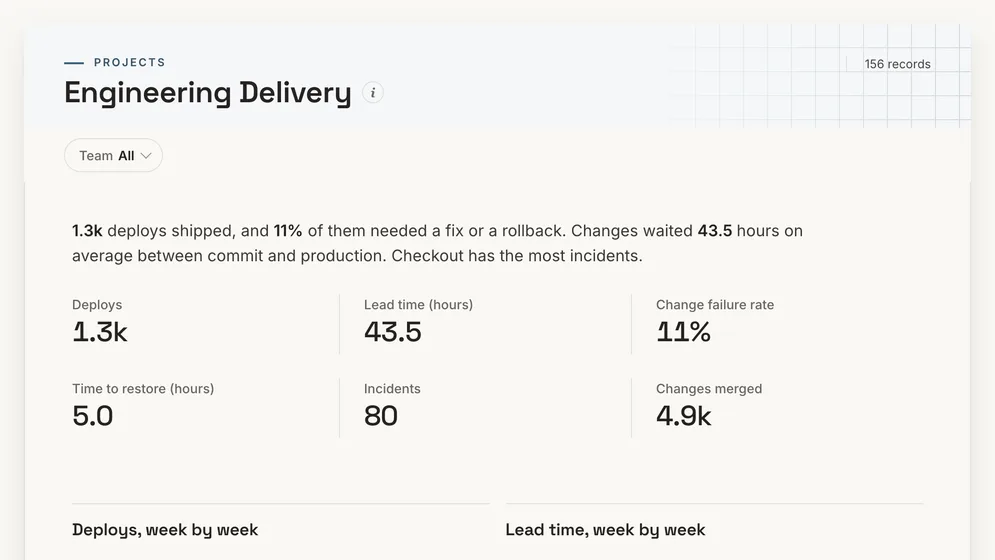
Engineering Delivery dashboard: Deploys, Lead time (hours), Change failure rate, Time to restore (hours) and Incidents tiles.
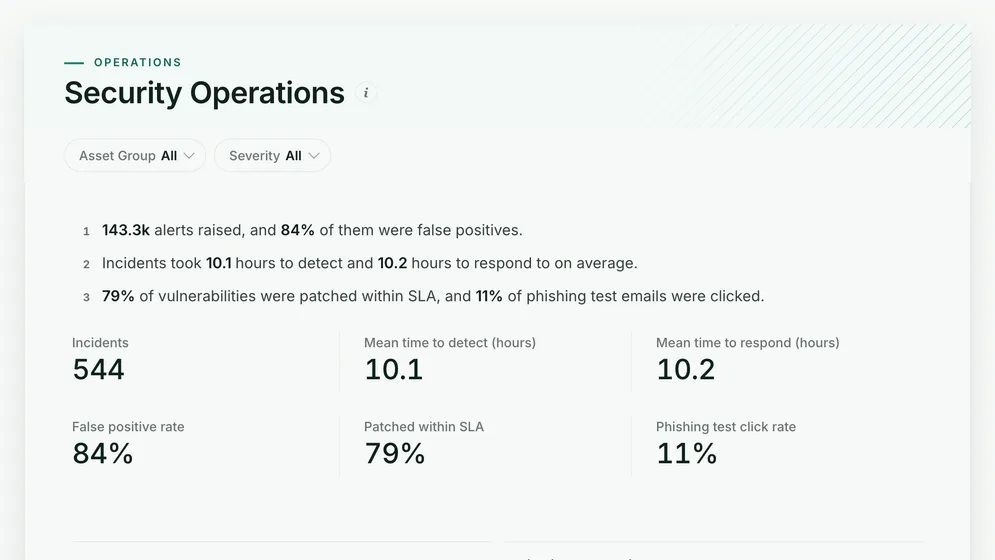
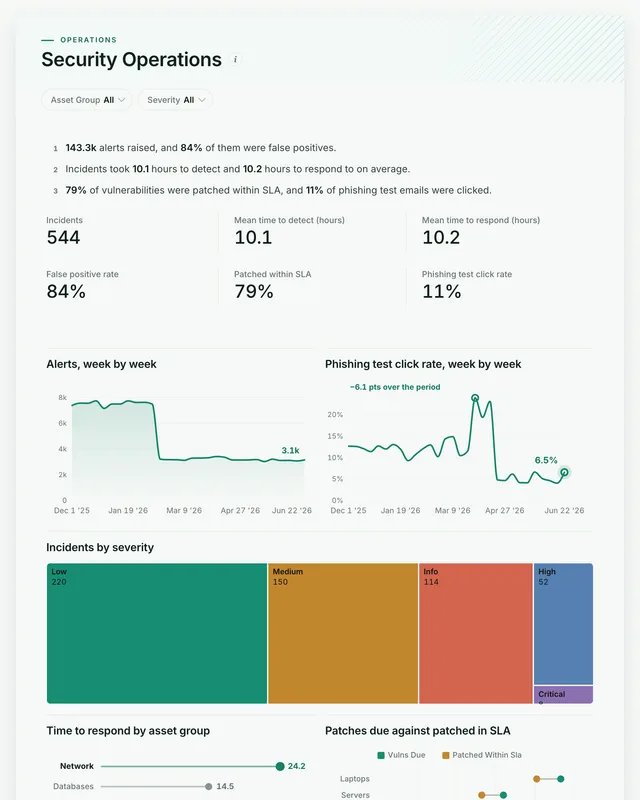
Security Operations dashboard: Incidents, Mean time to detect (hours) and Mean time to respond (hours) tiles.

All figures are sample data.

The examples

Three cybersecurity dashboard examples and templates

Click a board to see all of it. Click Use template to start your own copy in Mammoth. All figures are sample data.

  1. Security Operations dashboard: Incidents, Mean time to detect (hours) and Mean time to respond (hours) tiles.
    Sample data

    Cybersecurity dashboard

    How many alerts are real, and how fast are incidents handled?
    • Incidents
    • Mean time to detect (hours)
    • Mean time to respond (hours)
    • False positive rate
    Use template
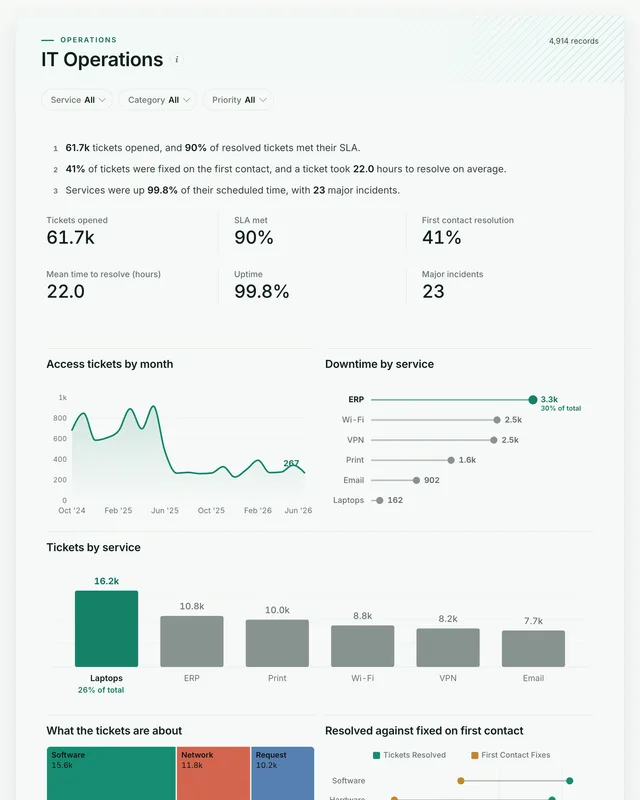
  2. IT Operations dashboard: Tickets opened, SLA met, First contact resolution, Mean time to resolve (hours) and Uptime tiles.
    Sample data

    IT and security operations dashboard

    Are the services up while security does its work?
    • Tickets opened
    • SLA met
    • First contact resolution
    • Mean time to resolve (hours)
    Use template
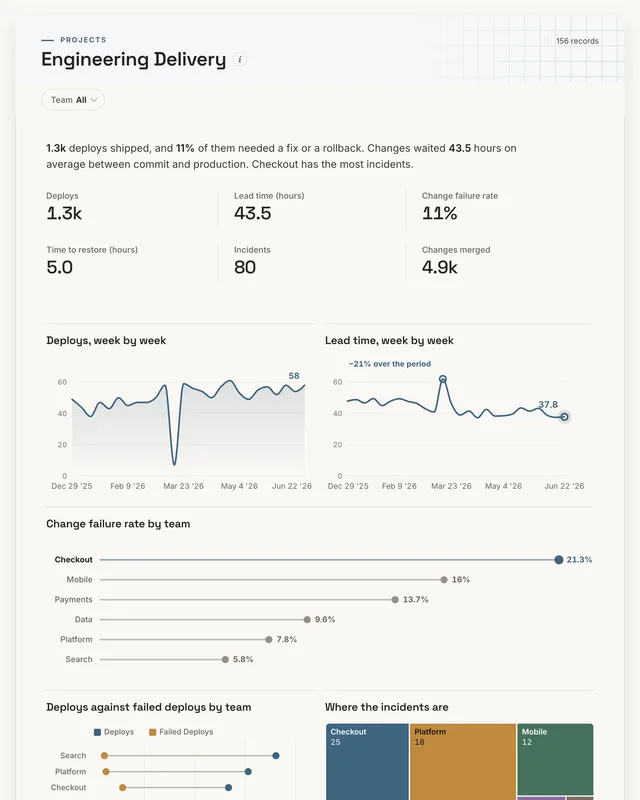
  3. Engineering Delivery dashboard: Deploys, Lead time (hours), Change failure rate, Time to restore (hours) and Incidents tiles.
    Sample data

    Security patch delivery dashboard

    How quickly can a fix reach production?

    • Deploys
    • Lead time (hours)
    • Change failure rate
    • Time to restore (hours)
    Use template

Definition

What a cybersecurity dashboard is

A cybersecurity dashboard is one screen that shows how well an organisation detects and handles threats: how many alerts fire and how many are real, how long incidents take to detect and to contain, whether vulnerabilities are patched within their deadlines, and how many people click a phishing test. The data usually comes from the SIEM, the vulnerability scanner, the ticketing system and the phishing platform.

  • Signal against noise

    False positives beside the alert count.

  • Patching by risk

    Within SLA by severity and asset group.

  • People, too

    Phishing test click rates week by week.

The metrics

The metrics a cybersecurity dashboard is built from

Eight numbers. Most depend on a definition agreed first, such as when an alert becomes an incident.

  • Incidents

    How many real security events were there?

    What the data needs

    Alerts confirmed as incidents, by severity and asset group. Agree when an alert becomes an incident, or the count means nothing.

  • Mean time to detect

    How long does a threat go unnoticed?

    What the data needs

    When the activity started and when it was detected. The start is often estimated after the fact; record how.

  • Mean time to respond

    How long does containment take?

    What the data needs

    Detection and containment times per incident, by severity.

  • False positive rate

    How much of the alert volume is noise?

    What the data needs

    Alerts and the ones closed as false positives. A rising rate means analysts' time is going on tuning, not threats.

  • Patched within SLA

    Are known weaknesses fixed in time?

    What the data needs

    Vulnerabilities with severity, due date and patch date. Read by asset group: the critical servers matter more than the laptops.

  • Phishing test click rate

    How many people click a fake phishing email?

    What the data needs

    Test emails sent and clicked per campaign. Report-rate beside click-rate shows whether people are learning to flag it.

  • Alerts

    How much is the SOC handling?

    What the data needs

    Alerts by week and source. A drop after tuning is good; a drop after a sensor failed is not.

  • Open critical vulnerabilities

    How much serious exposure is still open?

    What the data needs

    Unpatched critical and high findings by asset group, with their age.

How to build one

How to build your own cybersecurity dashboard

From one of the examples above to a live dashboard on your own data.

  1. 1

    Pick a template

    Start from any of the three boards above.

  2. 2

    Add your data

    Upload a spreadsheet, or connect one of 100+ tested connectors.

  3. 3

    Clean it once

    Fix and combine your data once. Mammoth repeats those steps for you.

  4. 4

    Set it to refresh

    The dashboard updates on a schedule and flags data that fails a check.

  5. 5

    Share the link

    Public, password-protected or sign-in only, on every plan.

Start with a template

14-day Pro trial · No credit card

FAQ

Cybersecurity dashboard questions

Last reviewed against the template catalogue.

What should a cybersecurity dashboard show?
Whether threats are found quickly and closed quickly, and whether known weaknesses are fixed. That means incidents by severity, time to detect and respond, the false positive rate, patching within SLA and phishing click rates. The first board covers those.
What KPIs should a cybersecurity dashboard track?
Incidents, mean time to detect, mean time to respond, false positive rate, patched within SLA and phishing test click rate are the core. The list below shows each one with the data it needs.
How do I build a cybersecurity dashboard?
Start with the incident count the risk committee already sees. Then follow five steps.
  1. Export alerts and incidents from the SIEM or ticketing tool with severity, asset group and timestamps.
  2. Export vulnerabilities with due dates and patch dates from the scanner.
  3. Add phishing test results by week from the training platform.
  4. Check one week's incidents against the SOC's own log before anyone relies on the board.
  5. Refresh daily for operations and monthly for the board pack.
What should go on a cybersecurity dashboard for the board?
Fewer numbers, read as trends: incidents by severity, patching within SLA for critical assets, time to respond, and the phishing click rate. Directors need to see whether risk is going up or down, not how many alerts fired.
Where does security data come from?
Usually a SIEM, an EDR tool, a vulnerability scanner, the IT ticketing system and a phishing simulation platform, often exported to CSV. Mammoth has 100+ tested connectors, and can also connect to anything with a REST API. You combine the sources once, and Mammoth repeats the same steps on every refresh.
Can the risk committee see it without a licence?
Yes. Dashboard viewers are unlimited and free on every Mammoth plan, including the free one, so analysts, IT and directors can open it at no per-viewer cost. Only the people building the dashboards count as platform users.

Build the cybersecurity dashboard you actually need.

Start from one of these templates or your own spreadsheet. Share it with as many people as you like, free.

  • ✓ 14-day Pro trial
  • ✓ No credit card
  • ✓ Viewers always free