Skip to content

ESG dashboards

ESG dashboard examples

Four dashboards for ESG reporting: emissions by month, site and scope with renewable power and waste, the supplier spend a Scope 3 estimate starts from, health and safety by site, and workforce turnover. Open any of them to see it in full, then use it as a template for your own data.
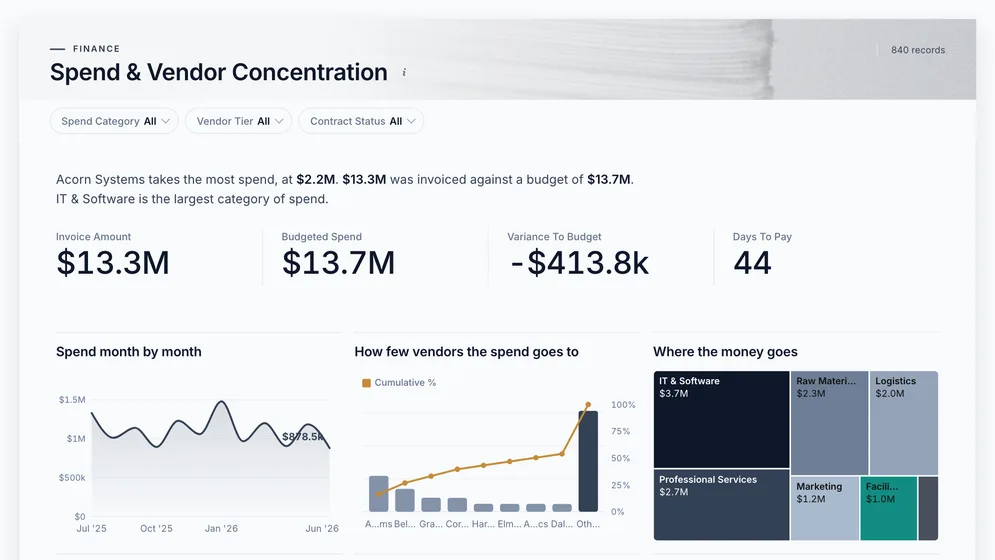
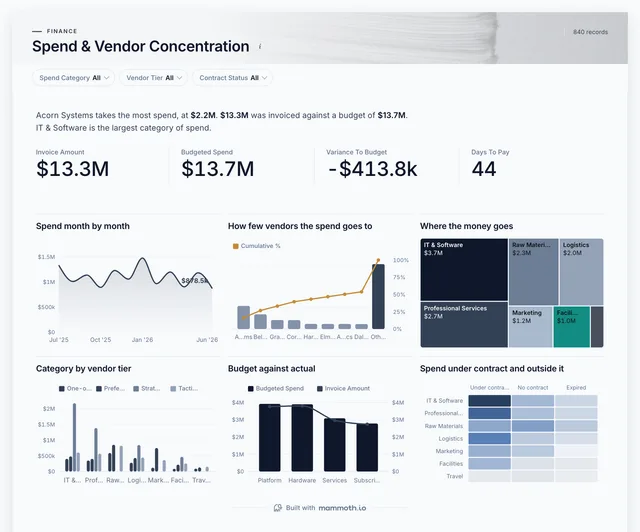
Spend & Vendor Concentration dashboard: Invoice Amount, Budgeted Spend, Variance To Budget and Days To Pay tiles.
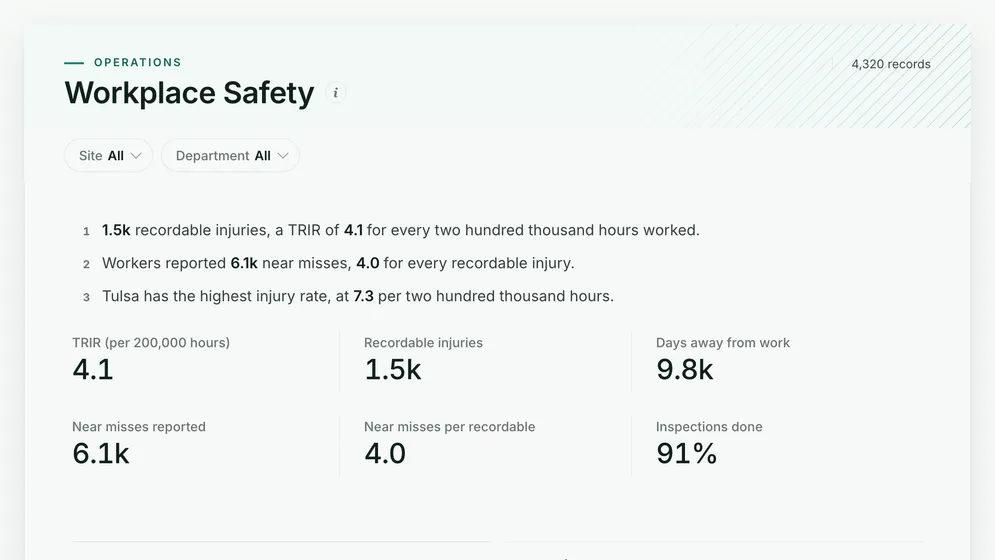
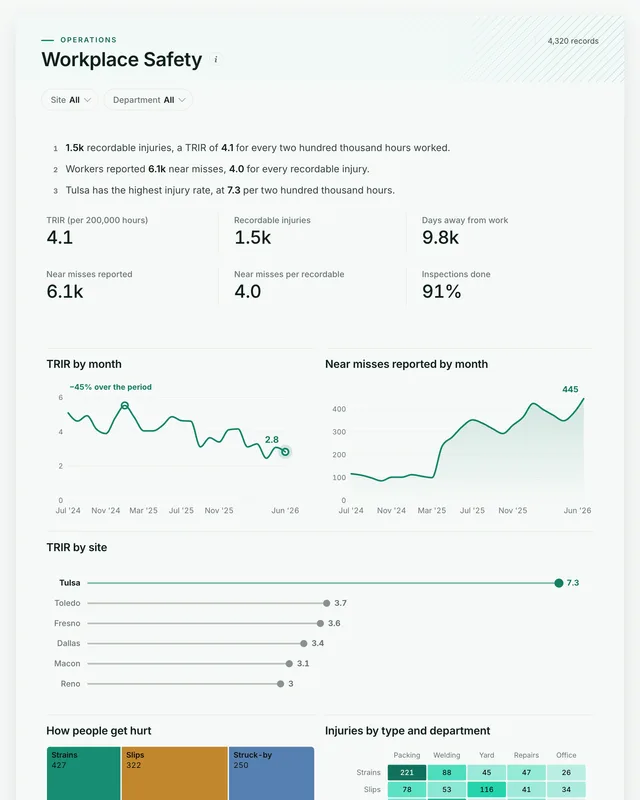
Workplace Safety dashboard: TRIR (per 200,000 hours), Recordable injuries and Days away from work tiles, above TRIR by month.
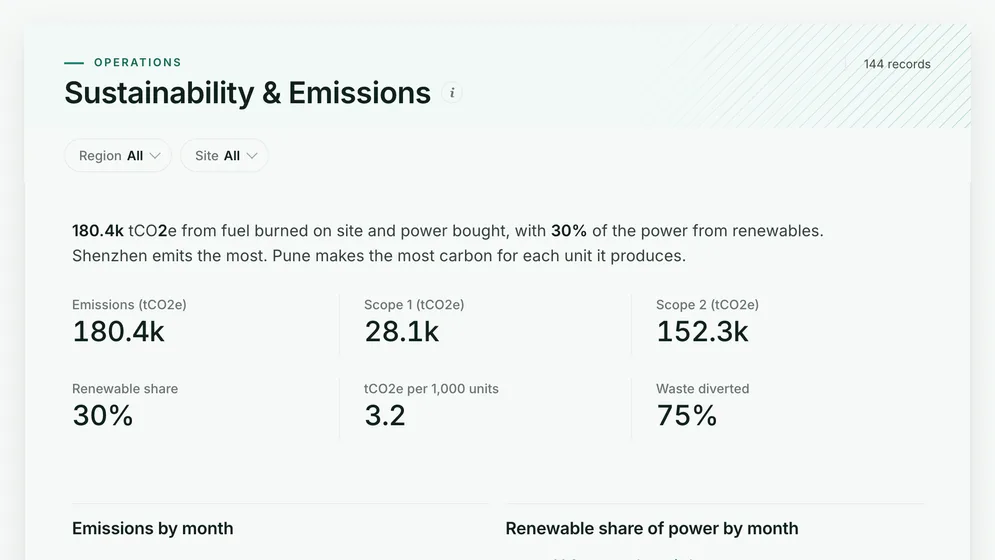
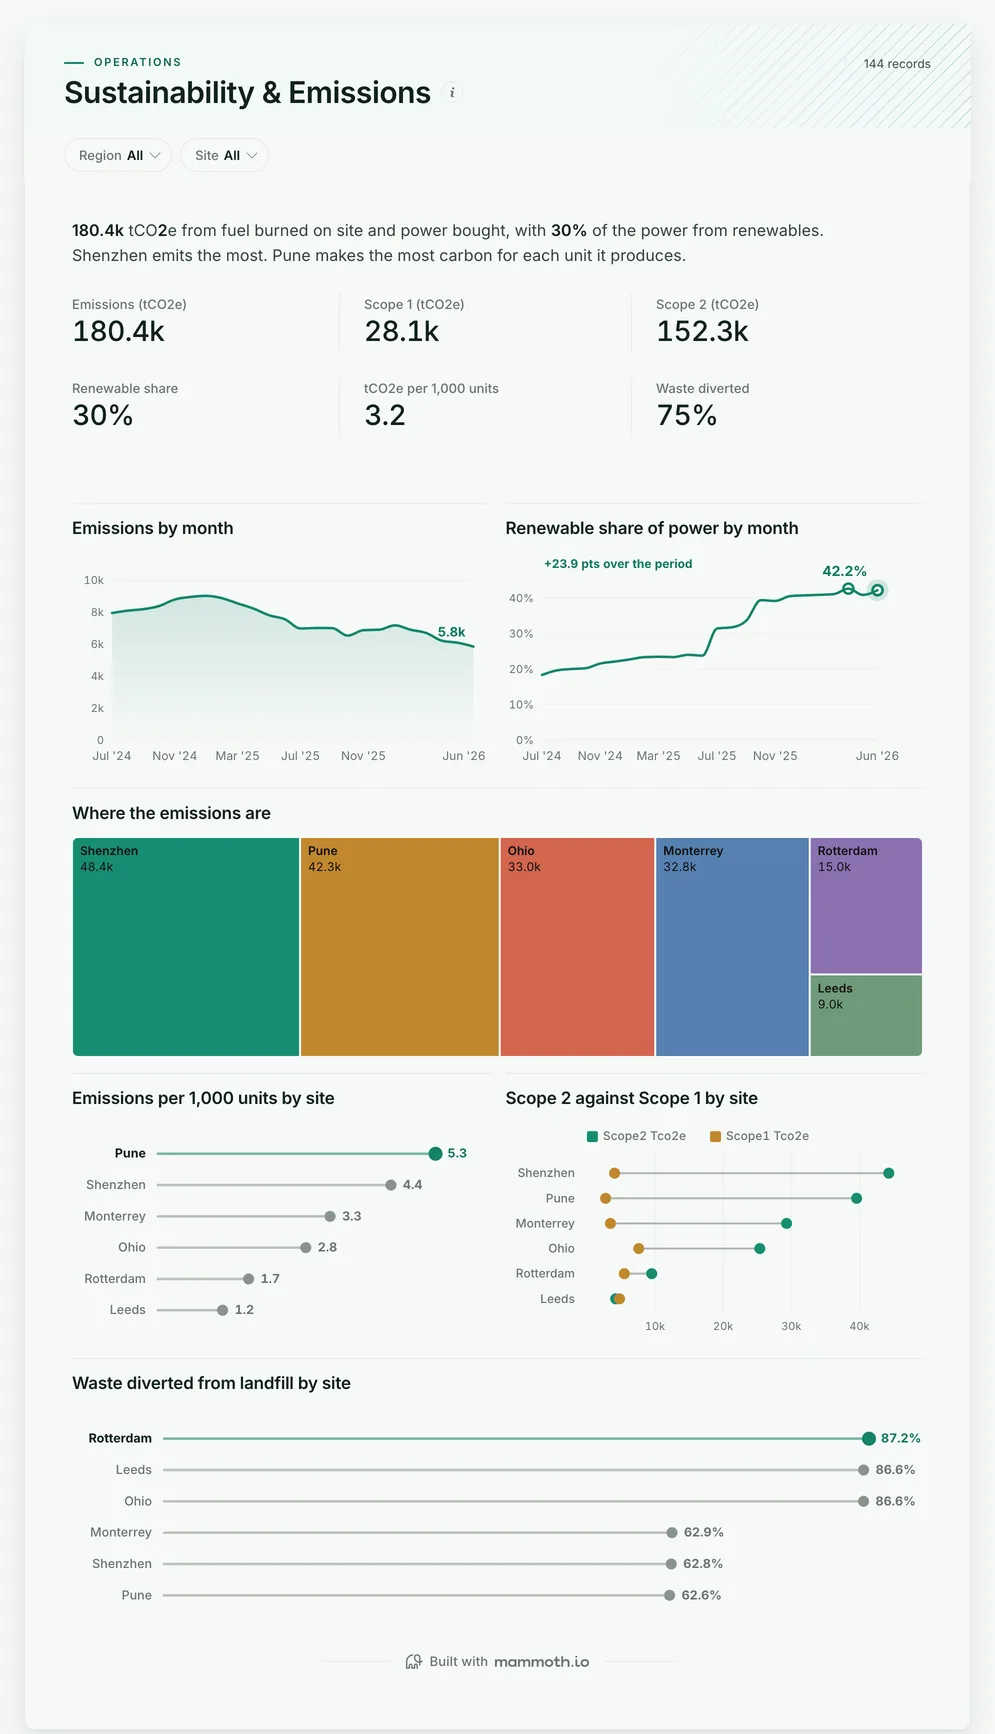
Sustainability & Emissions dashboard: Emissions (tCO2e), Scope 1 (tCO2e), Scope 2 (tCO2e) and Renewable share tiles.

Three of the four examples. All figures are sample data.

The examples

Four ESG dashboard examples and templates

Click a board to see all of it. Click Use template to start your own copy in Mammoth. All figures are sample data.

  1. Sustainability & Emissions dashboard: Emissions (tCO2e), Scope 1 (tCO2e), Scope 2 (tCO2e) and Renewable share tiles.
    Sample data

    ESG dashboard

    Are emissions falling, and which sites carry them?
    • Emissions (tco2e)
    • Scope 1 (tco2e)
    • Scope 2 (tco2e)
    • Renewable share
    Use template
  2. Spend & Vendor Concentration dashboard: Invoice Amount, Budgeted Spend, Variance To Budget and Days To Pay tiles.
    Sample data

    Supplier emissions spend dashboard

    Which suppliers carry the Scope 3 footprint?
    • Invoice amount
    • Budgeted spend
    • Variance to budget
    • Days to pay
    Use template
  3. Workplace Safety dashboard: TRIR (per 200,000 hours), Recordable injuries and Days away from work tiles, above TRIR by month.
    Sample data

    ESG health and safety dashboard

    How safe are the people doing the work?
    • TRIR (per 200,000 hours)
    • Recordable injuries
    • Days away from work
    • Near misses reported
    Use template
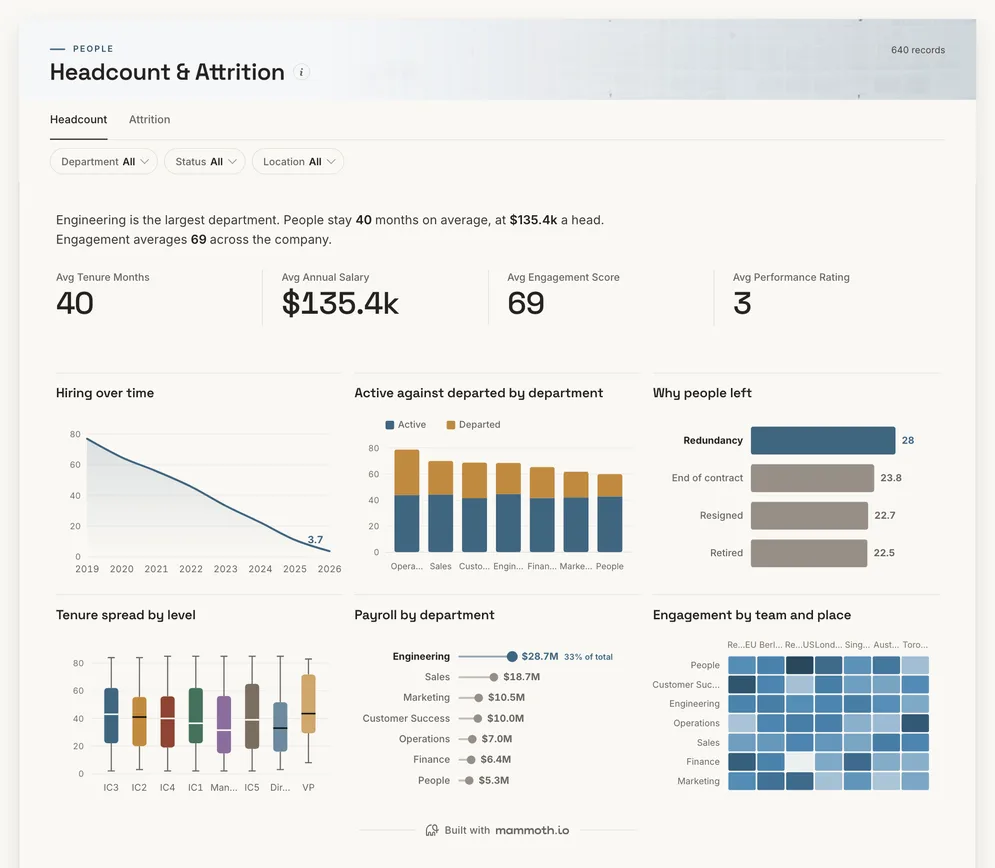
  4. Headcount & Attrition dashboard: Tenure Months, Annual Salary, Engagement Score and Performance Rating tiles.
    Sample data

    ESG workforce dashboard

    Is the workforce stable, and who is leaving?

    • Tenure months
    • Annual salary
    • Engagement score
    • Performance rating
    Use template

Definition

What an ESG dashboard is

An ESG dashboard is one screen that shows how a business is doing on environmental, social and governance measures: emissions by scope and site, energy and how much of it is renewable, waste, workplace safety and workforce stability. The data usually comes from utility bills and meter reads, purchasing, the incident log and HR.

  • Per unit, not just totals

    Emissions per 1,000 units separate growth from waste.

  • E and S together

    Emissions, safety and workforce on one site list.

  • From your own exports

    Utility bills, meter reads and HR files, not a new platform.

The metrics

The metrics an ESG dashboard is built from

Eight numbers. Most depend on a definition agreed first, such as which emission factors apply or what counts as diverted waste.

  • Total emissions

    How much carbon does the business emit?

    What the data needs

    Scope 1 and Scope 2 in tCO2e per site and month, from energy and fuel use times a stated factor. Mixing factor years makes last year's comparison wrong.

  • Scope 1

    How much comes from fuel burned on site?

    What the data needs

    Gas, diesel and other fuel use per site, from bills or fuel cards. Company vehicles belong here too.

  • Scope 2

    How much comes from the power bought?

    What the data needs

    Electricity and heat bought per site, with the grid factor for that location and year. Report location-based and market-based apart if you buy green tariffs.

  • Renewable share

    How much of the power is renewable?

    What the data needs

    Renewable and total MWh per site and month, from contracts or on-site generation. Certificates bought separately should be shown separately.

  • Emissions per unit

    Is the business getting cleaner, or only smaller?

    What the data needs

    Emissions and output for the same site and period. Totals can fall because a plant made less; the per-unit number shows whether it made it better.

  • Waste diverted

    How much waste stays out of landfill?

    What the data needs

    Waste tonnes by route per site, from the waste contractor's reports. Diverted means recycled, composted or recovered, on one agreed list.

  • Injury rate

    How safe is the work?

    What the data needs

    Recordable injuries and hours worked by site. It is the social measure investors ask for most often.

  • Staff turnover

    Is the workforce stable?

    What the data needs

    Leavers and average headcount by site and department, with the reason for leaving where it is recorded.

How to build one

How to build your own ESG dashboard

From one of the examples above to a live dashboard on your own data.

  1. 1

    Pick a template

    Start from any of the four boards above.

  2. 2

    Add your data

    Upload a spreadsheet, or connect one of 100+ tested connectors.

  3. 3

    Clean it once

    Fix and combine your data once. Mammoth repeats those steps for you.

  4. 4

    Set it to refresh

    The dashboard updates on a schedule and flags data that fails a check.

  5. 5

    Share the link

    Public, password-protected or sign-in only, on every plan.

Start with a template

14-day Pro trial · No credit card

FAQ

ESG dashboard questions

Last reviewed against the template catalogue.

What should an ESG dashboard show?
Whether emissions are falling, where they come from, and how the business treats its people. That means emissions by scope and site, energy and its renewable share, waste diverted, injury rates and turnover. The four boards above cover those.
What KPIs should an ESG dashboard track?
Total emissions, Scope 1 and Scope 2, renewable share, emissions per unit of output and waste diverted on the environmental side; injury rate and staff turnover on the social side. The list below shows each one with the data it needs.
How do I build an ESG dashboard?
Start with the numbers your report or your largest customer already asks for. Then follow five steps.
  1. Collect energy use per site and month from utility bills or meters, and fuel use from purchasing.
  2. Convert each to tCO2e with one published set of emission factors, and keep the factor year with the data.
  3. Add output per site, so emissions can be read per unit made.
  4. Check one year's totals against last year's report before anyone relies on the board.
  5. Refresh monthly, so the year-end report is a sum of months already checked.
What is the difference between Scope 1, 2 and 3?
Scope 1 is what you burn yourself, such as gas and vehicle fuel. Scope 2 is the electricity and heat you buy. Scope 3 is everything in your supply chain and the use of what you sell, and is usually the largest; most businesses start it from spend by supplier, which is what the second board shows.
Where does ESG data come from?
Usually utility bills or a metering platform, fuel cards, purchasing and accounts payable, an incident log and the HR system, often across spreadsheets. Mammoth has 100+ tested connectors, and can also connect to anything with a REST API. You combine the sources once, and Mammoth repeats the same steps on every refresh.
Can the board and investors see it without a licence?
Yes. Dashboard viewers are unlimited and free on every Mammoth plan, including the free one, so directors, site leads and the people preparing the report can open it at no per-viewer cost. Only the people building the dashboards count as platform users.

Build the ESG dashboard you actually need.

Start from one of these templates or your own spreadsheet. Share it with as many people as you like, free.

  • ✓ 14-day Pro trial
  • ✓ No credit card
  • ✓ Viewers always free