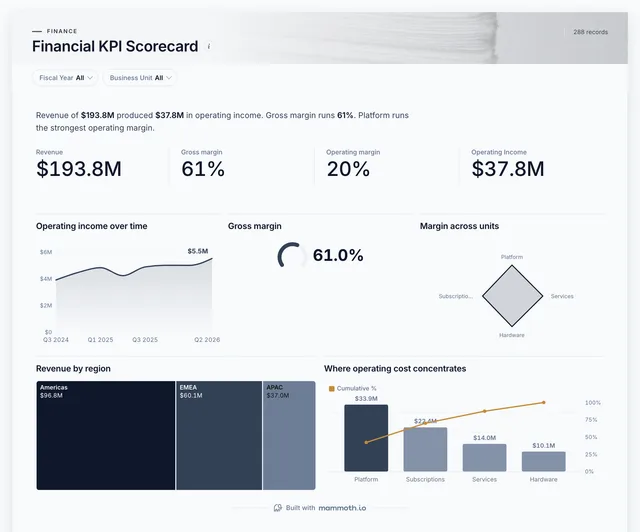
CFO dashboard
Are revenue and margins where the CFO said they would be?
- Revenue
- Gross margin
- Operating margin
- Operating income
CFO dashboards
Six dashboards for a CFO: the KPI scorecard a finance review opens with, profit by unit, the year against plan, cash coming in, who owes money and where it goes. Then the same numbers as a month-end report and a board pack. Open any of them to see it in full, then use it as a template for your own data.
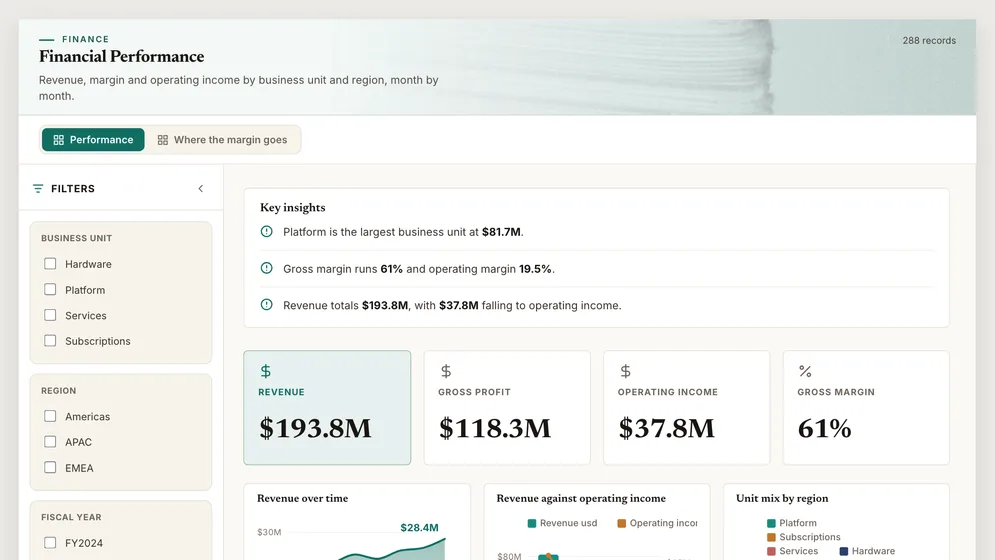
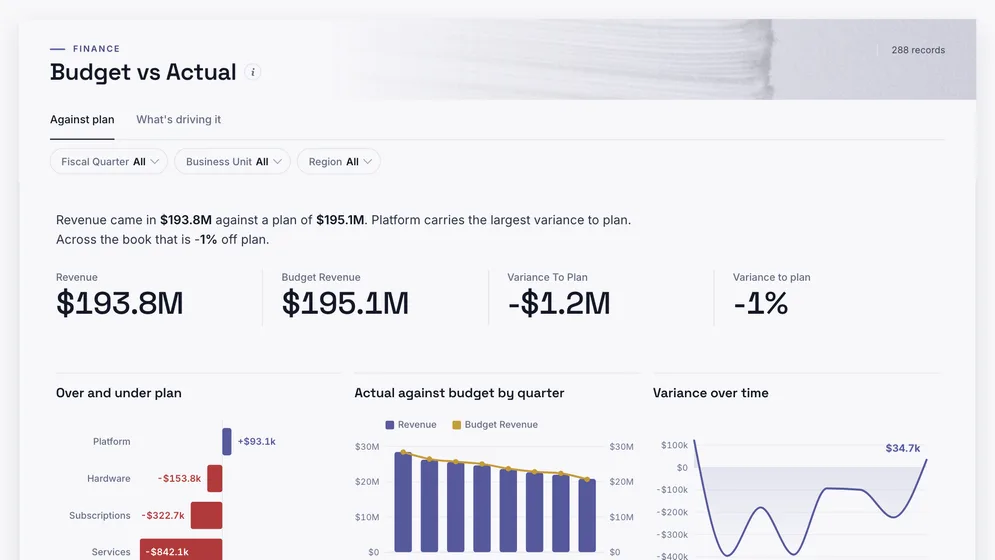
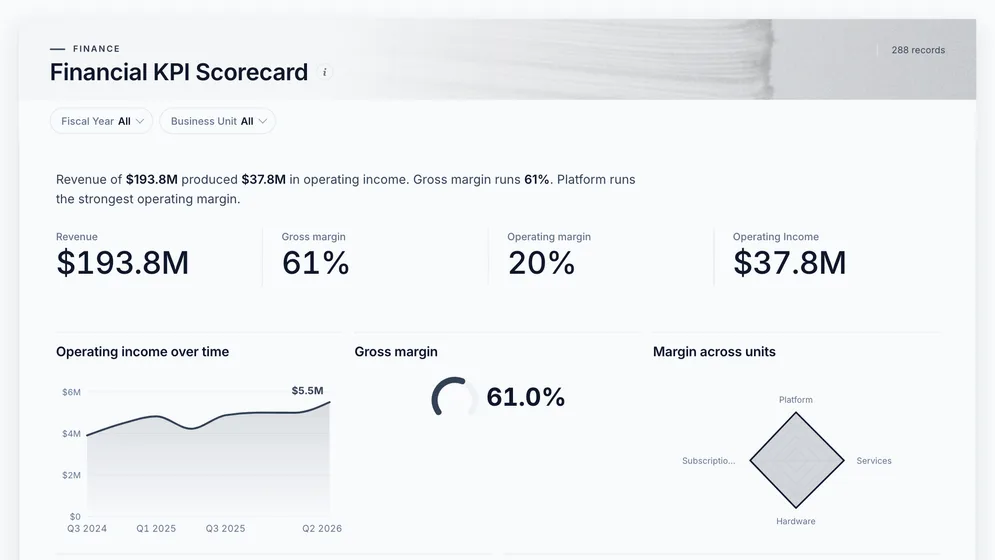
Three of the six examples. All figures are sample data.
The examples
Click a board to see all of it. Click Use template to start your own copy in Mammoth. All figures are sample data.
Are revenue and margins where the CFO said they would be?
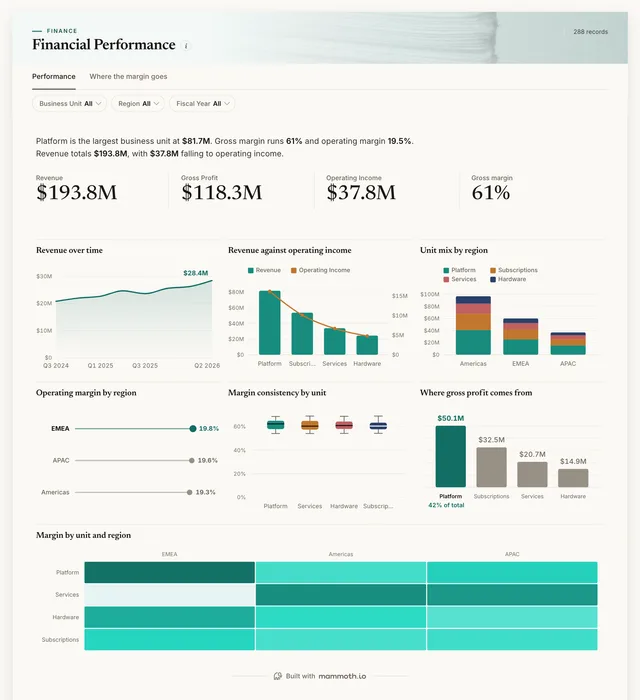
Which units and regions make the profit?
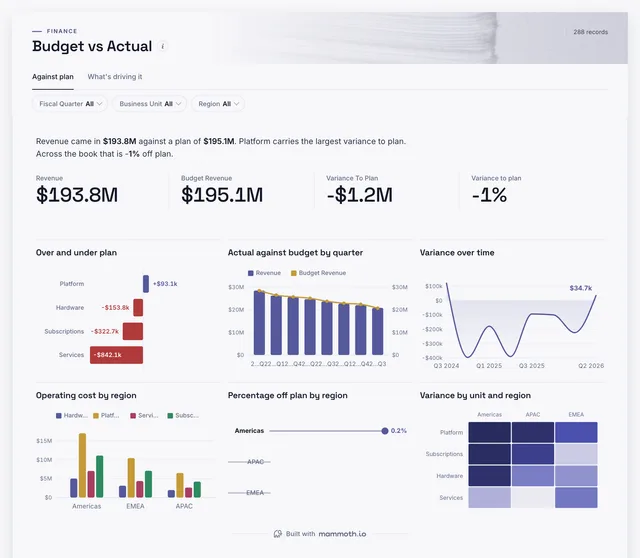
Where is the year drifting from plan?
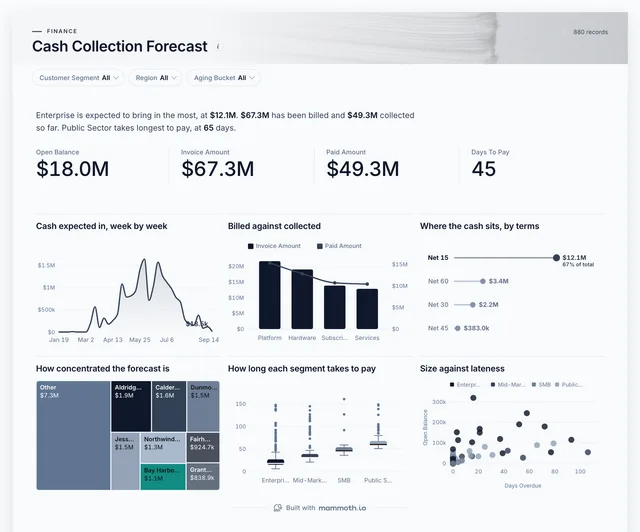
How much cash lands in each of the next few weeks?
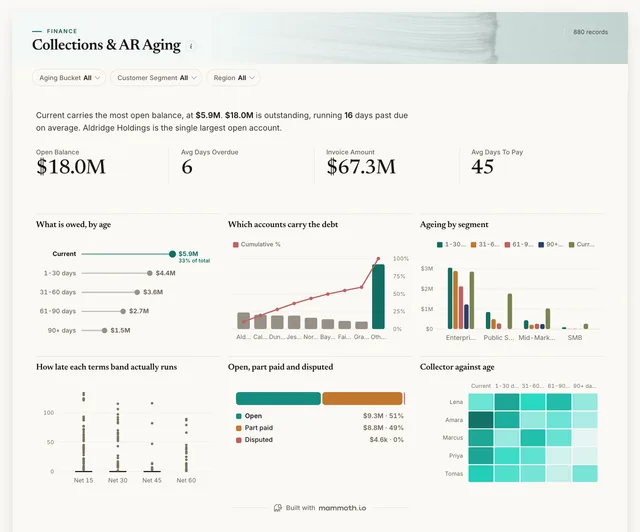
Who owes us money, and is it getting older?
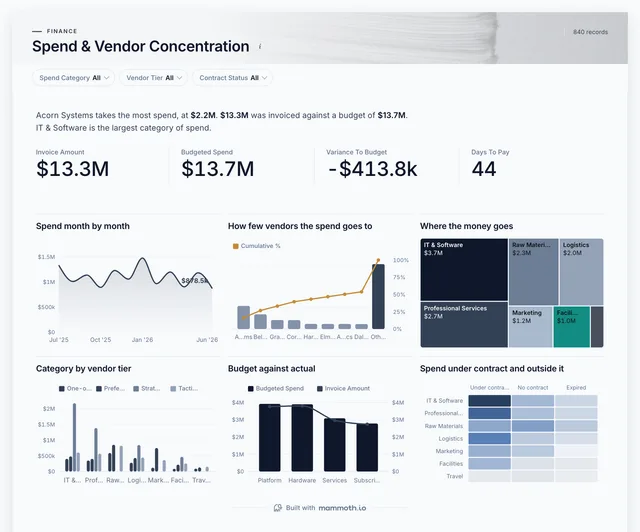
Where does the money go, and how exposed are we to a few suppliers?
Definition
A CFO dashboard is one screen that shows a chief financial officer the state of the business in money: revenue and margin against plan, where profit comes from, how much cash is coming in and going out, and what customers still owe. The data usually comes from the general ledger, the budget, the receivables ledger and purchasing.
The P&L beside the money going in and out.
Variance by unit, so each miss has a name.
The same numbers as a report and a deck.
The metrics
Eight numbers. Most depend on a definition agreed first, such as which costs sit above the operating line.
Is the business growing, and how fast?
Revenue by month, unit and region. Compare like-for-like periods, or one large deal reads as a trend.
How much of each sale is left after direct cost?
Revenue and cost of goods sold at the same grain. Where a cost sits must be agreed once, or margin moves with the bookkeeping.
How much is left after running the business?
Operating income and revenue. Read it by unit to see which part of the business carries the rest.
Where is the year drifting from plan?
Actual and budget by month, unit and account. A variance without an owner starts an argument rather than a fix.
How long do customers take to pay?
Receivables and revenue for the period, or invoice and payment dates. A rising number is cash stuck with customers.
How much cash lands in the next weeks?
Open invoices with due dates and each customer's usual delay. Due dates alone make the forecast look safer than it is.
Is cost under control?
Purchases or payables by category and month, with the budget at the same grain.
How many months does the cash last?
Cash on hand and net monthly burn. Average a few months of burn, since one large payment distorts a single month.
Reports and decks
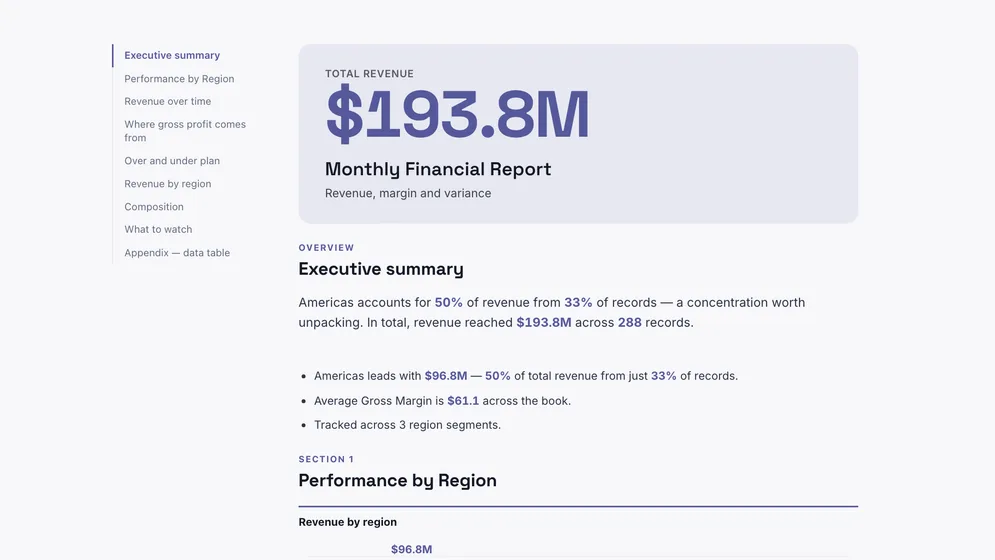
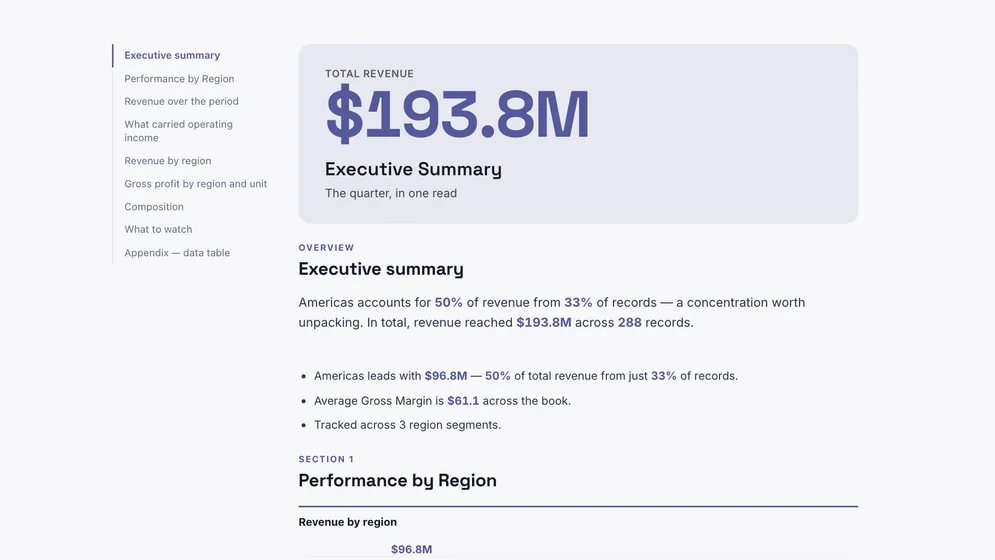
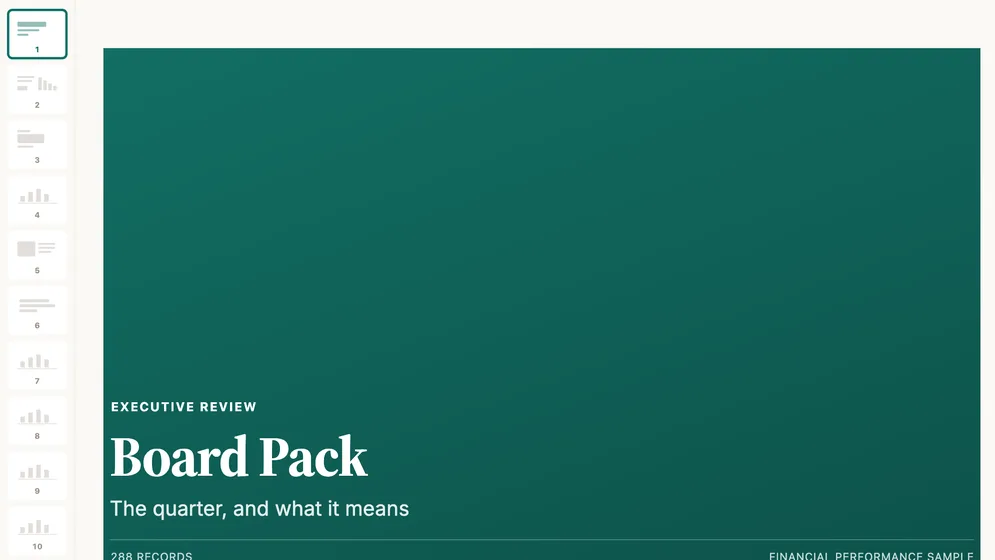
These three use the same sample P&L as the first three dashboards above: a month-end report, a quarterly summary and a board presentation.
How to build one
From one of the examples above to a live dashboard on your own data.
Start from any of the six boards above.
Upload a spreadsheet, or connect one of 100+ tested connectors.
Fix and combine your data once. Mammoth repeats those steps for you.
The dashboard updates on a schedule and flags data that fails a check.
Public, password-protected or sign-in only, on every plan.
14-day Pro trial · No credit card
FAQ
Last reviewed against the template catalogue.
Start from one of these templates or your own spreadsheet. Share it with as many people as you like, free.
More dashboard examples


