Skip to content

Nonprofit dashboards

Nonprofit dashboard examples

Four dashboards for a nonprofit: how much was raised and whether donors are staying, which appeals bring donors in for what they cost, each programme against its budget, and where the money goes after it is raised. Open any of them to see it in full, then use it as a template for your own data.
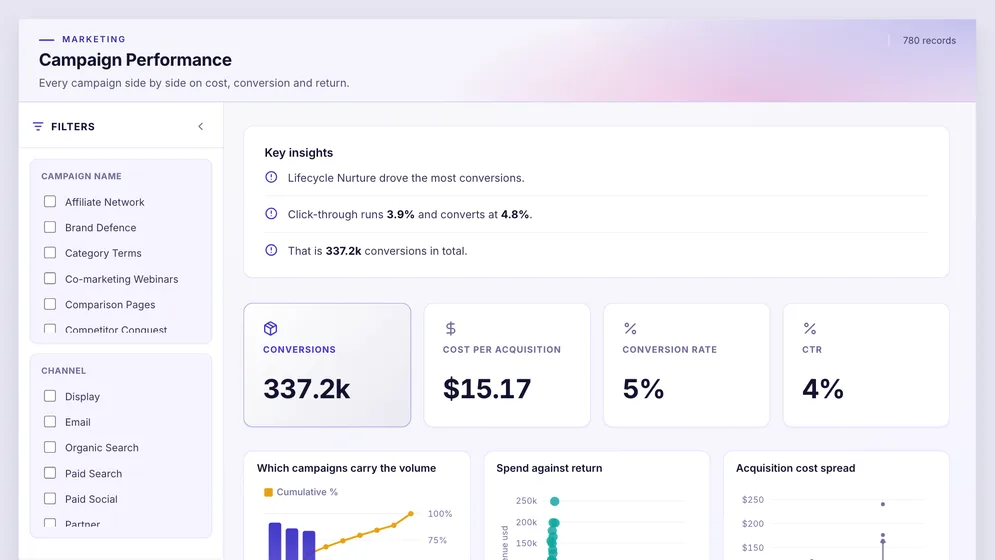
Campaign Performance dashboard: Conversions, Cost per acquisition, Conversion rate and CTR tiles.
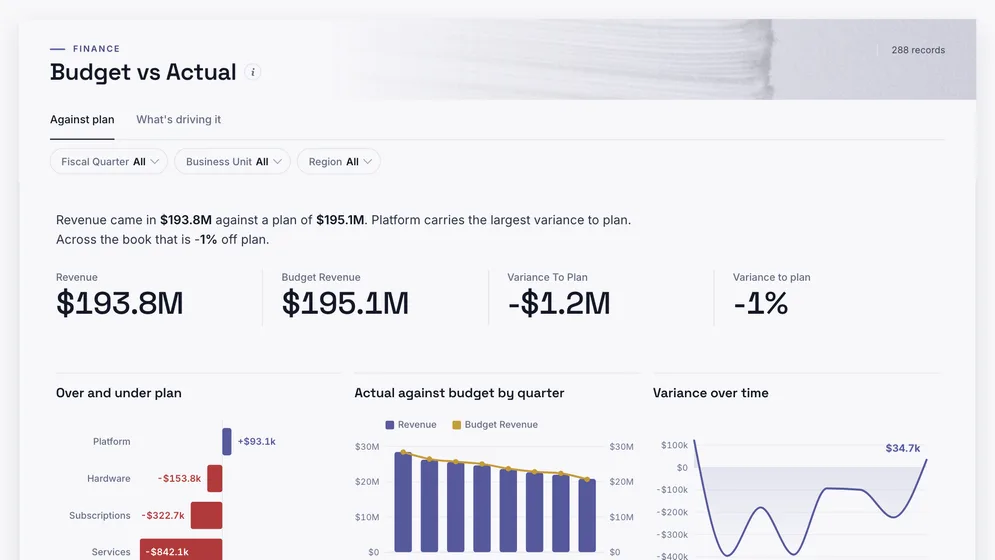
Budget vs Actual dashboard: Revenue, Budget Revenue and Variance To Plan tiles, above Over and under plan.
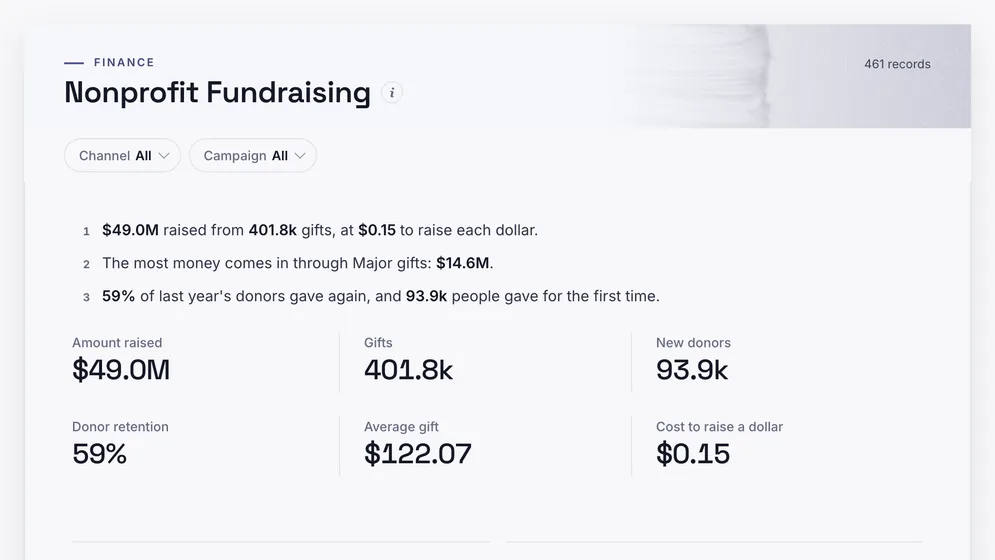
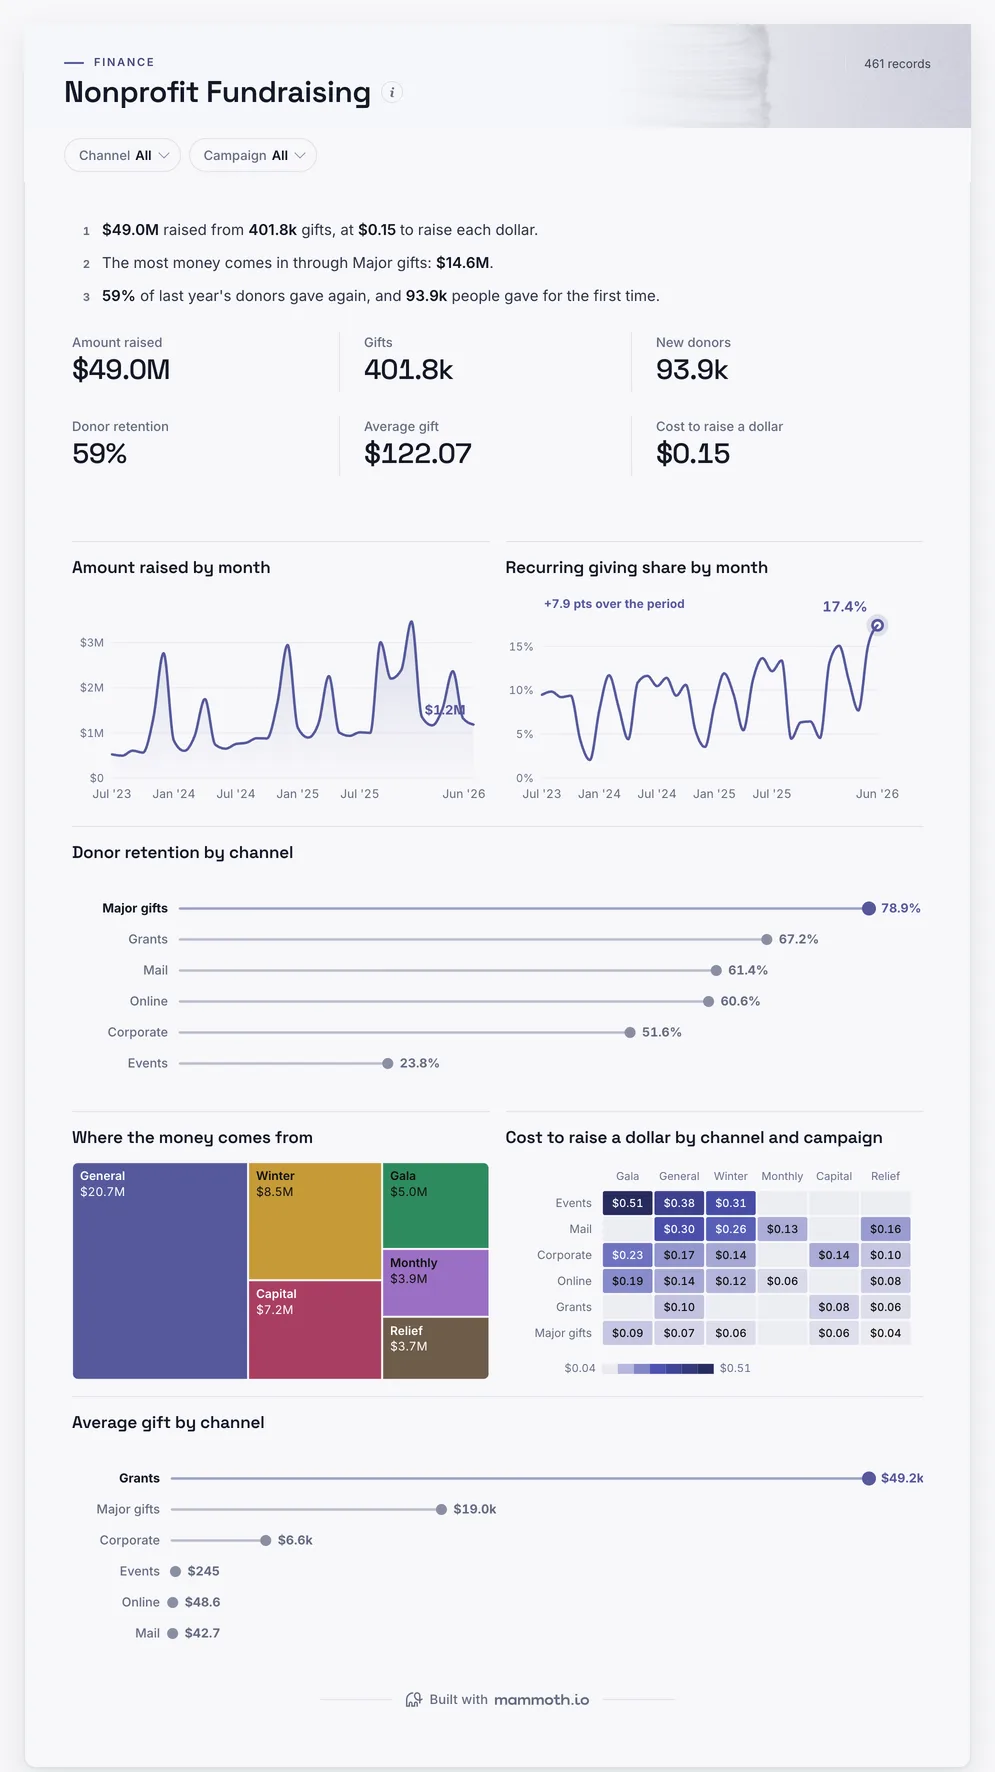
Nonprofit Fundraising dashboard: Amount raised, Gifts, New donors, Donor retention and Average gift tiles.

Three of the four examples. All figures are sample data.

The examples

Four nonprofit dashboard examples and templates

Click a board to see all of it. Click Use template to start your own copy in Mammoth. All figures are sample data.

  1. Nonprofit Fundraising dashboard: Amount raised, Gifts, New donors, Donor retention and Average gift tiles.
    Sample data

    Nonprofit dashboard

    How much did we raise, and are donors staying?
    • Amount raised
    • Gifts
    • New donors
    • Donor retention
    Use template
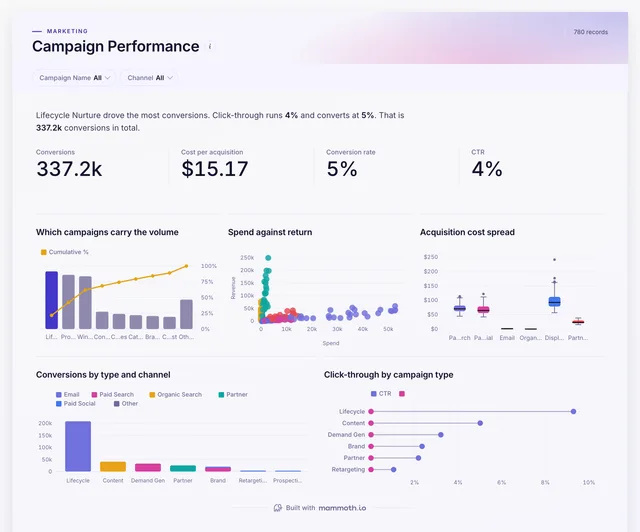
  2. Campaign Performance dashboard: Conversions, Cost per acquisition, Conversion rate and CTR tiles.
    Sample data

    Fundraising campaign dashboard

    Which appeals bring in donors for what they cost?
    • Conversions
    • Cost per acquisition
    • Conversion rate
    • CTR
    Use template
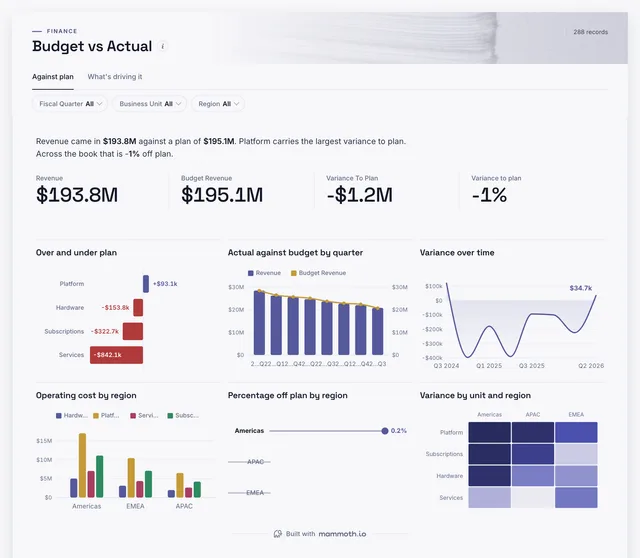
  3. Budget vs Actual dashboard: Revenue, Budget Revenue and Variance To Plan tiles, above Over and under plan.
    Sample data

    Nonprofit budget vs actual dashboard

    Is each programme spending to budget?
    • Revenue
    • Budget revenue
    • Variance to plan
    Use template
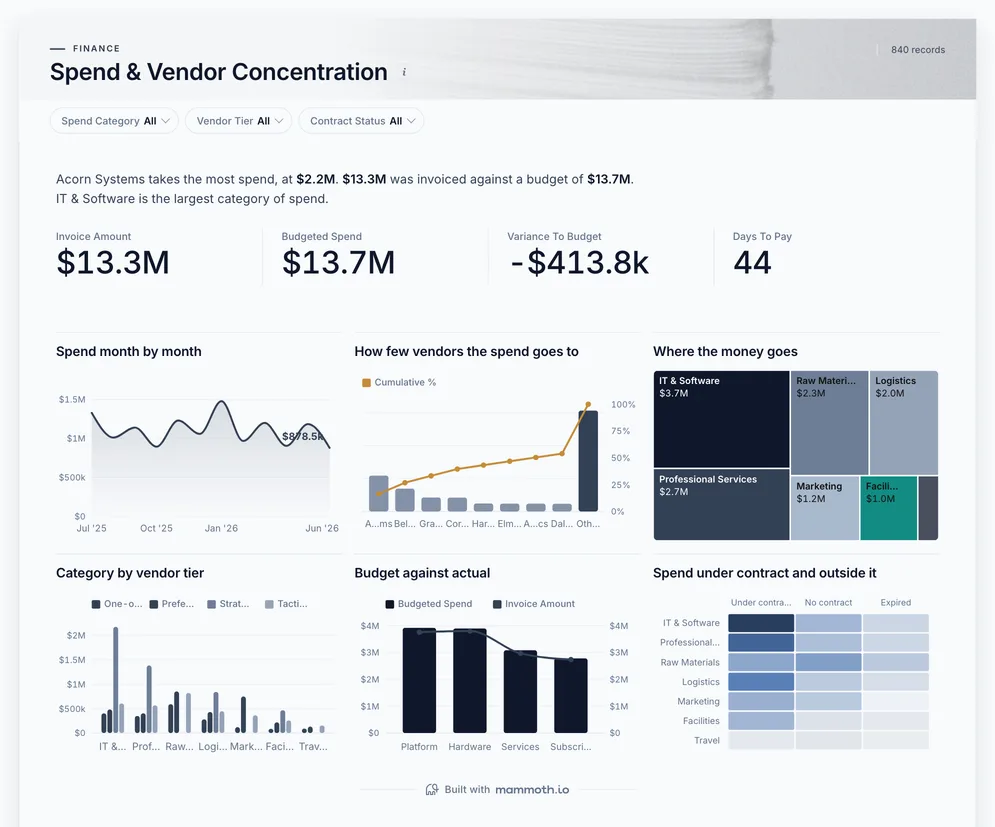
  4. Spend & Vendor Concentration dashboard: Invoice Amount, Budgeted Spend, Variance To Budget and Days To Pay tiles.
    Sample data

    Nonprofit spending dashboard

    Where does the money go after it is raised?

    • Invoice amount
    • Budgeted spend
    • Variance to budget
    • Days to pay
    Use template

Definition

What a nonprofit dashboard is

A nonprofit dashboard is one screen that shows how an organisation raises and spends its money: amount raised and from which channels, how many donors give again, the average gift, what it costs to raise each dollar, and how each programme is spending against its budget. The data usually comes from a donor CRM, the payment platforms and the accounts.

  • Retention, not just totals

    Who gave last year and gave again.

  • Cost to raise a dollar

    By channel and campaign, not one blended number.

  • For the board and funders

    Budget against actual by programme.

The metrics

The metrics a nonprofit dashboard is built from

Eight numbers. Most depend on a definition agreed first, such as what counts as a returning donor.

  • Amount raised

    How much came in?

    What the data needs

    Gifts by date, channel and campaign, net of refunds. Count pledges apart from money received.

  • Gifts

    How many gifts were made?

    What the data needs

    One row per gift. Recurring gifts count each payment, so show them apart from one-off gifts.

  • New donors

    How many people gave for the first time?

    What the data needs

    Each donor's first gift date. Duplicate donor records make returning donors look new.

  • Donor retention

    How many of last year's donors gave again?

    What the data needs

    Donors who gave last year and again this year, against last year's donors.

  • Average gift

    How much does a typical gift bring?

    What the data needs

    Amount raised divided by gifts, by channel. One major gift lifts an average, so read the median too.

  • Cost to raise a dollar

    What does fundraising cost for what it brings in?

    What the data needs

    Fundraising costs and amount raised for the same channel and campaign.

  • Recurring share

    How much of the income repeats each month?

    What the data needs

    Recurring gifts against all gifts by month. It is the most predictable income a nonprofit has.

  • Programme budget variance

    Is each programme spending as planned?

    What the data needs

    Budget and actual by programme and grant for the same period.

How to build one

How to build your own nonprofit dashboard

From one of the examples above to a live dashboard on your own data.

  1. 1

    Pick a template

    Start from any of the four boards above.

  2. 2

    Add your data

    Upload a spreadsheet, or connect one of 100+ tested connectors.

  3. 3

    Clean it once

    Fix and combine your data once. Mammoth repeats those steps for you.

  4. 4

    Set it to refresh

    The dashboard updates on a schedule and flags data that fails a check.

  5. 5

    Share the link

    Public, password-protected or sign-in only, on every plan.

Start with a template

14-day Pro trial · No credit card

FAQ

Nonprofit dashboard questions

Last reviewed against the template catalogue.

What should a nonprofit dashboard show?
Whether the money coming in is growing and steady, and whether it is spent as planned. That means amount raised, recurring giving, donor retention, average gift and cost to raise a dollar by channel, with programme budgets beside them. The four boards above cover those.
What KPIs should a nonprofit track?
Amount raised, number of gifts, new donors, donor retention, average gift and cost to raise a dollar are the core, with the recurring share and budget variance by programme underneath. The list below shows each one with the data it needs.
How do I build a nonprofit dashboard?
Start with the number the board asks for first. Then follow five steps.
  1. Export gifts from the donor CRM with donor, date, amount, channel and campaign.
  2. Add fundraising costs by channel and campaign from the accounts.
  3. Flag recurring gifts, and mark each donor as new or returning against last year.
  4. Check one month's total against the bank and the accounts before anyone relies on the board.
  5. Refresh monthly, and share a read-only view with trustees.
What is a good donor retention rate?
Across the sector, fewer than half of donors give again the next year, and first-time donors return far less often than regular ones. The useful comparison is by channel: the board shows which channels bring donors who stay.
Where does nonprofit data come from?
Usually a donor CRM, online giving and payment platforms, an email platform for appeals, and the accounts. Mammoth has 100+ tested connectors, and can also connect to anything with a REST API. You combine the sources once, and Mammoth repeats the same steps on every refresh.
Can trustees see it without a licence?
Yes. Dashboard viewers are unlimited and free on every Mammoth plan, including the free one, so trustees, staff and volunteers can open it at no per-viewer cost. Only the people building the dashboards count as platform users.

Build the nonprofit dashboard you actually need.

Start from one of these templates or your own spreadsheet. Share it with as many people as you like, free.

  • ✓ 14-day Pro trial
  • ✓ No credit card
  • ✓ Viewers always free