Skip to content

Real estate dashboards

Real estate dashboard examples

Four dashboards for a property portfolio: occupancy, rent and net operating income by market, which tenants owe rent and for how long, each property against its budget, and where the maintenance money goes. Open any of them to see it in full, then use it as a template for your own data.
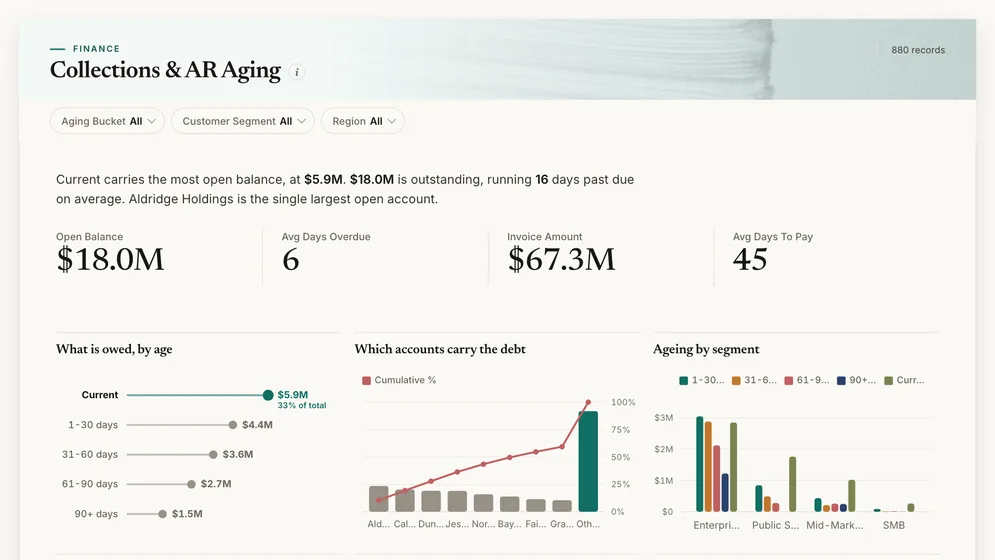
Collections & AR Aging dashboard: Open Balance, Days Overdue, Invoice Amount and Days To Pay tiles.
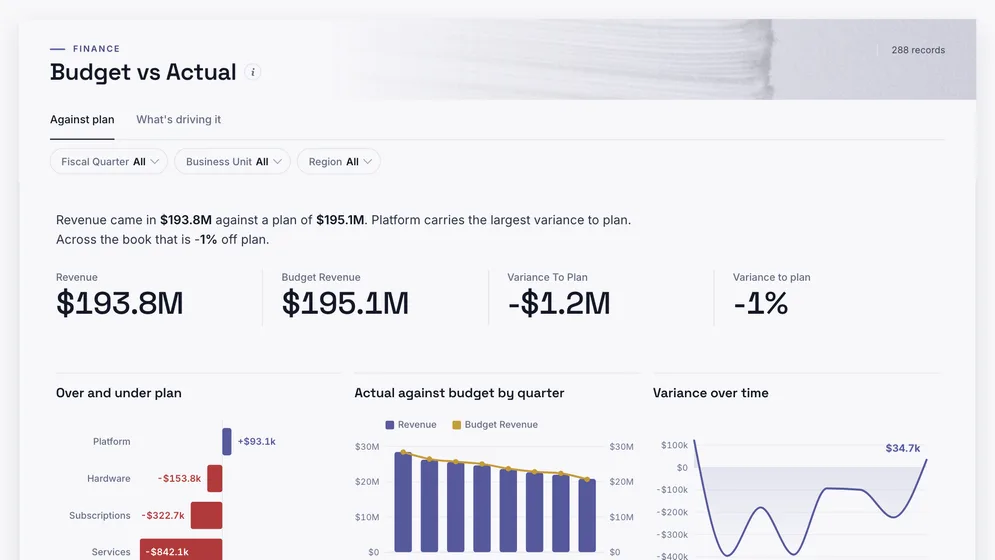
Budget vs Actual dashboard: Revenue, Budget Revenue and Variance To Plan tiles, above Over and under plan.
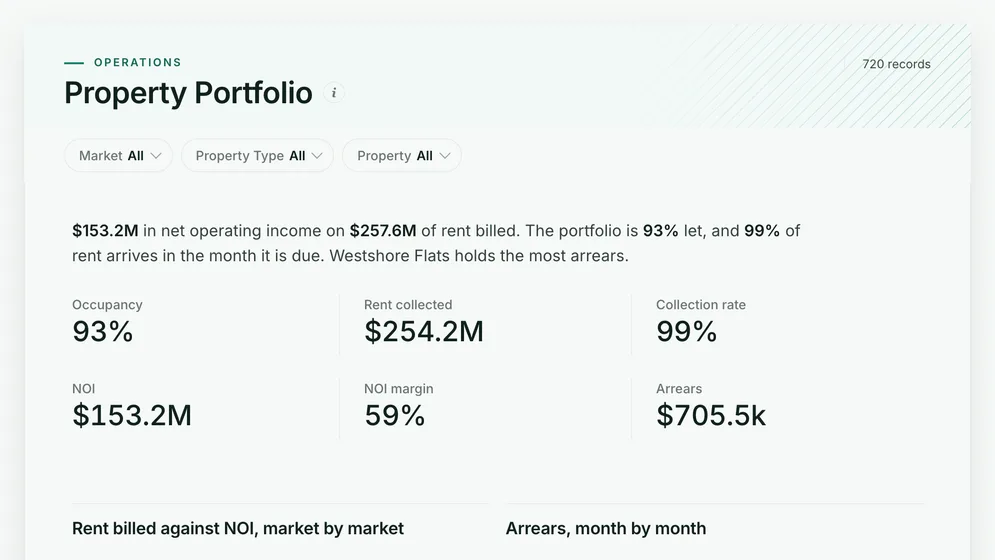
Property Portfolio dashboard: Occupancy, Rent collected, Collection rate, NOI, NOI margin and Arrears tiles.

Three of the four examples. All figures are sample data.

The examples

Four real estate dashboard examples and templates

Click a board to see all of it. Click Use template to start your own copy in Mammoth. All figures are sample data.

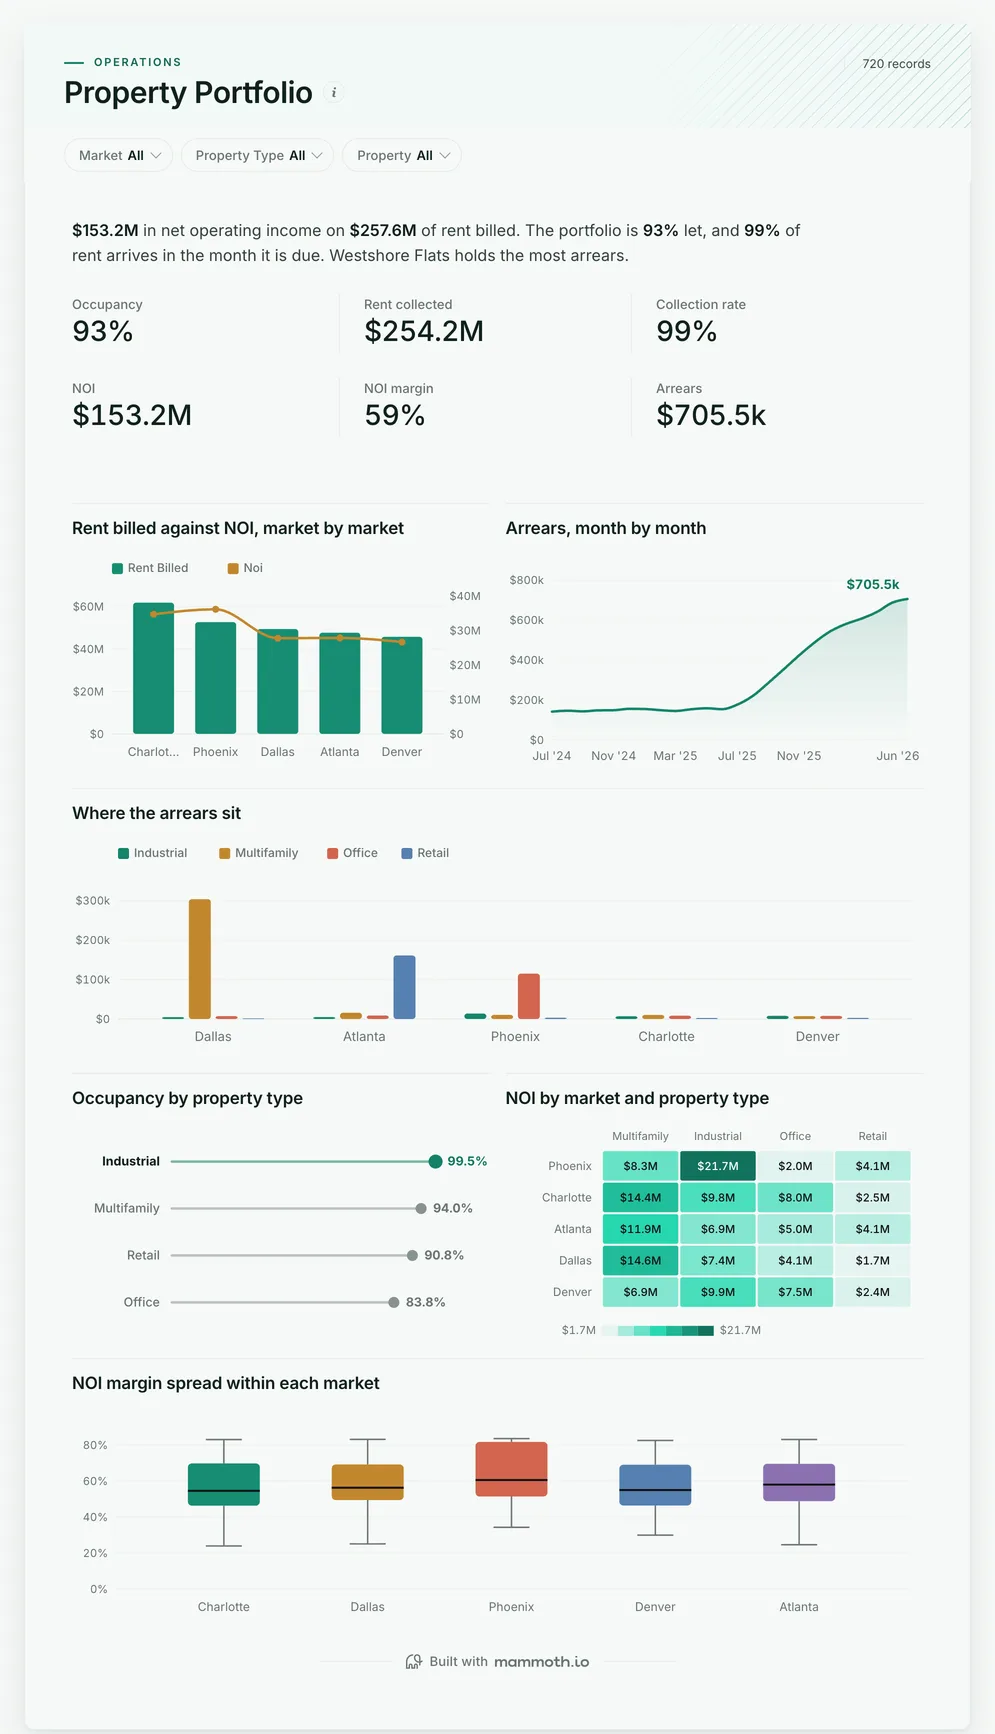
  1. Property Portfolio dashboard: Occupancy, Rent collected, Collection rate, NOI, NOI margin and Arrears tiles.
    Sample data

    Real estate portfolio dashboard

    Are the buildings full, and is the rent coming in?

    • Occupancy
    • Rent collected
    • Collection rate
    • NOI
    Use template
  2. Collections & AR Aging dashboard: Open Balance, Days Overdue, Invoice Amount and Days To Pay tiles.
    Sample data

    Rent arrears and aging dashboard

    Which tenants owe rent, and how late is it?

    • Open balance
    • Days overdue
    • Invoice amount
    • Days to pay
    Use template
  3. Budget vs Actual dashboard: Revenue, Budget Revenue and Variance To Plan tiles, above Over and under plan.
    Sample data

    Property budget vs actual dashboard

    Is each property running to budget?

    • Revenue
    • Budget revenue
    • Variance to plan
    Use template
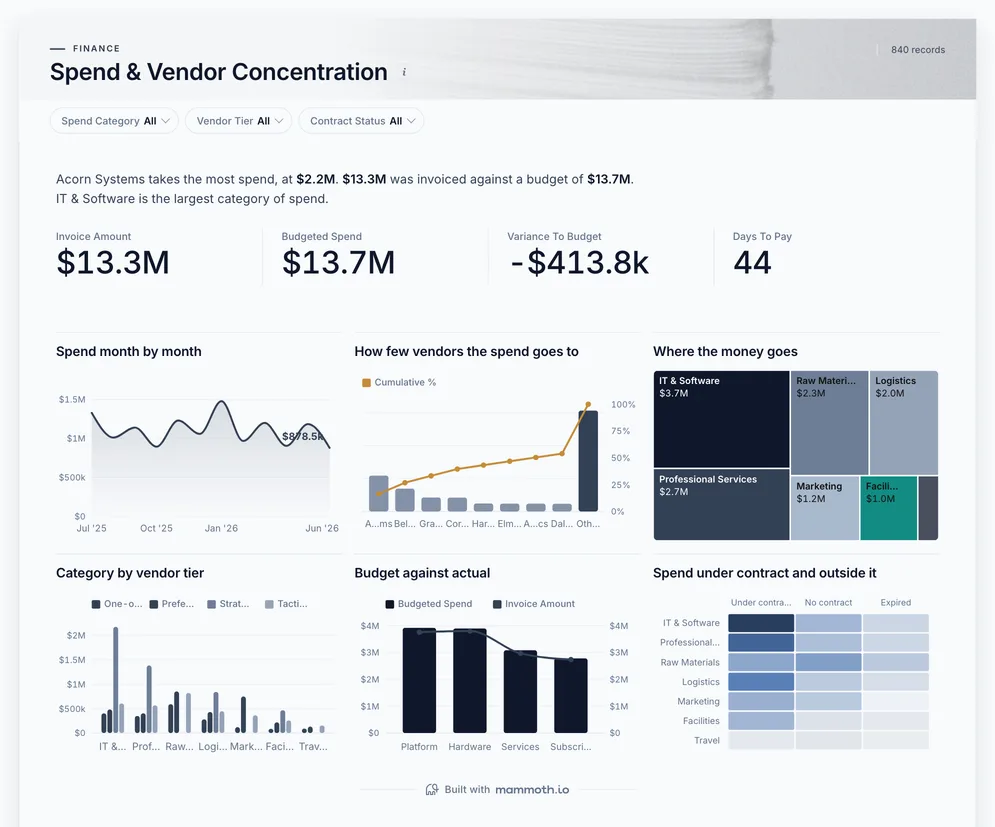
  4. Spend & Vendor Concentration dashboard: Invoice Amount, Budgeted Spend, Variance To Budget and Days To Pay tiles.
    Sample data

    Property maintenance spend dashboard

    Where does the maintenance money go?

    • Invoice amount
    • Budgeted spend
    • Variance to budget
    • Days to pay
    Use template

Definition

What a real estate dashboard is

A real estate dashboard is one screen that shows how a property portfolio is performing: how full the buildings are, how much rent was billed and collected, net operating income, and who is behind on rent. The data usually comes from a property management system, the rent roll and the accounts.

  • Every building, one view

    Occupancy, rent and NOI on the same definitions.

  • Arrears before write-offs

    Who owes what, and how long it has been owed.

  • The spread, not the average

    One weak building shows inside a good market.

The metrics

The metrics a real estate dashboard is built from

Eight numbers. Most depend on a definition agreed first, such as when a unit counts as let or when late rent becomes arrears.

  • Occupancy rate

    What share of the space is let?

    What the data needs

    Let and total units or square feet per property, on the same date. Count by area as well as by unit, or one empty floor reads like one empty flat.

  • Rent collected

    How much of the rent billed arrived?

    What the data needs

    Rent billed and rent received per tenant and month. Take receipts from the bank or the ledger, not the billing system, which records what was asked for.

  • Collection rate

    What share of rent arrives in the month it is due?

    What the data needs

    Due dates and payment dates per invoice. A rate taken over the year hides a month when half the rent came late.

  • Net operating income

    What does each property earn after running costs?

    What the data needs

    Rent and other income less operating costs, per property, before debt and depreciation. Costs booked to the portfolio rather than the building make every property look better than it is.

  • NOI margin

    How much of each dollar of rent is kept?

    What the data needs

    NOI and rent billed for the same property and period. Show it as a spread within each market, because the average hides the building pulling it down.

  • Arrears

    How much rent is owed, by whom, and for how long?

    What the data needs

    Open balances per tenant with the date each charge fell due. Without the age, a tenant a week late and one six months behind look the same.

  • Budget variance

    Which properties are running over their operating budget?

    What the data needs

    Budget and actual per property and cost line for the same period. A portfolio total can be on budget while two buildings are well over.

  • Maintenance cost per property

    What does each building cost to keep up?

    What the data needs

    Repair and service spend coded to the property it was for. Spend booked to a head-office cost centre disappears from the building that needed it.

How to build one

How to build your own real estate dashboard

From one of the examples above to a live dashboard on your own data.

  1. 1

    Pick a template

    Start from any of the four boards above.

  2. 2

    Add your data

    Upload a spreadsheet, or connect one of 100+ tested connectors.

  3. 3

    Clean it once

    Fix and combine your data once. Mammoth repeats those steps for you.

  4. 4

    Set it to refresh

    The dashboard updates on a schedule and flags data that fails a check.

  5. 5

    Share the link

    Public, password-protected or sign-in only, on every plan.

Start with a template

14-day Pro trial · No credit card

FAQ

Real estate dashboard questions

Last reviewed against the template catalogue.

What should a real estate dashboard show?
Whether the portfolio is full, paid and profitable. That means occupancy by property, rent billed against rent collected, net operating income and its margin, and arrears by tenant and age. The four boards above cover those, with budget and maintenance spend beside them.
What KPIs should a real estate dashboard track?
Occupancy, rent collected, collection rate, net operating income, NOI margin and arrears are the core, with budget variance and maintenance spend per property underneath. The list below shows each one with the data it needs.
How do I build a real estate dashboard?
Start with the number the asset review opens with. Then follow five steps.
  1. Connect the property management system and the accounts, or upload the rent roll and ledger exports.
  2. Use one code per property and per tenant in every source.
  3. Agree what counts as occupied, and when unpaid rent becomes arrears.
  4. Check one month of rent collected against the bank before anyone relies on the board.
  5. Refresh monthly at least, and give each property manager a view filtered to their buildings.
What is the difference between a real estate dashboard and a financial dashboard?
The unit. A financial dashboard reads the business as revenue and margin by unit and region. A real estate dashboard reads it building by building: occupancy, rent per property and the tenants behind the arrears. Financial dashboard examples
Where does real estate data come from?
Usually a property management system, the rent roll, the general ledger and a spreadsheet of budgets or capital works. Mammoth has 100+ tested connectors, and can also connect to anything with a REST API. You combine the sources once, and Mammoth repeats the same steps on every refresh.
Can owners and property managers see it without a licence?
Yes. Dashboard viewers are unlimited and free on every Mammoth plan, including the free one, so each owner, asset manager and property manager can open it at no per-viewer cost. Only the people building the dashboards count as platform users.

Build the real estate dashboard you actually need.

Start from one of these templates or your own spreadsheet. Share it with as many people as you like, free.

  • ✓ 14-day Pro trial
  • ✓ No credit card
  • ✓ Viewers always free