Skip to content

Manufacturing dashboards

Manufacturing dashboard examples

Five dashboards for a plant: OEE, yield and downtime by line, materials about to run short, the value tied up in stock, how much depends on a few suppliers, and whether finished orders leave on time. Open any of them to see it in full, then use it as a template for your own data.
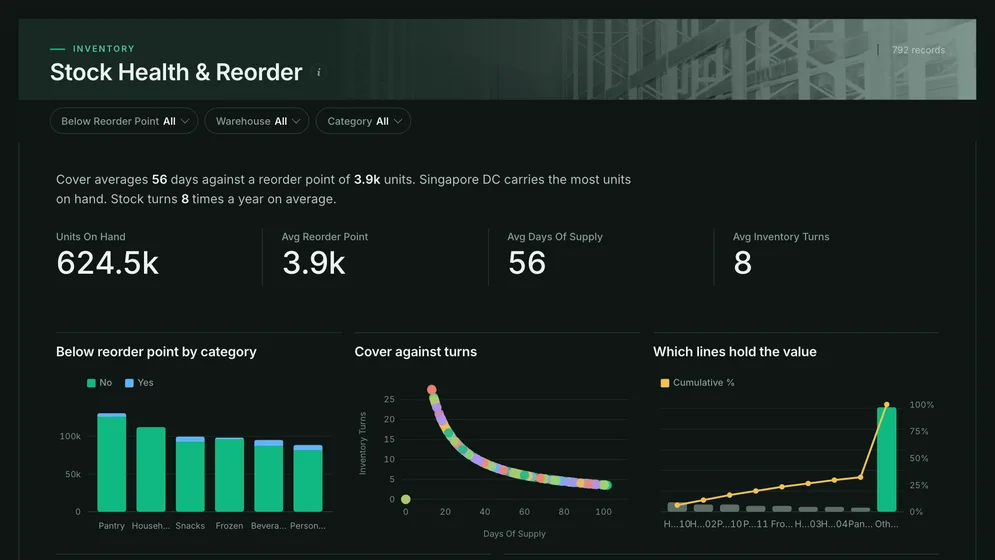
Stock Health & Reorder dashboard: Units On Hand, Reorder Point, Days Of Supply and Inventory Turns tiles.
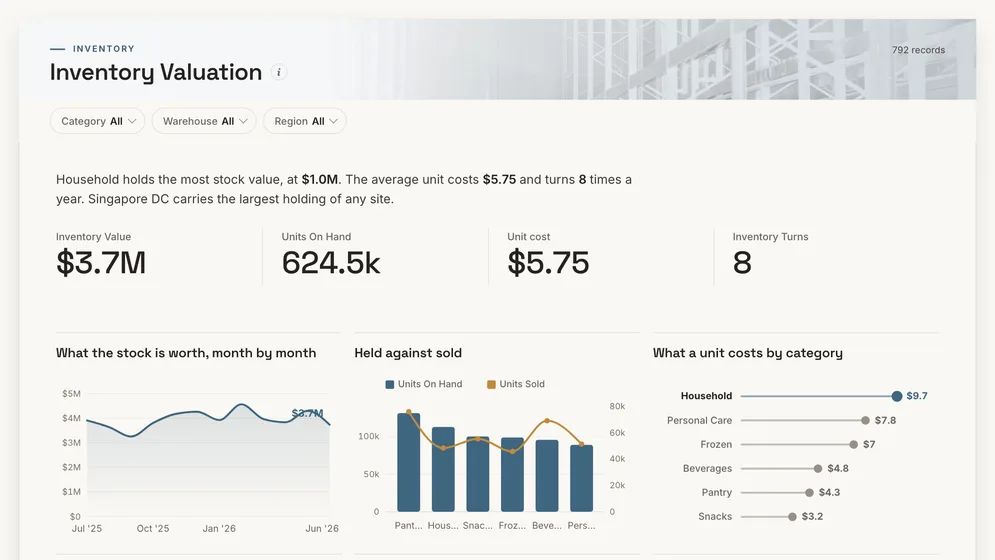
Inventory Valuation dashboard: Inventory Value, Units On Hand, Unit cost and Inventory Turns tiles.
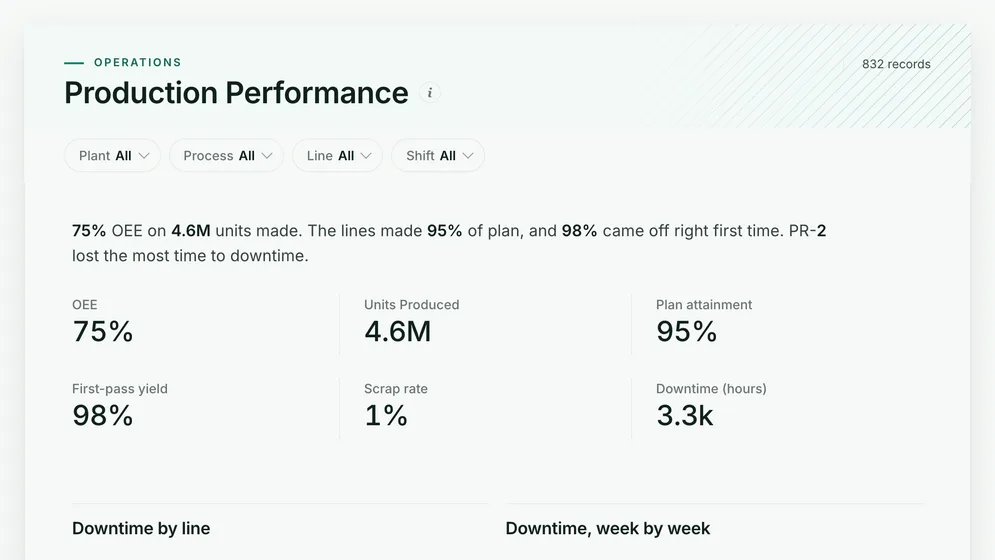
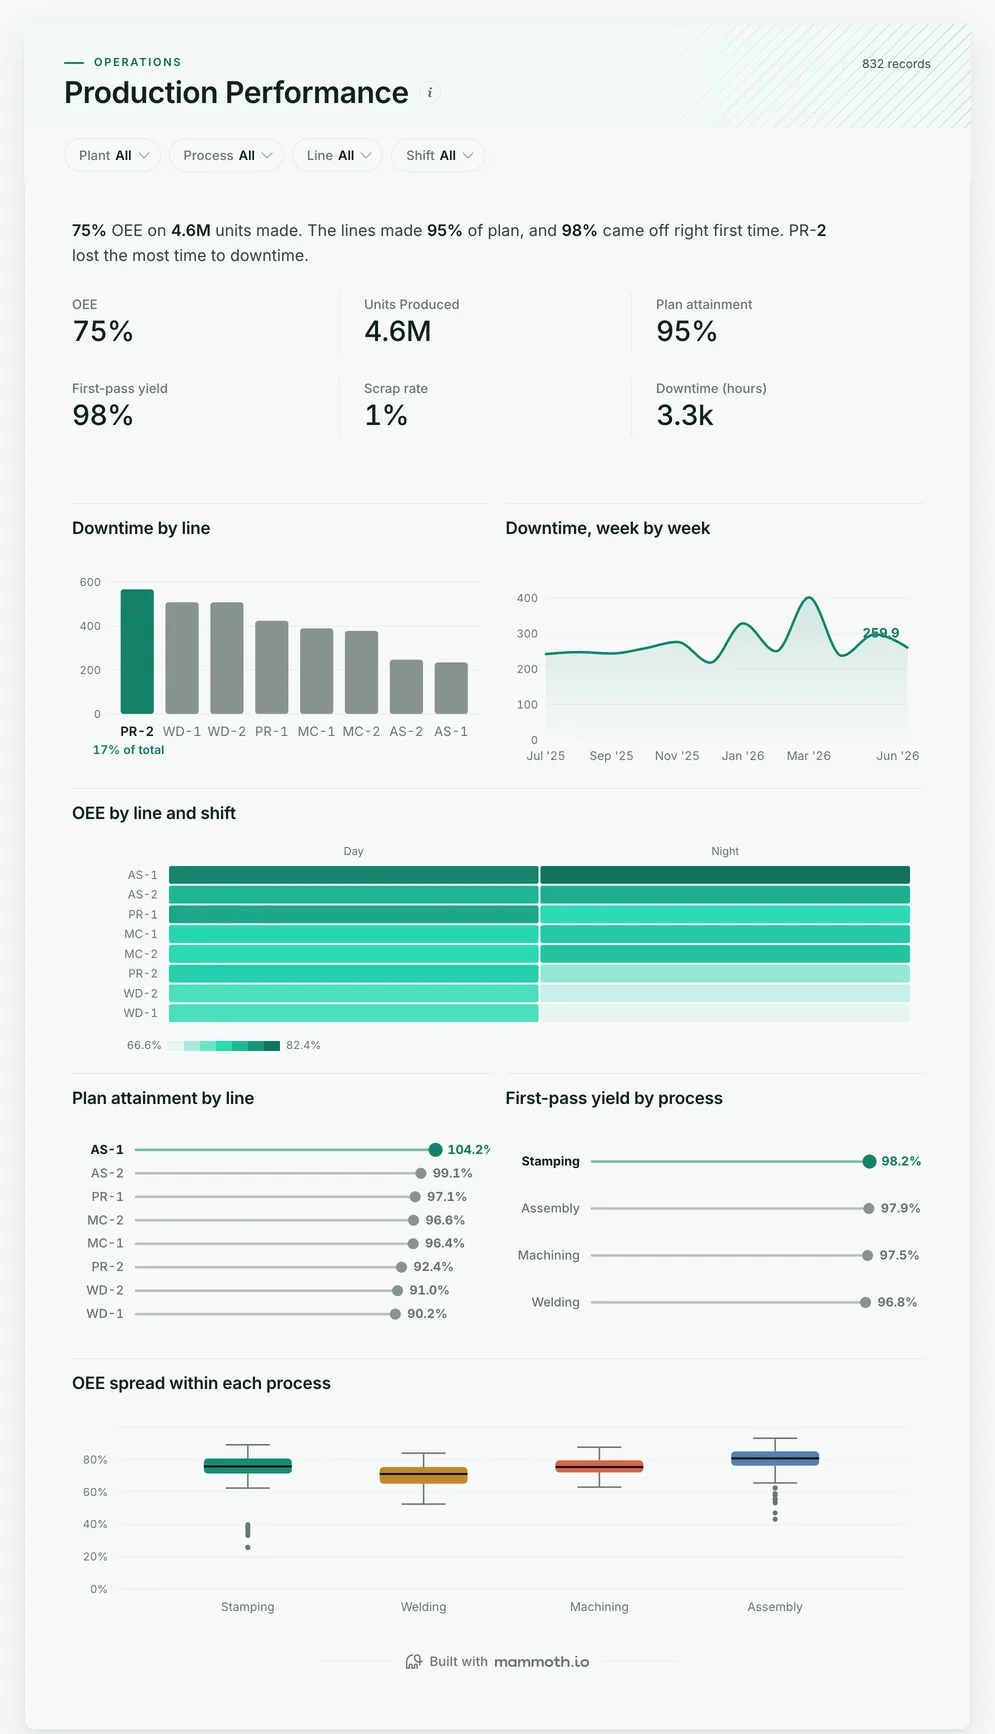
Production Performance dashboard: OEE, Units Produced, Plan attainment, First-pass yield and Scrap rate tiles.

Three of the five examples. All figures are sample data.

The examples

Five manufacturing dashboard examples and templates

Click a board to see all of it. Click Use template to start your own copy in Mammoth. All figures are sample data.

  1. Production Performance dashboard: OEE, Units Produced, Plan attainment, First-pass yield and Scrap rate tiles.
    Sample data

    Manufacturing production dashboard

    Is each line making its plan, and where is the time going?

    • OEE
    • Units produced
    • Plan attainment
    • First-pass yield
    Use template
  2. Stock Health & Reorder dashboard: Units On Hand, Reorder Point, Days Of Supply and Inventory Turns tiles.
    Sample data

    Manufacturing materials and reorder dashboard

    Which parts will run out before the next delivery?

    • Units on hand
    • Reorder point
    • Days of supply
    • Inventory turns
    Use template
  3. Inventory Valuation dashboard: Inventory Value, Units On Hand, Unit cost and Inventory Turns tiles.
    Sample data

    Manufacturing inventory value dashboard

    How much cash is tied up in stock?

    • Inventory value
    • Units on hand
    • Unit cost
    • Inventory turns
    Use template
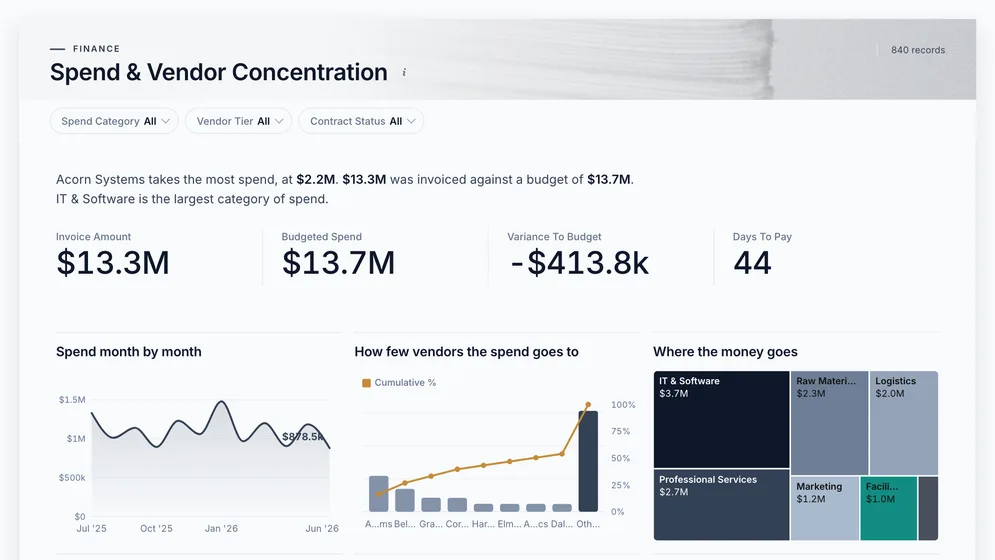
  4. Spend & Vendor Concentration dashboard: Invoice Amount, Budgeted Spend, Variance To Budget and Days To Pay tiles.
    Sample data

    Manufacturing supplier spend dashboard

    How much depends on a few suppliers?

    • Invoice amount
    • Budgeted spend
    • Variance to budget
    • Days to pay
    Use template
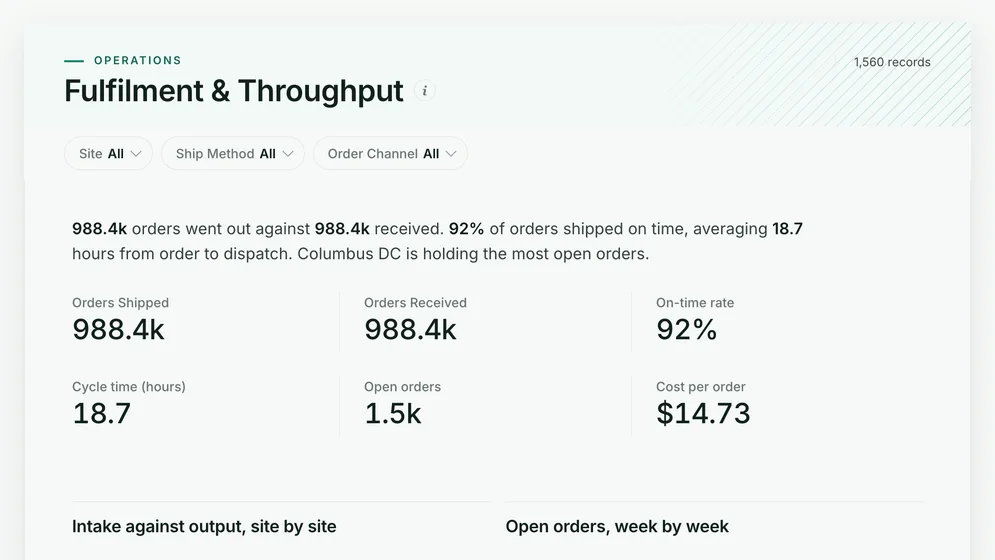
  5. Fulfilment & Throughput dashboard: Orders Shipped, Orders Received, On-time rate, Cycle time (hours) and Open orders tiles.
    Sample data

    Manufacturing order fulfilment dashboard

    Are finished orders leaving on time?

    • Orders shipped
    • Orders received
    • On-time rate
    • Cycle time (hours)
    Use template

Definition

What a manufacturing dashboard is

A manufacturing dashboard is one screen that shows how production is going: how much each line made against plan, how much of it was good first time, how much was scrapped, and where the time went in downtime. The data usually comes from the production or MES system, the ERP and quality records.

  • Line against line

    OEE, yield and downtime on the same definitions.

  • Shift by shift

    A weak line on nights stands out from a weak line.

  • Before the line stops

    Materials below reorder point show up first.

The metrics

The metrics a manufacturing dashboard is built from

Eight numbers. OEE and downtime depend on an agreed definition of planned time, so settle that before comparing lines.

  • OEE

    How much of the planned time made good product at full speed?

    What the data needs

    Planned time, run time, ideal cycle time, units made and good units per line and shift. Plants that leave changeovers out of planned time report a higher OEE than plants that count them.

  • Plan attainment

    Did each line make what was scheduled?

    What the data needs

    Planned and actual units per line and period. Measure against the plan as it stood at the start of the shift, not one revised after the fact.

  • First-pass yield

    What share of units are good first time?

    What the data needs

    Units made and units passing without rework, per line or process. Counting reworked units as good hides the cost of fixing them.

  • Scrap rate

    How much material ends up in the bin?

    What the data needs

    Scrapped and total units, or scrapped material by weight, per line. Record the reason code, or the rate goes up with no clue why.

  • Downtime

    How many hours did each line stand still, and why?

    What the data needs

    Stop start and end times with a reason per stop. Without reason codes, a long changeover and a breakdown look the same.

  • Availability

    What share of planned time was the line running?

    What the data needs

    Run time and planned time per line and shift. It is the part of OEE that downtime explains, so read the two together.

  • Materials below reorder point

    Which parts will run out before the next delivery?

    What the data needs

    Stock on hand and a reorder point per part that reflects the supplier's real lead time. A part that runs dry stops a line however good its OEE.

  • On-time delivery

    What share of customer orders ship by the promised date?

    What the data needs

    A promised date and a ship date per order. Goods finished late on the line show up here a few days later.

How to build one

How to build your own manufacturing dashboard

From one of the examples above to a live dashboard on your own data.

  1. 1

    Pick a template

    Start from any of the five boards above.

  2. 2

    Add your data

    Upload a spreadsheet, or connect one of 100+ tested connectors.

  3. 3

    Clean it once

    Fix and combine your data once. Mammoth repeats those steps for you.

  4. 4

    Set it to refresh

    The dashboard updates on a schedule and flags data that fails a check.

  5. 5

    Share the link

    Public, password-protected or sign-in only, on every plan.

Start with a template

14-day Pro trial · No credit card

FAQ

Manufacturing dashboard questions

Last reviewed against the template catalogue.

What should a manufacturing dashboard show?
Whether each line is making what it should, at the quality it should. That means OEE, plan attainment, first-pass yield, scrap and downtime by line and shift. The production board above covers those, and the other four cover the materials going in and the orders going out.
What KPIs should a manufacturing dashboard track?
OEE, plan attainment, first-pass yield, scrap rate and downtime are the core, with availability, materials below reorder point, inventory value and on-time delivery underneath. The list below shows each one with the data it needs.
How do I build a manufacturing dashboard?
Start with the line the morning production meeting argues about. Then follow five steps.
  1. Connect the production system and the ERP, or upload their exports, and add quality records for scrap and rework.
  2. Use the same line, shift and product codes in every source.
  3. Agree what counts as planned time and what counts as downtime, before anyone calculates OEE.
  4. Check a week of units made against the plant's own count before anyone relies on the board.
  5. Refresh as often as the floor acts on it, and give each line lead a view filtered to their line.
What is the difference between a manufacturing dashboard and an operations dashboard?
Where it starts. An operations dashboard covers work that moves goods or tickets through a business, such as warehouses and support queues. A manufacturing dashboard starts on the line where the goods are made, with plan, yield, scrap and downtime. Operations dashboard examples
How often should it refresh?
As often as someone acts on it. A line watched through a shift needs several refreshes a day, while stock value and supplier spend are fine daily or weekly. How often you can refresh depends on your plan. See plans and refresh rates
Can line leads and supervisors see it without a licence?
Yes. Dashboard viewers are unlimited and free on every Mammoth plan, including the free one, so each line lead, supervisor and plant manager can open it at no per-viewer cost. Only the people building the dashboards count as platform users.

Build the manufacturing dashboard you actually need.

Start from one of these templates or your own spreadsheet. Share it with as many people as you like, free.

  • ✓ 14-day Pro trial
  • ✓ No credit card
  • ✓ Viewers always free