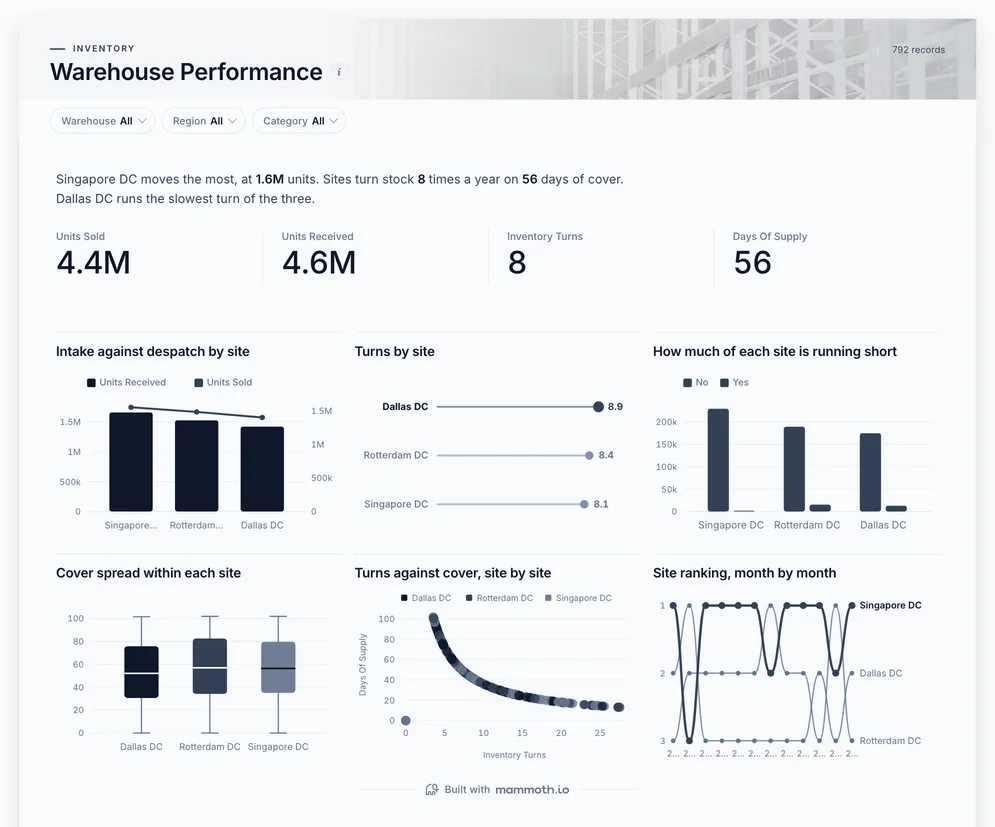
Warehouse dashboard
Is each site shipping as fast as stock comes in?
- Units sold
- Units received
- Inventory turns
- Days of supply
Warehouse dashboards
Five dashboards for the people running the building: intake against despatch by site, orders out on time and the backlog behind them, lines about to run short, stock that has stopped moving, and what is on hand. Open any of them to see it in full, then use it as a template for your own data.
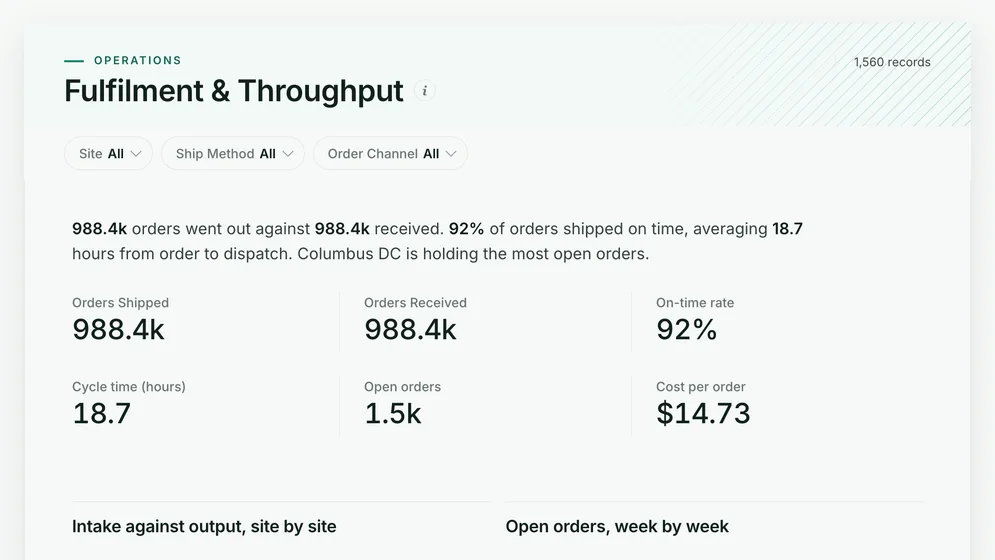
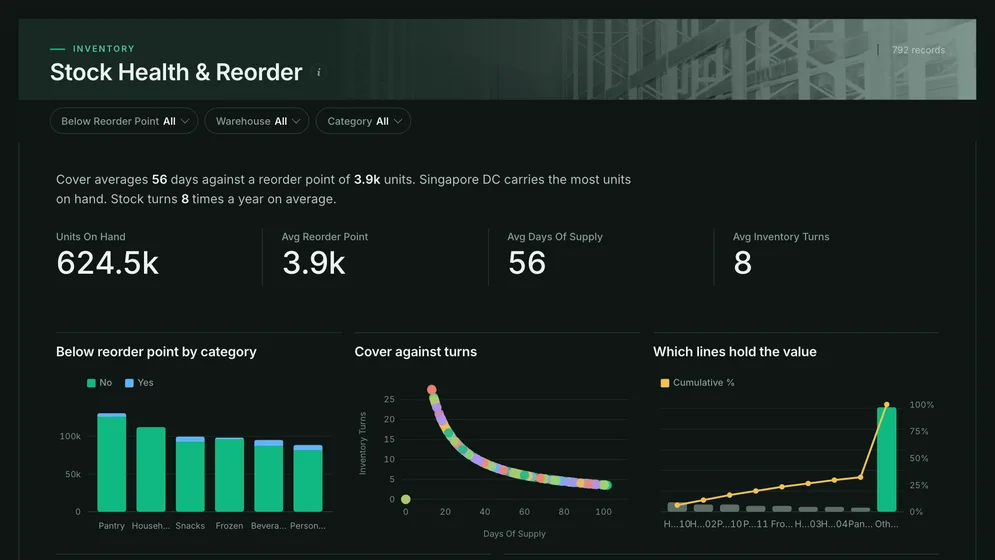
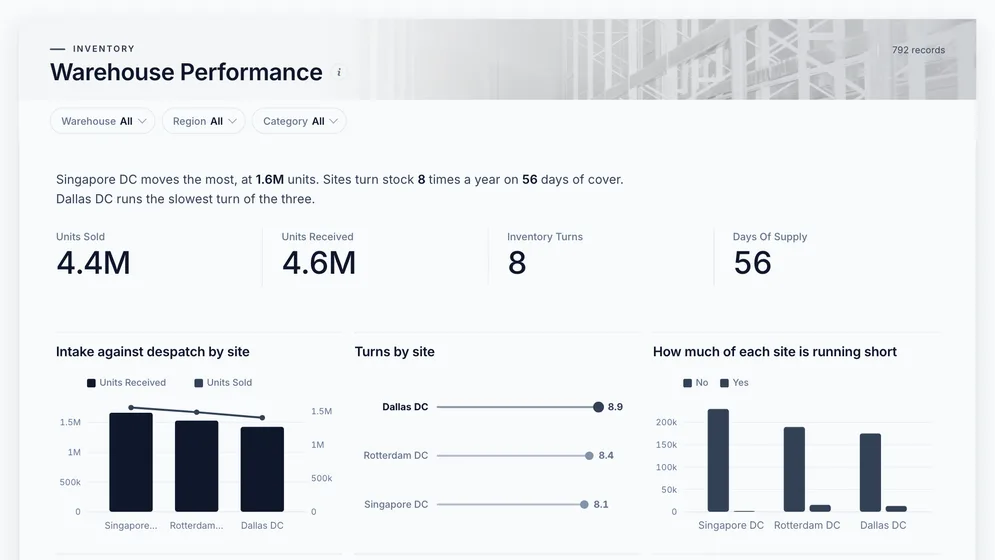
Three of the five examples. All figures are sample data.
The examples
Click a board to see all of it. Click Use template to start your own copy in Mammoth. All figures are sample data.
Is each site shipping as fast as stock comes in?
Are orders leaving on time, and where is the backlog?
Which pick faces will run empty before the next delivery?
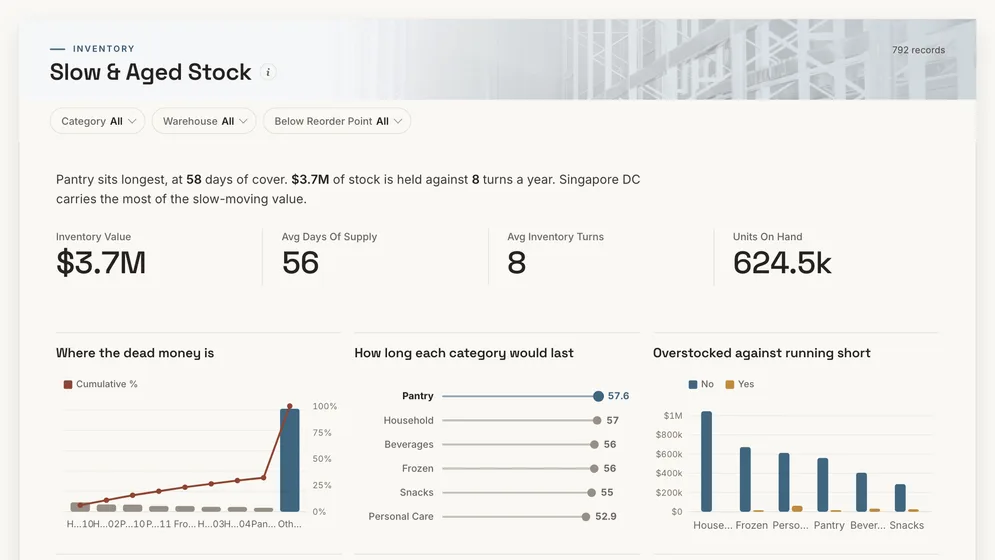
What is taking up space and not moving?
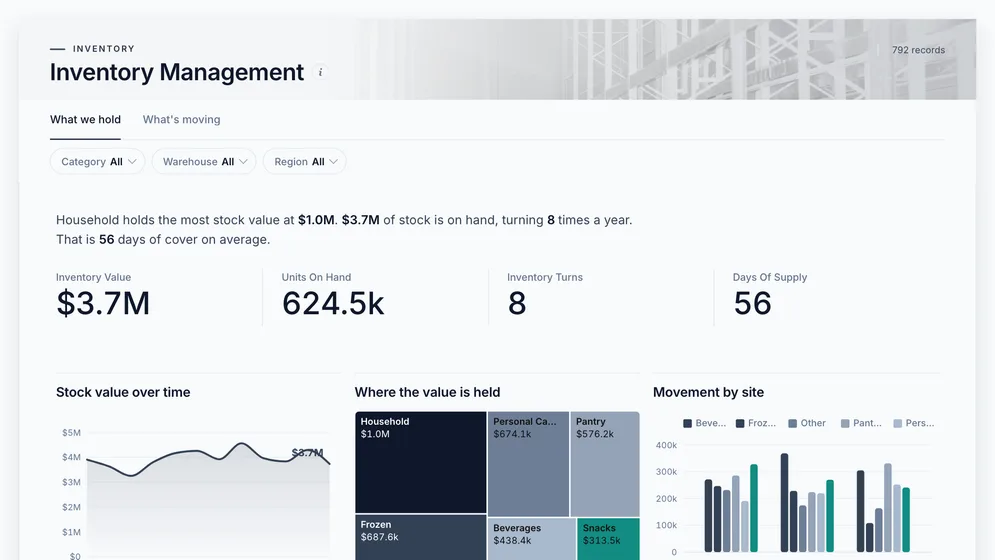
How much is on hand, where, and how fast is it turning?
Definition
A warehouse dashboard is one screen that shows how a warehouse or a network of them is keeping up: stock received, orders shipped, orders on time, the backlog, and stock that is running short or not moving. The data comes from the warehouse system, stock records and carrier exports.
Every warehouse on the same chart, same definitions.
Intake against despatch, week by week.
Slow lines take the locations fast ones need.
The metrics
Eight numbers. Most need a timestamp agreed first, because a warehouse system records several and each gives a different answer.
What share of orders leave by the promised time?
A promised ship time and an actual ship time per order. Measure against the promise, not the order time, or a slow cut-off looks like a fast warehouse.
How long from order received to shipped?
Timestamps per stage in one time zone. Show the spread by site, because a few slow orders hide inside a good average.
What share of orders ship complete?
Ordered and shipped quantities per line. A backorder filled next week is still a miss on the day.
How many orders are waiting, and is the queue growing?
Orders received and shipped over the same window, per site. Output alone looks fine while the queue behind it doubles.
Is each site shipping as fast as stock arrives?
Units received and units shipped by site and week. A site that receives faster than it ships is running out of room.
How often does the stock in the building sell through?
Cost of goods sold and average stock value for the same period and site. A month-end snapshot misses the swings in between.
Which pick faces will run empty?
A reorder point per item and site that reflects the real lead time. A network-wide total can look healthy while one site runs dry.
What does it cost to get one order out?
Labour, packing and shipping cost for the same period and site as the order count. Leave labour out and the cheapest site is the one on overtime.
How to build one
From one of the examples above to a live dashboard on your own data.
Start from any of the five boards above.
Upload a spreadsheet, or connect one of 100+ tested connectors.
Fix and combine your data once. Mammoth repeats those steps for you.
The dashboard updates on a schedule and flags data that fails a check.
Public, password-protected or sign-in only, on every plan.
14-day Pro trial · No credit card
FAQ
Last reviewed against the template catalogue.
Start from one of these templates or your own spreadsheet. Share it with as many people as you like, free.
More dashboard examples


