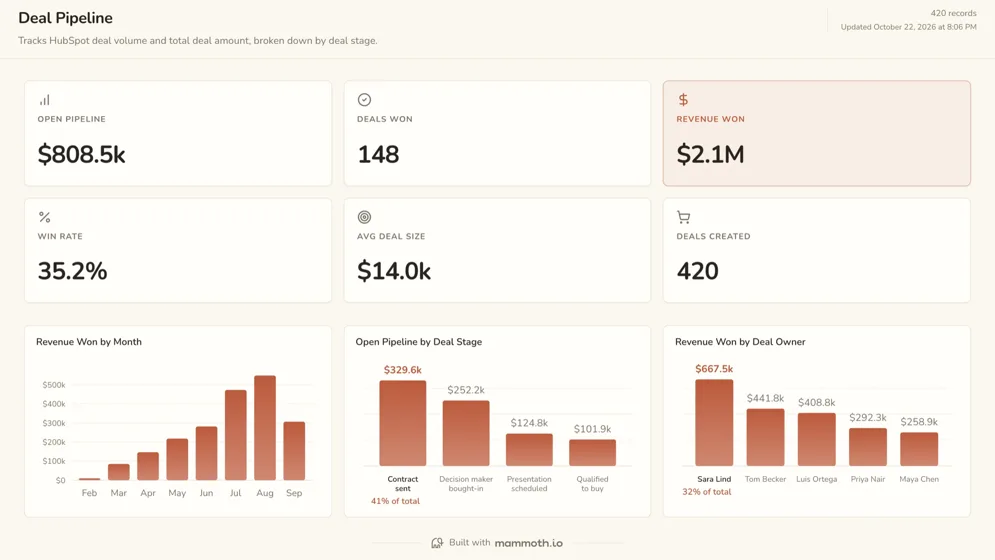
HubSpot CRM dashboard
How much is in the HubSpot pipeline, and who is closing it?
- Open pipeline
- Deals won
- Revenue won
- Win rate
CRM dashboards
Five dashboards built on CRM data: one each for HubSpot, Salesforce and Pipedrive, then a pipeline board and a closed revenue board that work on any CRM's export. Open any of them to see it in full, then use it as a template for your own data.
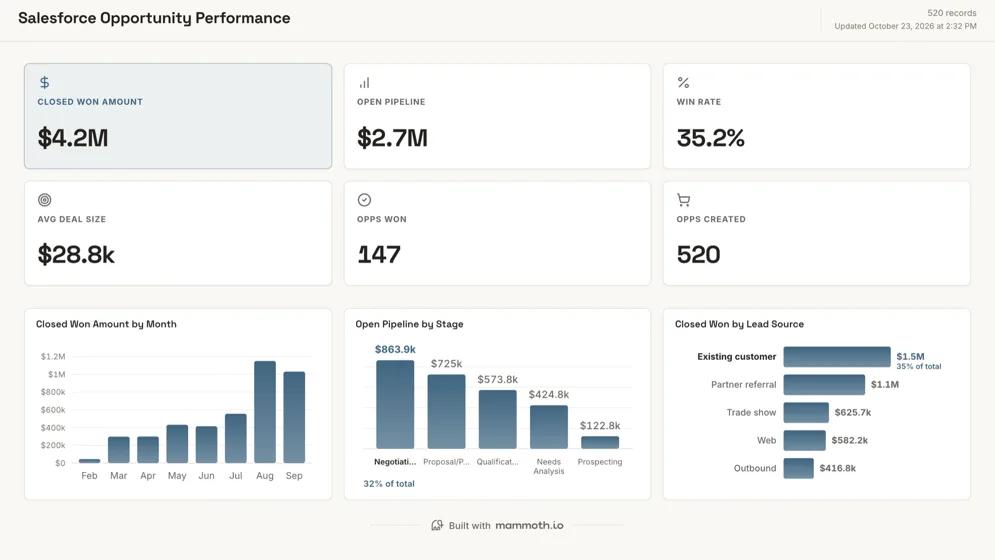
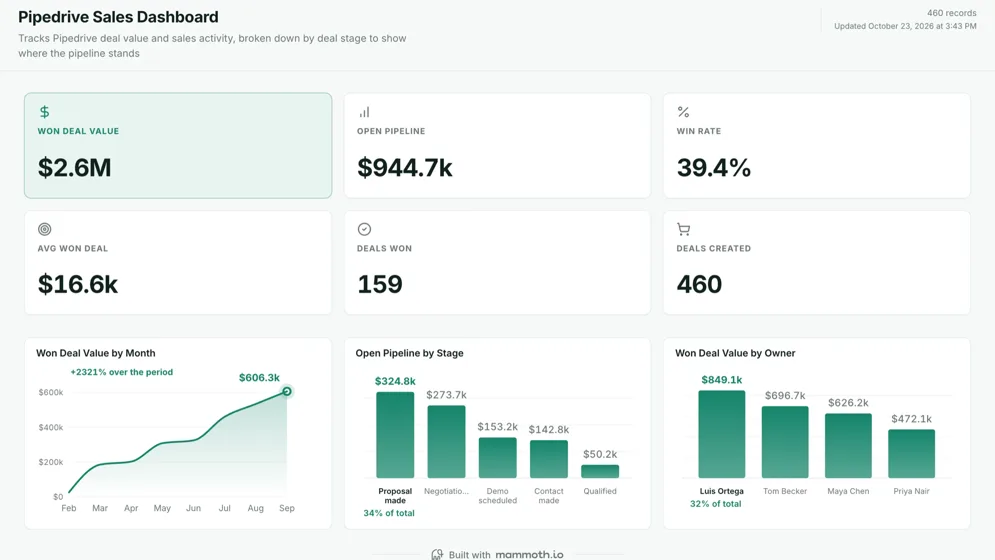
Three of the five examples. All figures are sample data.
The examples
Click a board to see all of it. Click Use template to start your own copy in Mammoth. All figures are sample data.
How much is in the HubSpot pipeline, and who is closing it?
Which lead sources turn into closed revenue in Salesforce?
Is the Pipedrive pipeline big enough to hit the number, and whose deals are moving?
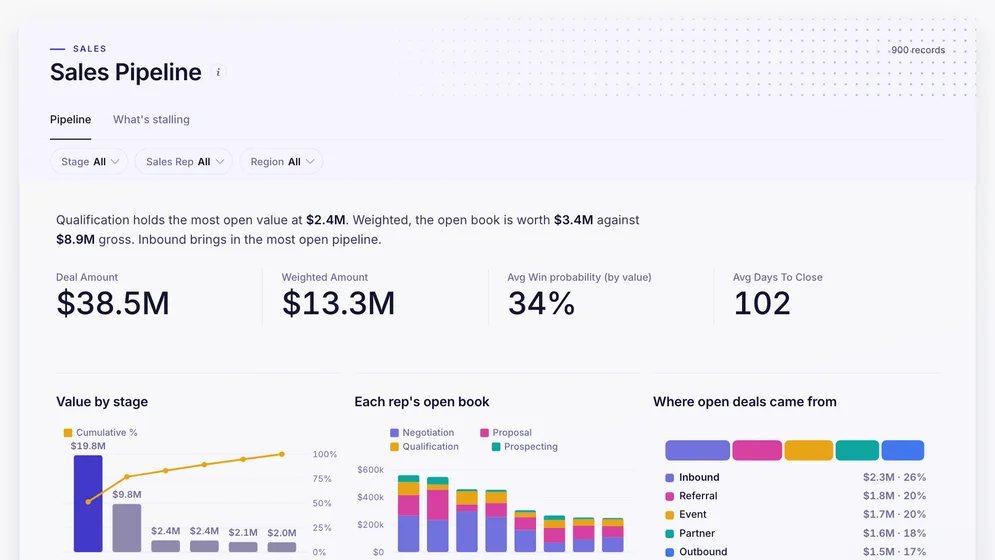
Where is the open pipeline, and which deals are taking too long?
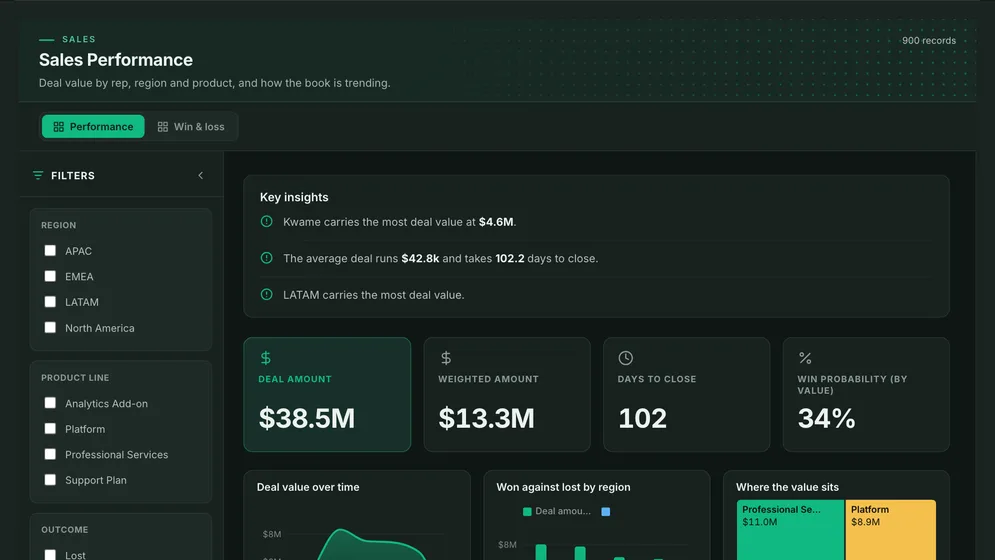
Which reps, regions and products are closing the revenue?
Definition
A CRM dashboard is one screen that shows what is happening in a company's customer records: deals created, deals won, the pipeline still open and who owns it. Every CRM has reports of its own, but they stop at the CRM's edge and need a CRM seat to read.
HubSpot and Salesforce connect; Pipedrive reads an export.
What is open next to what has closed.
Anyone can open it, with no CRM seat.
The metrics
Eight numbers. Most depend on a definition the CRM leaves to you, such as when a deal counts as lost or which date a won deal belongs to.
How much could still close?
Deal amount and stage for every deal not yet won or lost. Stale deals left open inflate it, so set a rule for closing them out.
How much closed this period?
Won deals by close date. Using the created date instead moves revenue into the month the deal started.
What share of deals do we win?
Won deals over a defined base: all deals created, or only won plus lost. State which, because the two differ widely in a growing pipeline.
What is a typical won deal worth?
Amounts on won deals only. One very large deal pulls the average up, so look at the spread by owner as well.
Is enough new pipeline coming in?
Created date per deal. Compare it with deals won a cycle later, because today's creation is next quarter's revenue.
How long does a deal take to close?
Created and closed dates on won deals. Show it by source, because inbound and outbound deals rarely move at the same speed.
Where are the open deals sitting?
Stage names that mean the same thing for every owner. If reps use stages differently, the chart describes habits, not deals.
Which sources bring in the deals that close?
A lead source field filled in on every deal. Blank sources grow over time and quietly become the biggest bar.
How to build one
From one of the examples above to a live dashboard on your own data.
Start from any of the five boards above.
Upload a spreadsheet, or connect one of 100+ tested connectors.
Fix and combine your data once. Mammoth repeats those steps for you.
The dashboard updates on a schedule and flags data that fails a check.
Public, password-protected or sign-in only, on every plan.
14-day Pro trial · No credit card
FAQ
Last reviewed against the template catalogue.
Start from one of these templates or your own spreadsheet. Share it with as many people as you like, free.
More dashboard examples


