Social media dashboard
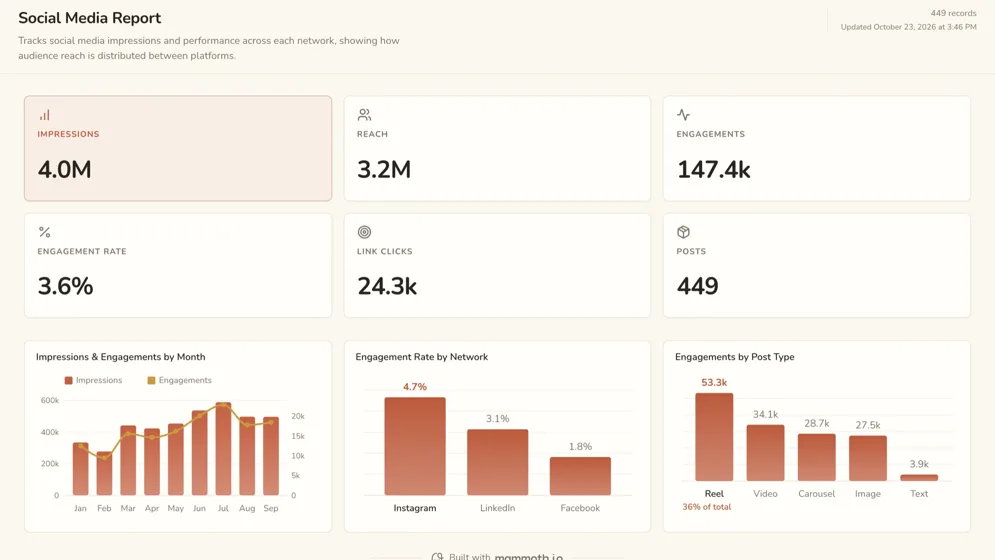
Which network and which kind of post earns the most attention?
- Impressions
- Reach
- Engagements
- Engagement rate
Social media dashboards
Five dashboards for social: one across Instagram, Facebook and LinkedIn, one each for Instagram, YouTube and a LinkedIn page, and one for paid social. Open any of them to see it in full, then use it as a template for your own data.
Three of the five examples. All figures are sample data.
The examples
Click a board to see all of it. Click Use template to start your own copy in Mammoth. All figures are sample data.
Which network and which kind of post earns the most attention?
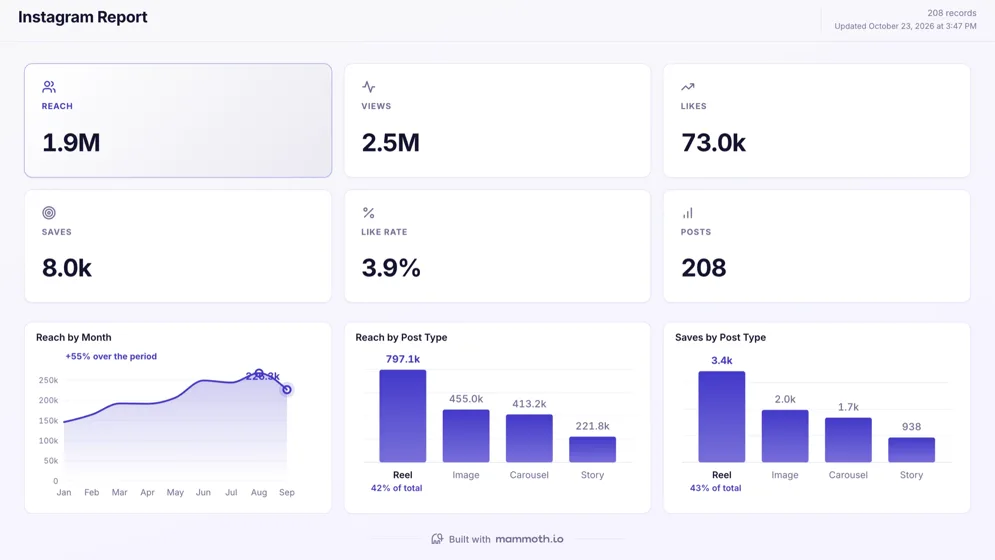
Which Instagram posts reach people, and which do they save?
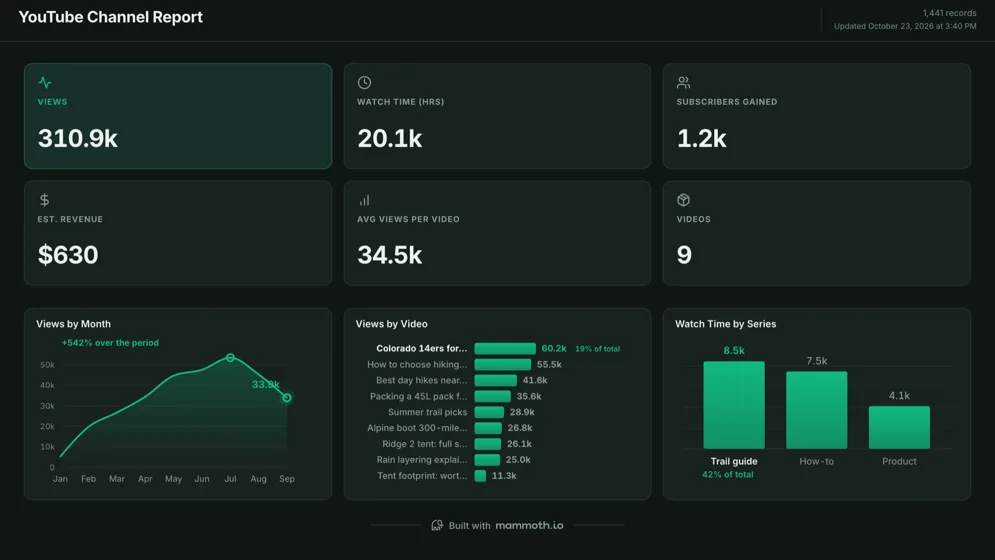
Which videos and series hold an audience?
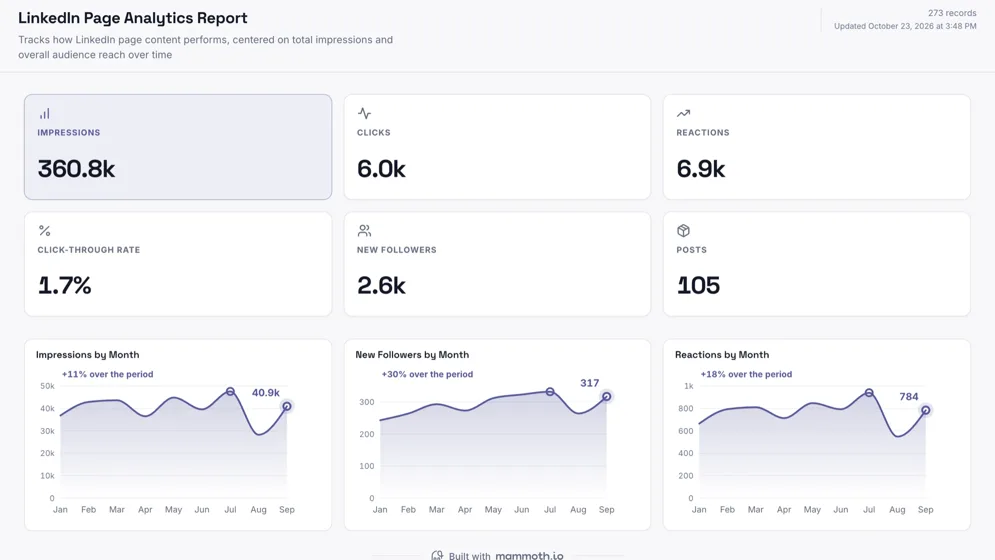
Is the company page growing, and do people click through?
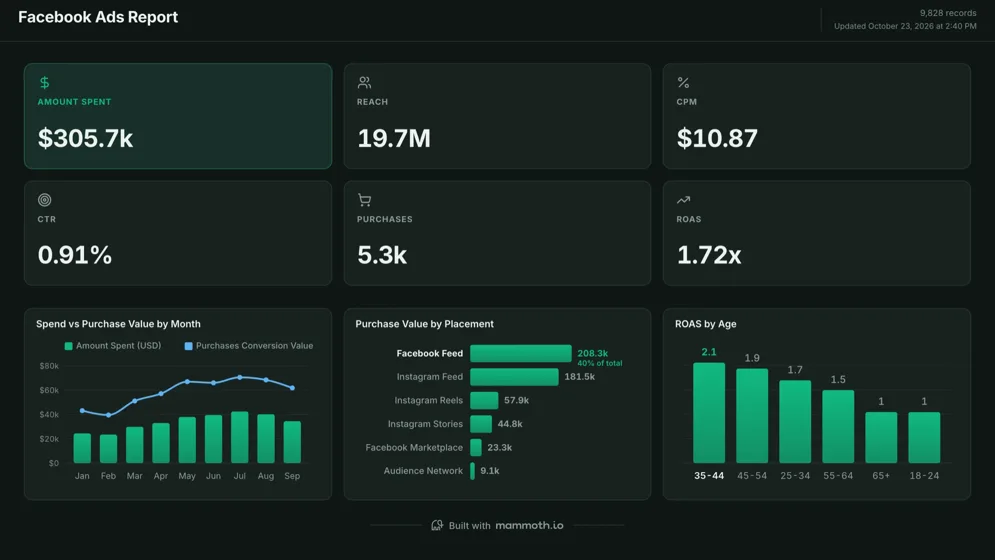
What does paid social cost, and which placements pay it back?
Definition
A social media dashboard is one screen that shows how a brand's accounts are doing across networks: impressions, reach, engagements, engagement rate, clicks and followers, by month, network and post type. Each network reports in its own app with its own definitions, so a dashboard that puts them side by side has to compare rates rather than raw counts.
Rates per network, so the biggest account does not win by size.
Reels, carousels and images on one chart.
Attention earned next to attention bought.
The metrics
Eight numbers. Each network defines them a little differently, so the definition matters more here than on most dashboards.
How many different people saw the posts?
Reach per post from each network. Reach does not add across posts, because the same person can see several, so report it per post or per period from the network itself.
How many times were the posts shown?
Impressions per post and date. Some networks count views or plays instead, so name the measure on the chart.
What share of the people shown a post reacted to it?
Engagements over impressions or reach, chosen once. Mixing the two between networks makes one look twice as good as it is.
Did anyone leave the network for our site?
Link clicks per post, with the post's type. Clicks are rare on some formats by design, so compare them within a format.
What share of impressions became a click?
Clicks over impressions for the same posts. A high reaction count with a low click-through builds the account, not traffic.
Is the audience growing?
New followers by date, net of unfollows where the network reports them. A gain from one viral post looks like growth for a month.
Which posts are people keeping?
Saves per post from the network's export. A save signals intent to come back, which is a stronger signal than a like.
What does paid social bring back?
Spend and purchase value from the ads account for the same dates. The network credits itself with every purchase it touched, so compare with your store's own figures.
How to build one
From one of the examples above to a live dashboard on your own data.
Start from any of the five boards above.
Upload a spreadsheet, or connect one of 100+ tested connectors.
Fix and combine your data once. Mammoth repeats those steps for you.
The dashboard updates on a schedule and flags data that fails a check.
Public, password-protected or sign-in only, on every plan.
14-day Pro trial · No credit card
FAQ
Last reviewed against the template catalogue.
Start from one of these templates or your own spreadsheet. Share it with as many people as you like, free.
More dashboard examples


