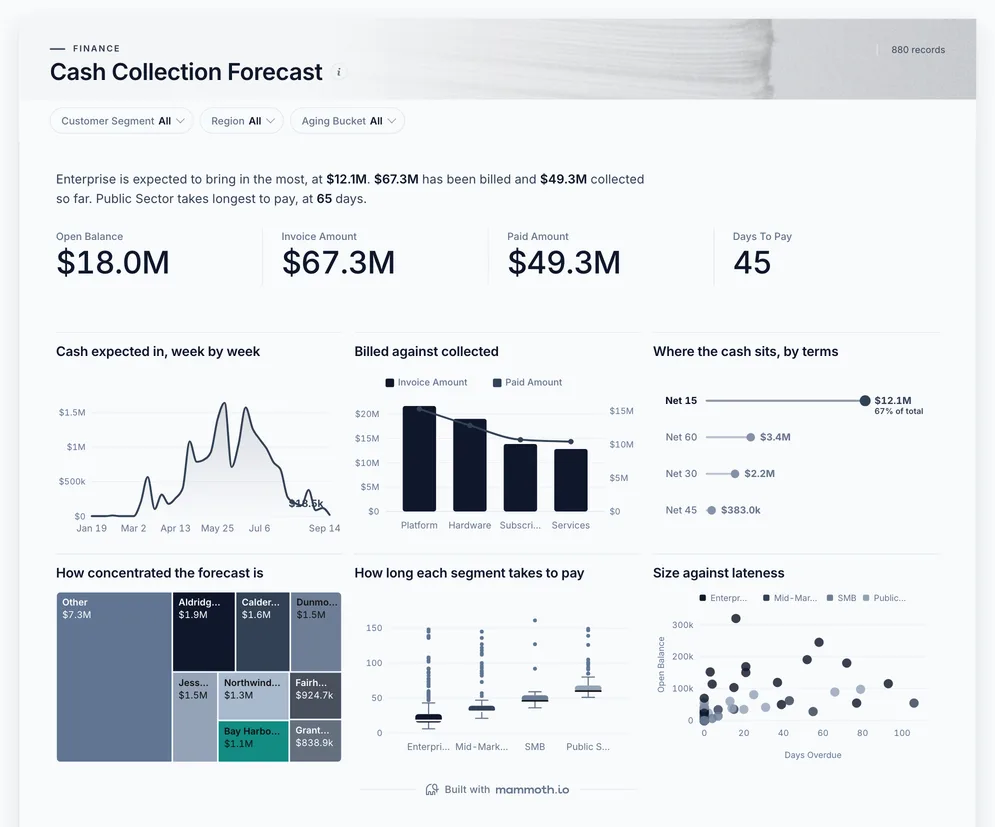
Cash flow forecast dashboard
How much cash will come in over the next few weeks?
- Open balance
- Invoice amount
- Paid amount
- Days to pay
Cash flow dashboards
Five dashboards on cash: what will come in over the next few weeks, who owes money and how overdue it is, profit beside cash, spending against budget, and where the money goes out. Open any of them to see it in full, then use it as a template for your own data.
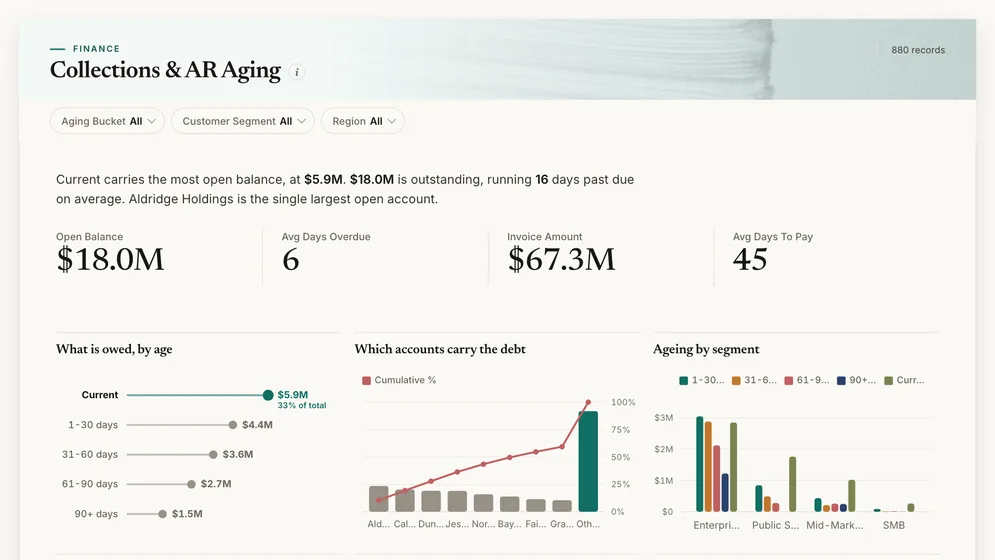
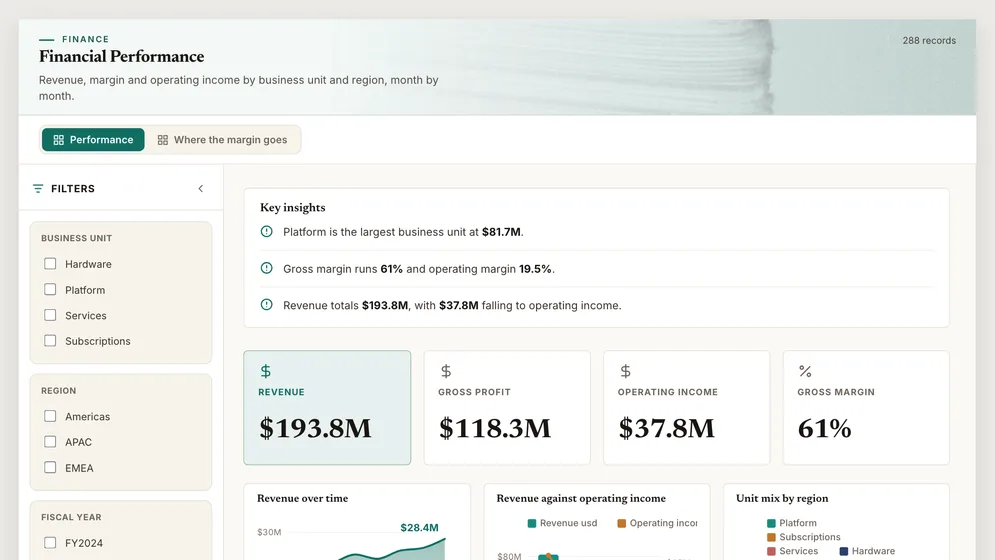
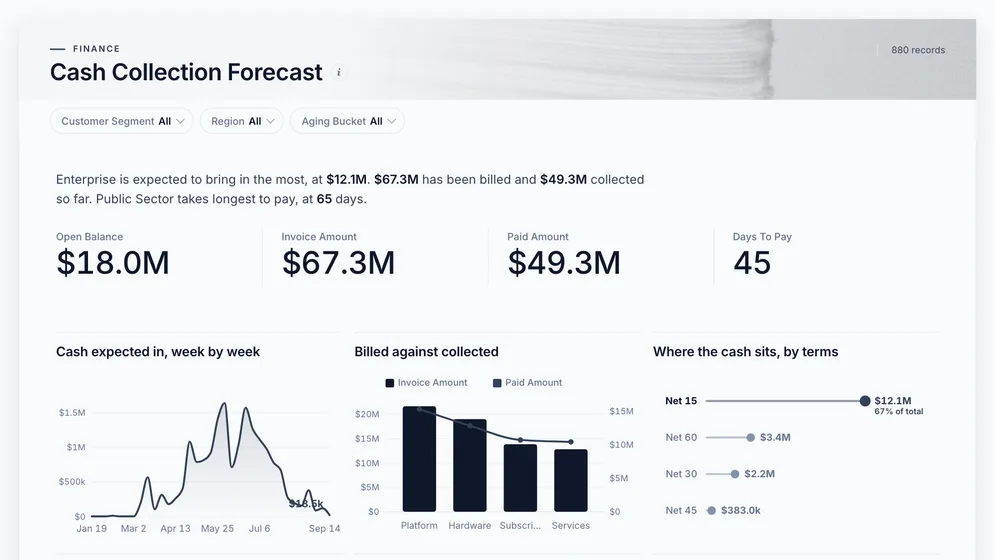
Three of the five examples. All figures are sample data.
The examples
Click a board to see all of it. Click Use template to start your own copy in Mammoth. All figures are sample data.
How much cash will come in over the next few weeks?
Who owes us money, and how overdue is it?
Is the business making money, and where is margin coming from?
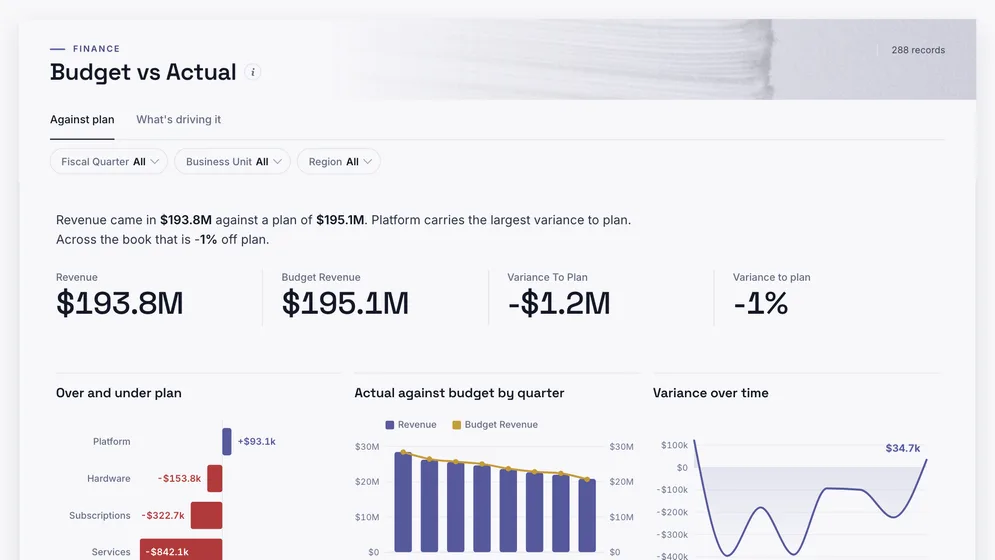
Where is spending running ahead of plan?
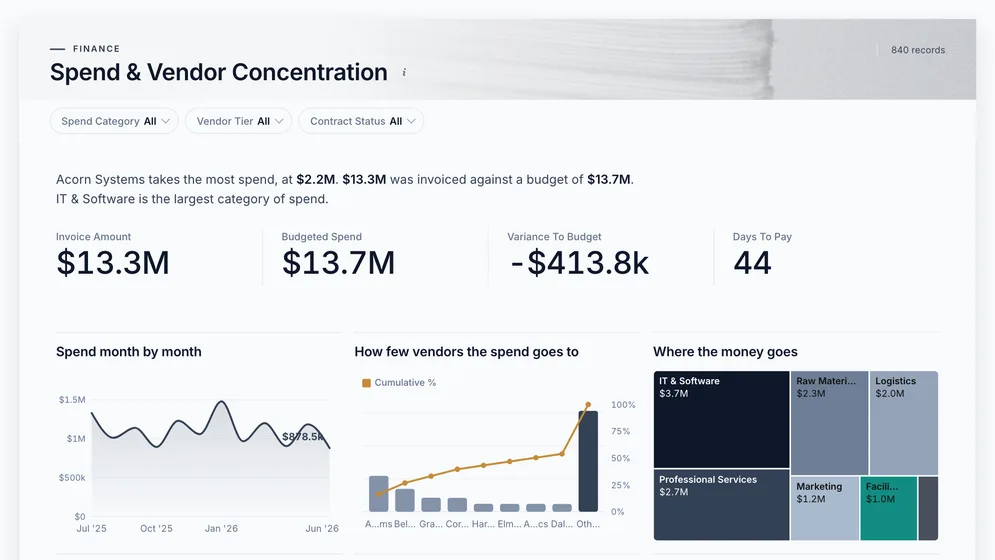
Where is the cash going out, and to whom?
Definition
A cash flow dashboard is one screen that shows money coming into and going out of a business: what customers owe and when they are likely to pay, what is being spent and with whom, and how both compare with plan. An accounts receivable dashboard is the incoming half of it: open balance by age, days overdue and the customers carrying the most.
Collections on one side, spend on the other.
When customers really pay, not the due date.
Aging buckets lead, so the call list writes itself.
The metrics
Eight numbers. Most depend on which date you count from, so agree that before the chart.
How much will customers pay over the next few weeks?
Open invoices with due dates, adjusted by how late each customer or segment usually pays. Due dates alone overstate the next few weeks.
How long does it take to turn a sale into cash?
Receivables and revenue for the same period. Compare like with like, because a month with a large invoice on its last day reads high.
How much is past its due date?
Open balance by aging bucket. Read the oldest buckets first, because they are the least likely to be paid.
What share of what we billed have we collected?
Billed and collected amounts for the same invoices. Matching payments to invoices matters: a payment on account is not a paid invoice.
How long does each customer or segment take?
Invoice date and paid date per invoice. Show the spread, because one slow customer can hide in a good average.
Is cash going out faster than planned?
Actual spend and budget by month and category. Timing differences look like overspend, so read it over a quarter as well as a month.
How far off the plan are we, and where?
Budget and actual at the same level of detail. A budget set by quarter cannot be compared with actuals by month without splitting it first.
How much spend goes to a few suppliers?
Spend per supplier over twelve months, with suppliers de-duplicated. The same supplier under three names hides how dependent you are.
How to build one
From one of the examples above to a live dashboard on your own data.
Start from any of the five boards above.
Upload a spreadsheet, or connect one of 100+ tested connectors.
Fix and combine your data once. Mammoth repeats those steps for you.
The dashboard updates on a schedule and flags data that fails a check.
Public, password-protected or sign-in only, on every plan.
14-day Pro trial · No credit card
FAQ
Last reviewed against the template catalogue.
Start from one of these templates or your own spreadsheet. Share it with as many people as you like, free.
More dashboard examples


