Skip to content

SEO dashboards

SEO dashboard examples

Five dashboards for search: rankings and clicks by page and intent, a Search Console report, conversions from organic search, content and backlinks, and what visitors do once they land. Open any of them to see it in full, then use it as a template for your own data.
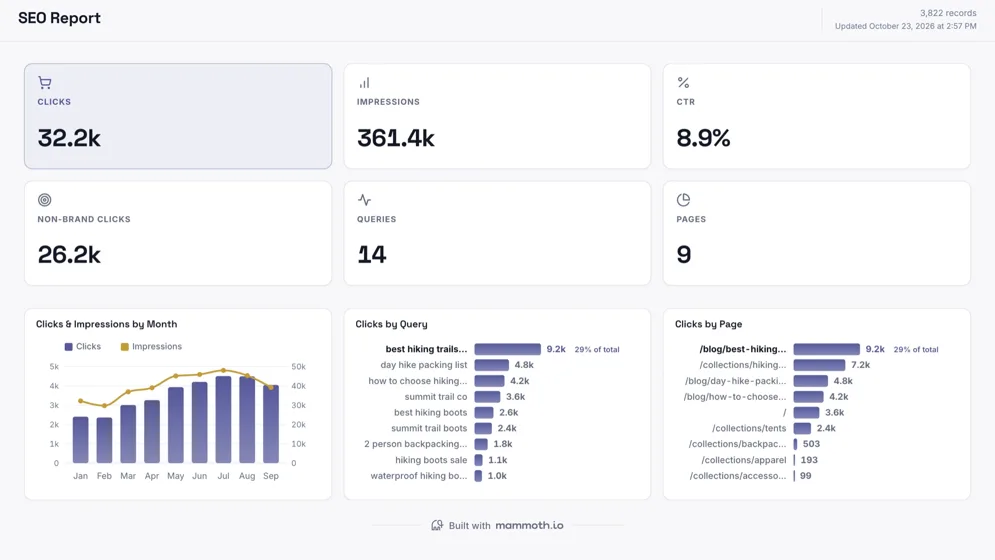
SEO report on sample data: clicks, impressions, CTR and non-brand clicks by month, with clicks by query and by page.
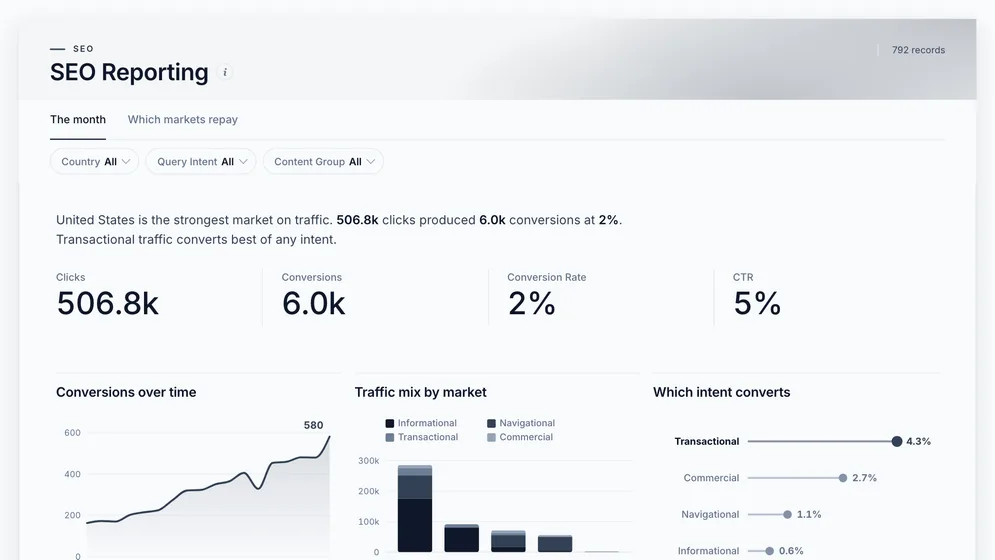
SEO Reporting dashboard: Clicks, Conversions, Conversion Rate and CTR tiles, above Conversions over time.
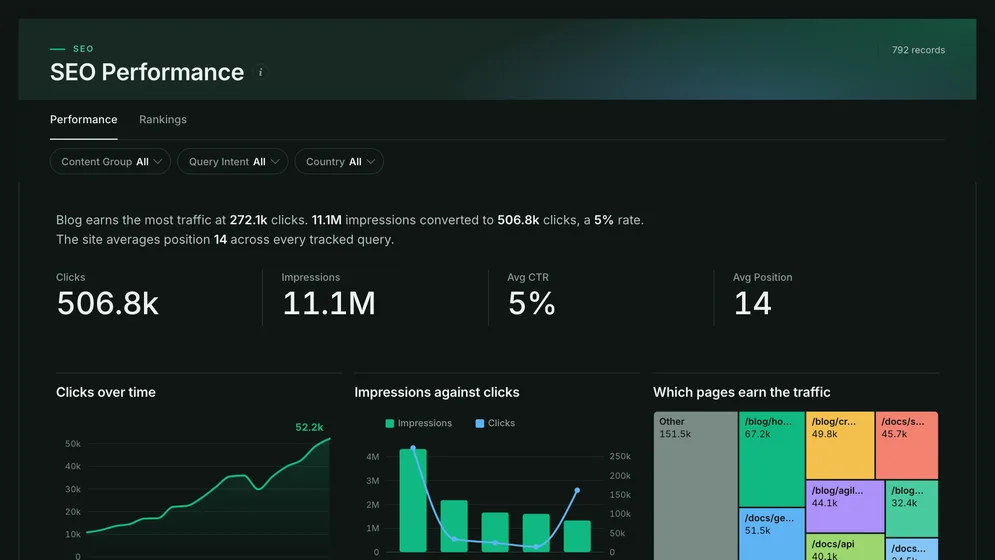
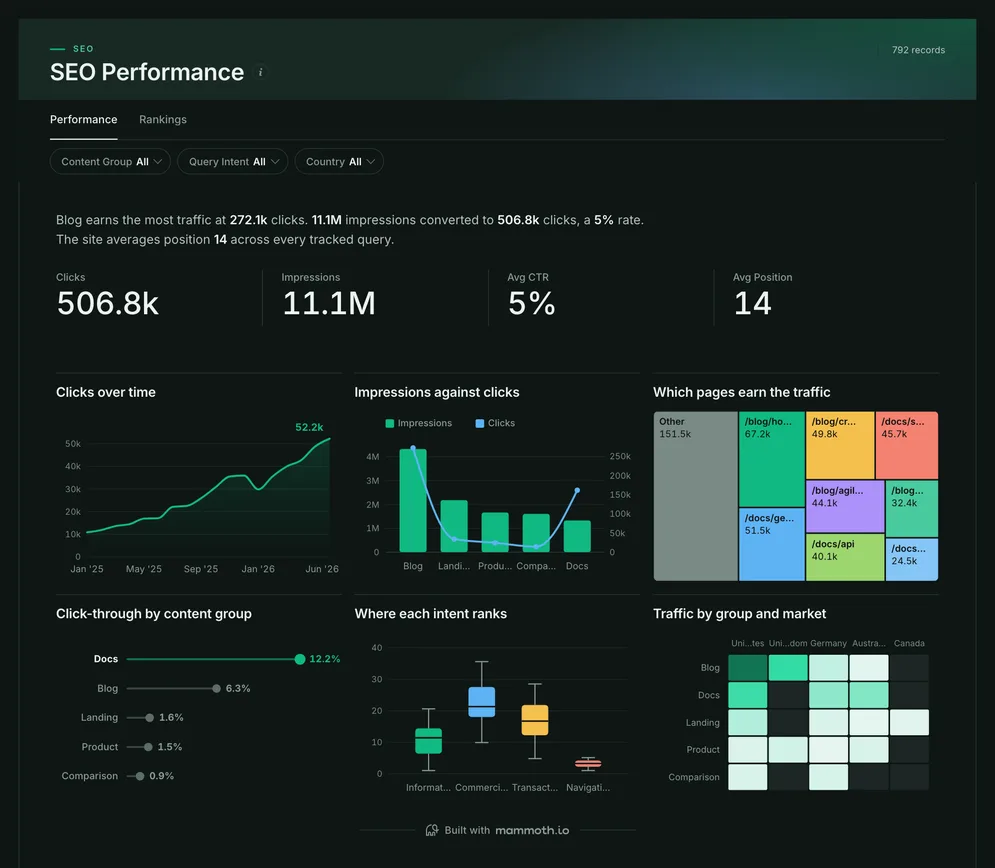
SEO Performance dashboard: Clicks, Impressions, CTR and Avg Position tiles, above Clicks over time.

Three of the five examples. All figures are sample data.

The examples

Five SEO dashboard examples and templates

Click a board to see all of it. Click Use template to start your own copy in Mammoth. All figures are sample data.

  1. SEO Performance dashboard: Clicks, Impressions, CTR and Avg Position tiles, above Clicks over time.
    Sample data

    SEO performance dashboard

    Which pages and searches bring in the traffic, and which are climbing?

    • Clicks
    • Impressions
    • CTR
    • Avg position
    Use template
  2. SEO report on sample data: clicks, impressions, CTR and non-brand clicks by month, with clicks by query and by page.
    Sample data

    Search Console dashboard

    How much traffic does Google send, and which searches and pages bring it?

    • Clicks
    • Impressions
    • CTR
    • Non-brand clicks
    Use template
  3. SEO Reporting dashboard: Clicks, Conversions, Conversion Rate and CTR tiles, above Conversions over time.
    Sample data

    SEO reporting dashboard

    Is organic search turning into customers, and in which countries?
    • Clicks
    • Conversions
    • Conversion rate
    • CTR
    Use template
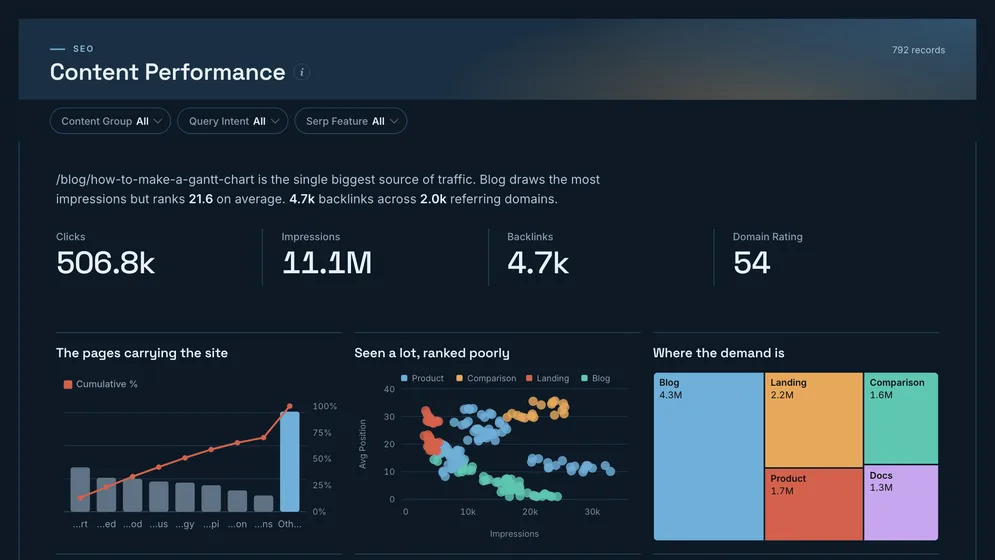
  4. Content Performance dashboard: Clicks, Impressions, Backlinks and Domain Rating tiles, above The pages carrying the site.
    Sample data

    Content SEO dashboard

    Which content earns its traffic, and which is seen but not clicked?
    • Clicks
    • Impressions
    • Backlinks
    • Domain rating
    Use template
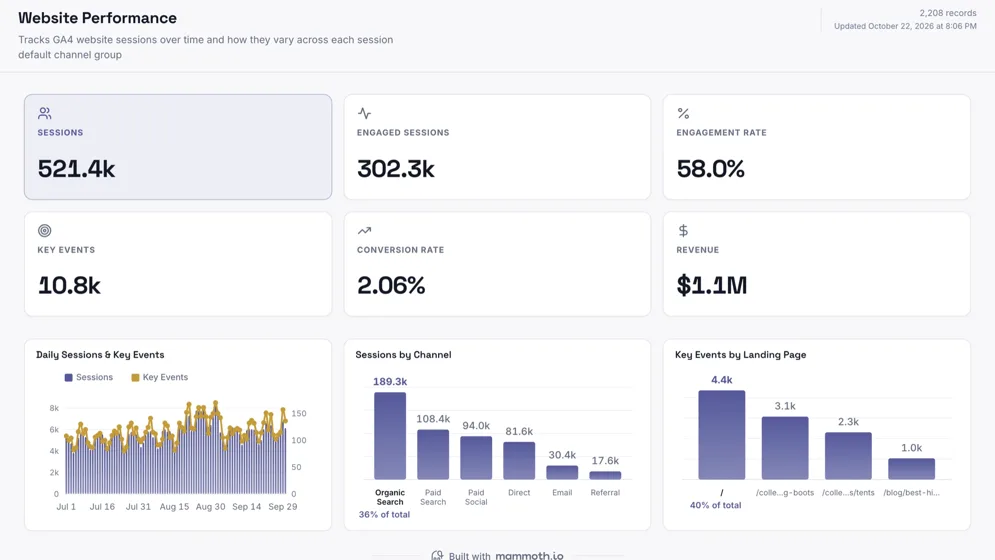
  5. GA4 traffic dashboard on sample data: sessions, engagement rate, key events and revenue, with sessions by channel and key events by landing page.
    Sample data

    Organic traffic dashboard

    What do visitors from search do once they land?

    • Sessions
    • Engaged sessions
    • Engagement rate
    • Key events
    Use template

Definition

What an SEO dashboard is

An SEO dashboard is one screen that shows how a site performs in search: clicks, impressions, click-through rate and average position, by page, query and market. The data usually comes from three places that do not talk to each other: Search Console for the search results, an analytics tool for what visitors do, and an SEO tool for links.

  • Clicks before rankings

    Position matters only when it turns into a visit.

  • Brand kept apart

    Non-brand clicks show what SEO itself won.

  • Past the click

    Search data joined to what visitors do next.

The metrics

The metrics an SEO dashboard is built from

Eight numbers. Most come from Search Console, and most go wrong the same way: an average across very different queries or pages hides what moved.

  • Organic clicks

    How many visits did search send?

    What the data needs

    Clicks by date and page from Search Console. Read them by page, not just in total, because one page gaining can hide ten slipping.

  • Impressions

    How often did the site appear in results?

    What the data needs

    Impressions by date, query and page. Impressions rising while clicks stay flat means the site is shown but ranked too low to be chosen.

  • Click-through rate

    What share of the people who saw a result clicked it?

    What the data needs

    Clicks over impressions for the same queries and pages. Compare it within a position band, because position 1 and position 8 are different games.

  • Average position

    Where does the site rank, on average?

    What the data needs

    Position weighted by impressions, split by query type. A single site-wide average mixes brand queries at position 1 with everything else.

  • Non-brand clicks

    How much traffic did SEO win, rather than the brand?

    What the data needs

    A list of brand terms, decided once, applied to every query. Without it, a good month for the company reads as a good month for search.

  • Organic conversions

    Does search traffic turn into leads or sales?

    What the data needs

    Conversions from the analytics tool, filtered to organic search and joined by landing page. Clicks alone reward pages that attract the wrong visitors.

  • Referring domains

    How many separate sites link to us?

    What the data needs

    An SEO tool's backlink export. Count domains, not links, because one site linking a thousand times is still one vote.

  • Pages seen but not clicked

    Which pages are close to earning traffic?

    What the data needs

    Pages with high impressions and low click-through from Search Console. These are the cheapest wins: the demand is there, the title or position is not.

How to build one

How to build your own SEO dashboard

From one of the examples above to a live dashboard on your own data.

  1. 1

    Pick a template

    Start from any of the five boards above.

  2. 2

    Add your data

    Upload a spreadsheet, or connect one of 100+ tested connectors.

  3. 3

    Clean it once

    Fix and combine your data once. Mammoth repeats those steps for you.

  4. 4

    Set it to refresh

    The dashboard updates on a schedule and flags data that fails a check.

  5. 5

    Share the link

    Public, password-protected or sign-in only, on every plan.

Start with a template

14-day Pro trial · No credit card

FAQ

SEO dashboard questions

Last reviewed against the template catalogue.

What should an SEO dashboard include?
Clicks, impressions, click-through rate and average position at the top, then the pages and queries behind them, non-brand clicks on their own, and the conversions organic visits lead to. The five above cover one question each, so start with the one your next report has to answer.
What KPIs should an SEO dashboard track?
Organic clicks, impressions, click-through rate, average position, non-brand clicks, organic conversions, referring domains and pages with impressions but few clicks. The list below shows each one with the data it needs.
How do I build an SEO dashboard?
Start with the question your team or client asks every month. Then follow five steps.
  1. Export the Search Console performance report by date, query and page, and connect GA4 or upload its export.
  2. Decide once which queries count as brand, so non-brand clicks mean the same thing every month.
  3. Group pages into content groups, because a hundred pages are unreadable and five groups are not.
  4. Check a month of clicks against Search Console's own total before anyone relies on the board.
  5. Upload the next export each month, or set GA4 to refresh, and share the link instead of a slide.
Can Mammoth connect to Google Search Console?
Not directly. The SEO boards read the Search Console performance export, which any site owner can download, and the next month's export updates the same dashboard. GA4 connects, and link counts come from an SEO tool's export. SEO report template
What is the difference between an SEO dashboard and an SEO report?
Timing. A dashboard is the screen a team checks whenever it wants to know where search stands. A report is the summary sent at the end of a month, with conversions as the headline. The SEO Reporting board above is laid out as that monthly report, so one dataset serves both.
Can an agency share a dashboard with each client?
Yes. Dashboard viewers are unlimited and free on every Mammoth plan, including the free one, so each client can open their own board without a licence. Only the people building the dashboards count as platform users.
How often should it refresh?
Monthly is enough for most SEO reporting, because rankings move slowly and Search Console data arrives with a delay of a few days. Traffic from GA4 can refresh more often. How often you can refresh depends on your plan. See plans and refresh rates

Build the SEO dashboard you actually need.

Start from one of these templates or your own spreadsheet. Share it with as many people as you like, free.

  • ✓ 14-day Pro trial
  • ✓ No credit card
  • ✓ Viewers always free