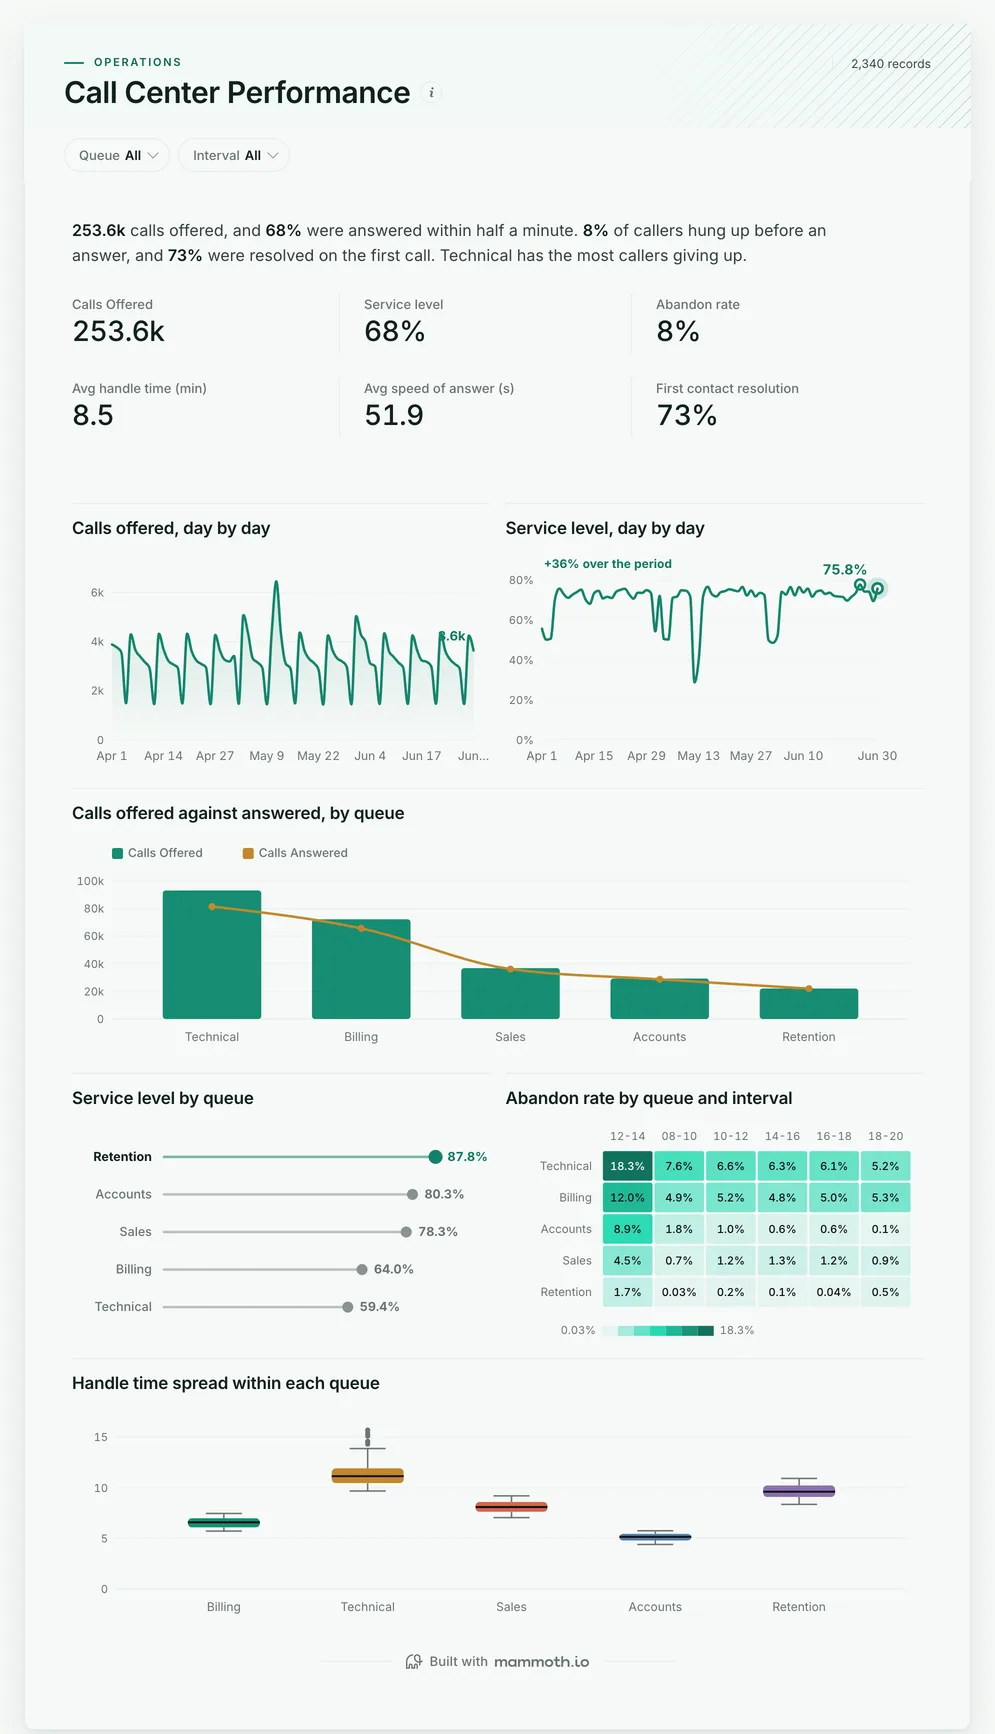
Call center dashboard
Are calls answered fast enough, and where does demand outrun the staff?
- Calls offered
- Service level
- Abandon rate
- Avg handle time (min)
Call center dashboards
Four dashboards for a contact center: calls answered and abandoned by queue and time of day, the written ticket queue beside it, why agents leave, and absence and performance by team. Open any of them to see it in full, then use it as a template for your own data.
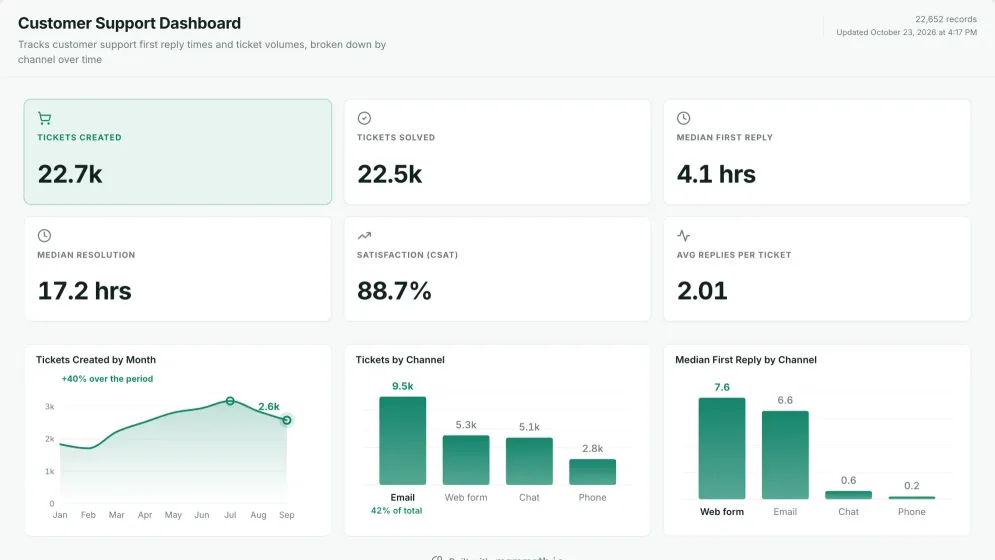
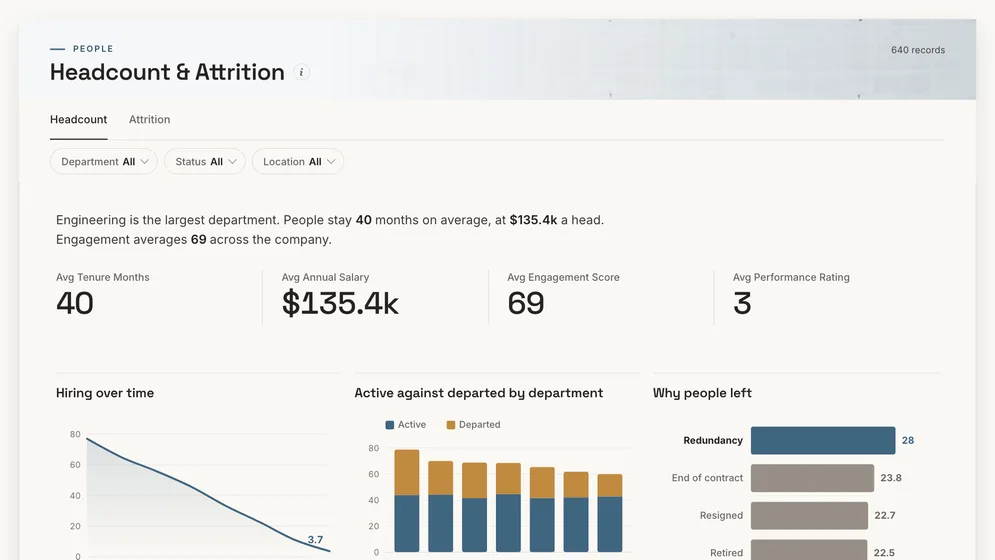
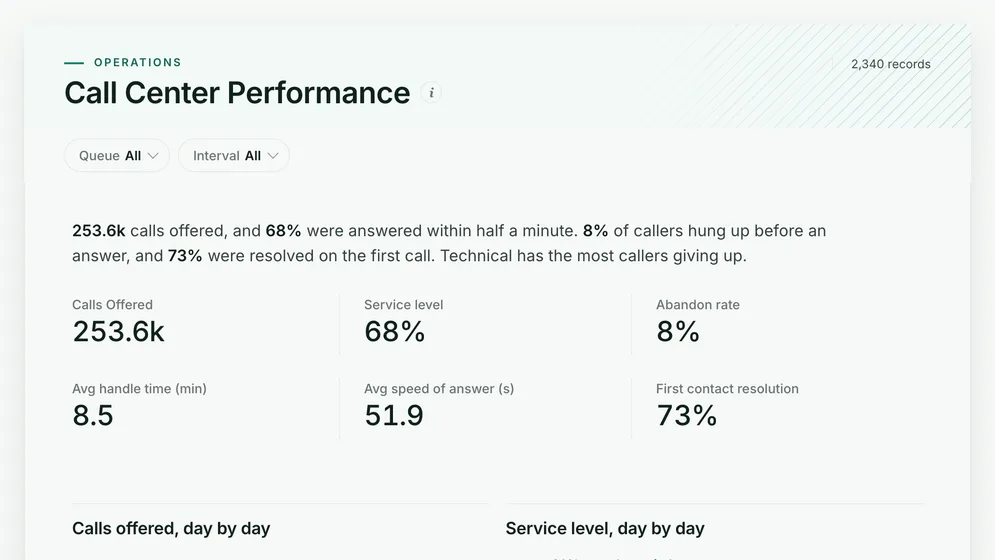
Three of the four examples. All figures are sample data.
The examples
Click a board to see all of it. Click Use template to start your own copy in Mammoth. All figures are sample data.
Are calls answered fast enough, and where does demand outrun the staff?
Are customers hearing back fast enough, and is the queue keeping up?
How many agents are leaving, and why?
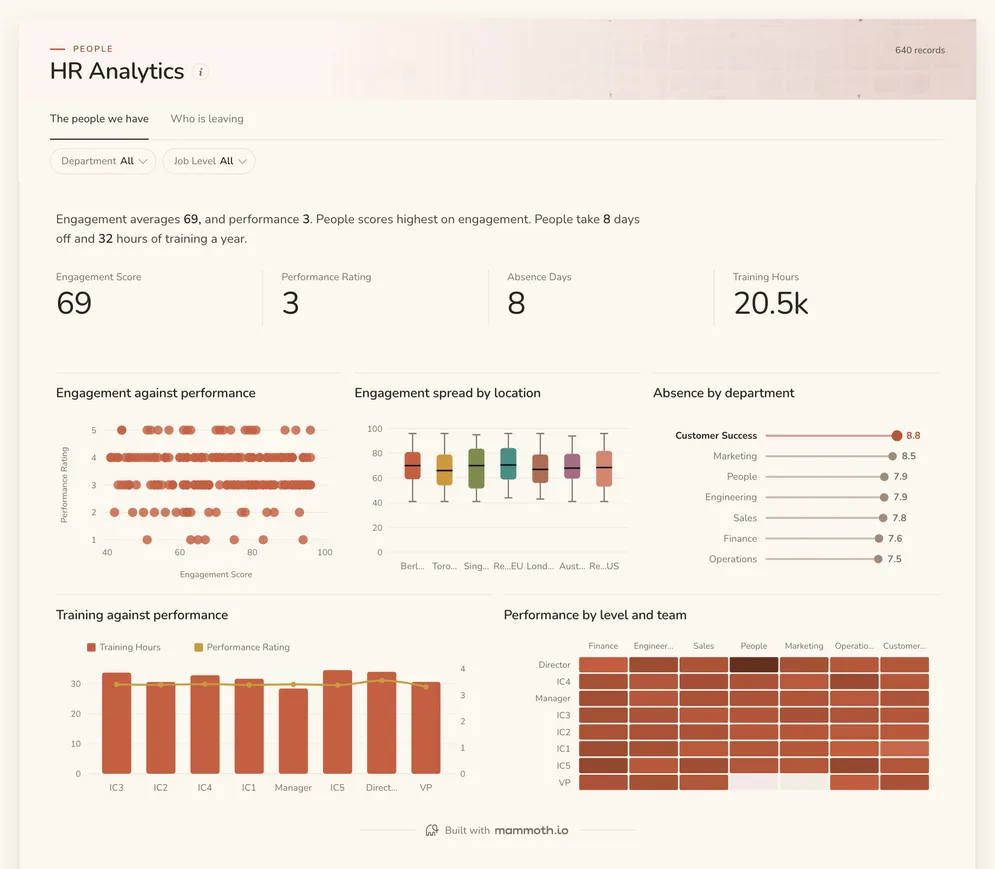
Which teams are missing shifts, and does it show in performance?
Definition
A call center dashboard is one screen that shows whether callers are being answered: how many calls came in, what share were answered within the target time, how many callers hung up, how long calls took, and how many were resolved first time. The data usually comes from the phone system or contact center platform, with staffing and HR records beside it.
Service level and abandon rate on one definition.
The interval where callers give up, not just the day.
Attrition and absence are lost capacity on the phones.
The metrics
Eight numbers. Several depend on a threshold agreed first, such as the answer-time target or when an abandoned call counts.
What share of calls are answered within the target time?
Answer times per call and an agreed target, such as 80% in 30 seconds. Read it by interval, because a good daily figure can hide a lunchtime when most callers waited.
What share of callers hang up before they are answered?
Calls offered and calls abandoned per queue and interval. Decide whether calls dropped in the first few seconds count, and keep that rule fixed.
How long does a caller wait for an agent?
Queue time per answered call. An average hides a tail of long waits, so show the spread or a percentile beside it.
How long does a call take from answer to wrap-up?
Talk, hold and after-call work per call. Leave out wrap-up time and the queue looks better staffed than it is.
What share of callers are sorted on the first call?
A resolution flag per call, or repeat calls from the same number within a set window. A short handle time bought with repeat calls is not a saving.
How many calls came in, and when?
Every call that reached a queue, by interval. It is the demand the schedule has to meet, so forecast from it rather than from calls answered.
What share of logged-in time are agents on calls?
Handle time and available time per agent and interval. Sustained occupancy near the top of the scale is where attrition starts.
How many agents leave, and how soon?
Start and leave dates with a leaving reason per agent. Attrition in the first ninety days is usually a hiring or training problem, not a pay one.
How to build one
From one of the examples above to a live dashboard on your own data.
Start from any of the four boards above.
Upload a spreadsheet, or connect one of 100+ tested connectors.
Fix and combine your data once. Mammoth repeats those steps for you.
The dashboard updates on a schedule and flags data that fails a check.
Public, password-protected or sign-in only, on every plan.
14-day Pro trial · No credit card
FAQ
Last reviewed against the template catalogue.
Start from one of these templates or your own spreadsheet. Share it with as many people as you like, free.
More dashboard examples


