Skip to content

Safety dashboards

Safety dashboard examples

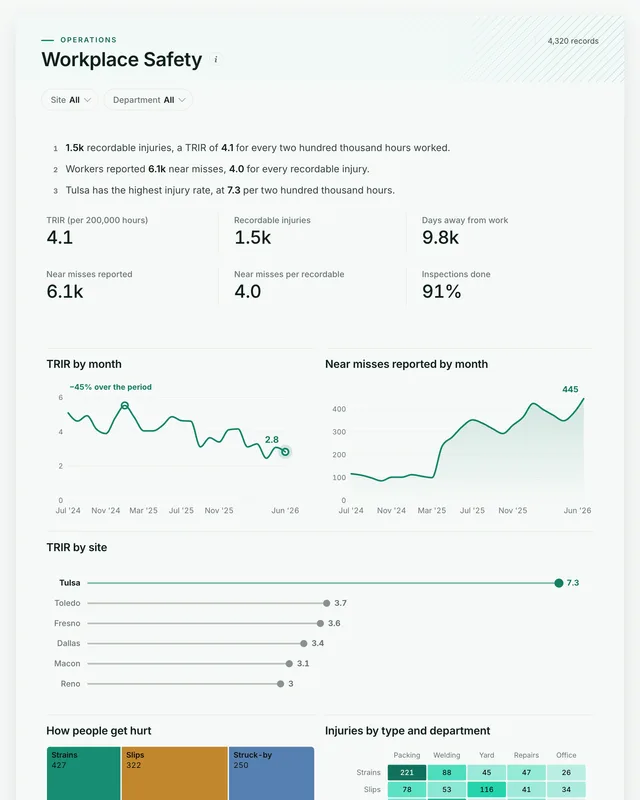
Three dashboards for health and safety: the injury rate by month and site with the near misses that come before injuries, the production pressure behind them, and the absence and training picture by team. Open any of them to see it in full, then use it as a template for your own data.
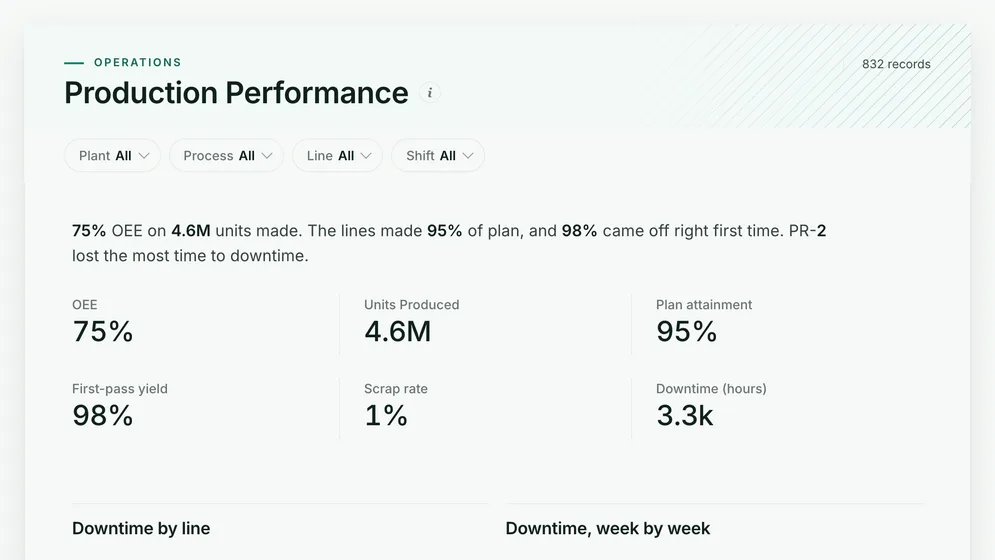
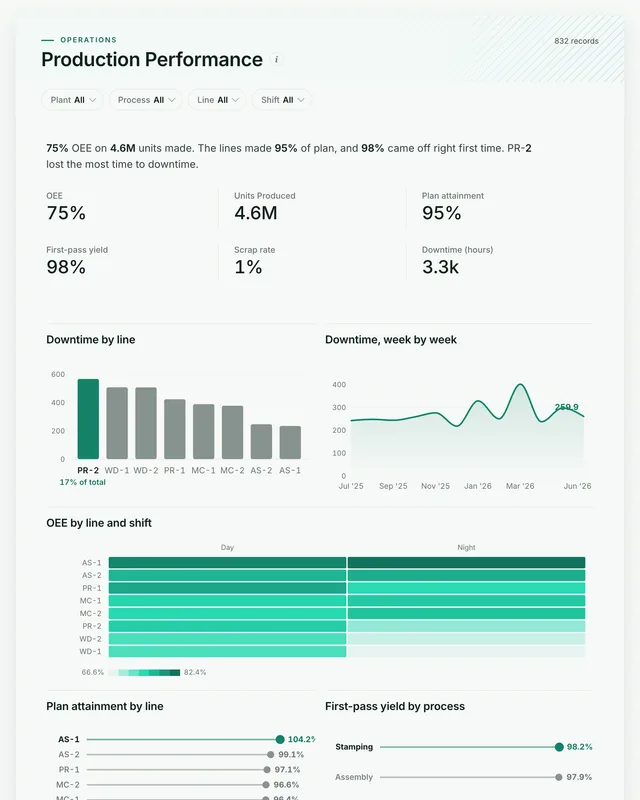
Production Performance dashboard: OEE, Units Produced, Plan attainment, First-pass yield and Scrap rate tiles.
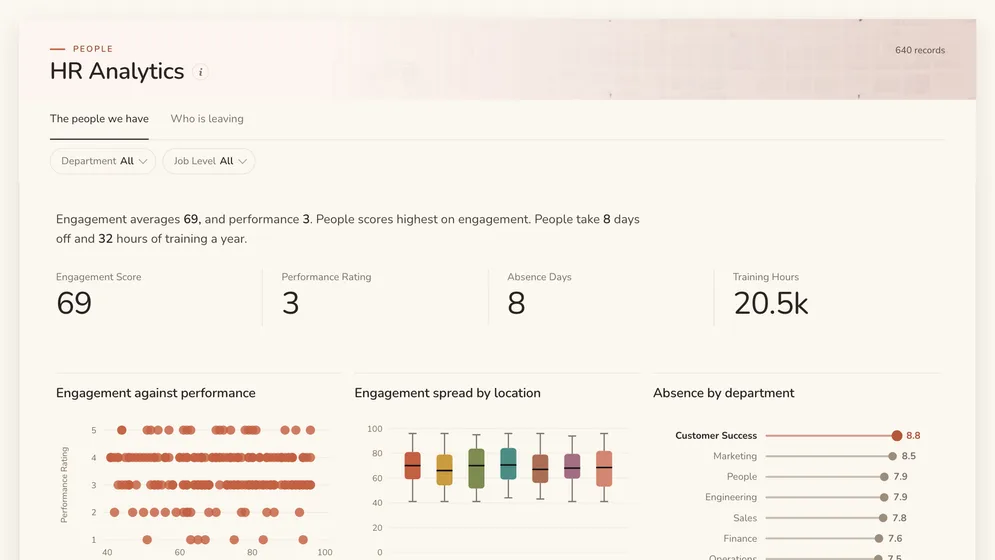
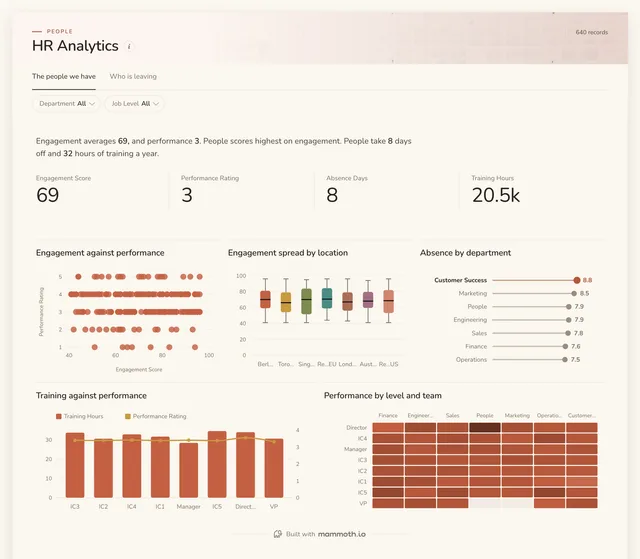
HR Analytics dashboard: Engagement Score, Performance Rating, Absence Days and Training Hours tiles.
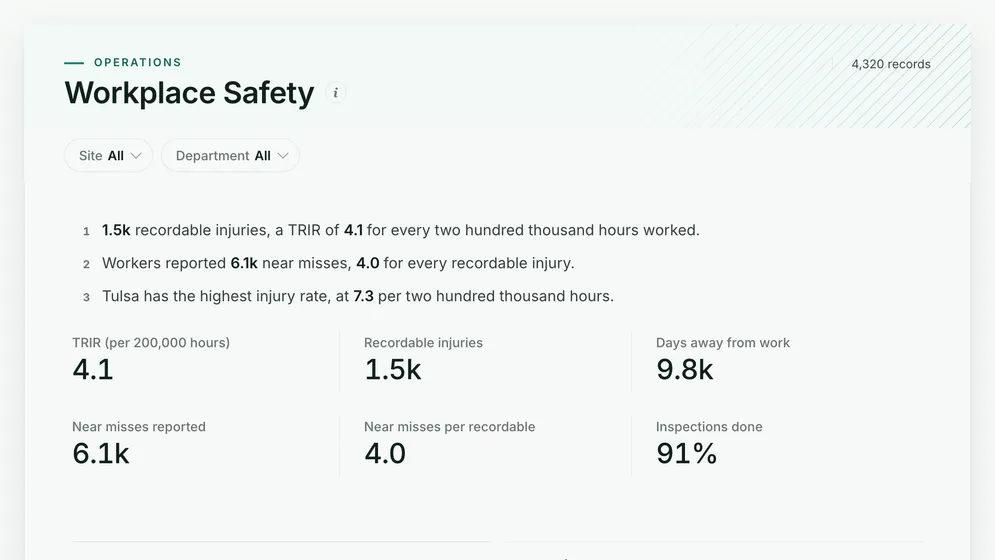
Workplace Safety dashboard: TRIR (per 200,000 hours), Recordable injuries and Days away from work tiles, above TRIR by month.

All figures are sample data.

The examples

Three safety dashboard examples and templates

Click a board to see all of it. Click Use template to start your own copy in Mammoth. All figures are sample data.

  1. Workplace Safety dashboard: TRIR (per 200,000 hours), Recordable injuries and Days away from work tiles, above TRIR by month.
    Sample data

    Safety dashboard

    Are we getting safer, and where do people get hurt?
    • TRIR (per 200,000 hours)
    • Recordable injuries
    • Days away from work
    • Near misses reported
    Use template
  2. Production Performance dashboard: OEE, Units Produced, Plan attainment, First-pass yield and Scrap rate tiles.
    Sample data

    Plant production and safety dashboard

    Is the pressure on the lines showing up as injuries?
    • OEE
    • Units produced
    • Plan attainment
    • First-pass yield
    Use template
  3. HR Analytics dashboard: Engagement Score, Performance Rating, Absence Days and Training Hours tiles.
    Sample data

    Safety training and absence dashboard

    Which teams lose the most days to absence?

    • Engagement score
    • Performance rating
    • Absence days
    • Training hours
    Use template

Definition

What a safety dashboard is

A safety dashboard is one screen that shows whether a workplace is getting safer: how many people were hurt and how often for the hours worked, how many days were lost, how many hazards were reported before anyone was hurt, and whether inspections happen as planned. The data usually comes from an incident log, the hours worked from payroll, and an inspection schedule.

  • Leading and lagging

    Near misses and inspections beside the injury rate.

  • Site by site

    One TRIR definition across every location.

  • The cause, not the count

    How people get hurt, by type and department.

The metrics

The metrics a safety dashboard is built from

Eight numbers. Most depend on a definition agreed first, such as what counts as recordable or as a near miss.

  • TRIR

    How often are people hurt for the hours worked?

    What the data needs

    Recordable injuries and hours worked for the same site and period, times 200,000. Using headcount instead of hours makes a site with overtime look safer than it is.

  • Recordable injuries

    How many injuries met the reporting threshold?

    What the data needs

    One row per incident with a recordable flag set by the same rule everywhere. Two sites applying the rule differently makes the comparison meaningless.

  • Days away from work

    How serious were the injuries?

    What the data needs

    Days lost per incident, summed. A month with few injuries but many days lost had one serious one.

  • Near misses reported

    Are hazards being reported before someone is hurt?

    What the data needs

    Near-miss reports by site and month. A rising count is usually good news: it means people trust the reporting.

  • Near misses per recordable

    How much warning does each injury give?

    What the data needs

    Near misses and recordables for the same site and period. A low ratio means injuries arrive without warning, which points at a reporting gap.

  • Inspections done

    Are planned inspections happening?

    What the data needs

    Inspections planned and completed by site and month. Show both, because 100% of a short plan is not the same as 90% of a full one.

  • Injuries by type

    How do people get hurt?

    What the data needs

    An incident type on every record, from a fixed list. Strains, slips and cuts each have a different fix.

  • Lost-time absence

    How many working days do injuries cost?

    What the data needs

    Absence days coded by reason, so injury absence can be read apart from sickness.

How to build one

How to build your own safety dashboard

From one of the examples above to a live dashboard on your own data.

  1. 1

    Pick a template

    Start from any of the three boards above.

  2. 2

    Add your data

    Upload a spreadsheet, or connect one of 100+ tested connectors.

  3. 3

    Clean it once

    Fix and combine your data once. Mammoth repeats those steps for you.

  4. 4

    Set it to refresh

    The dashboard updates on a schedule and flags data that fails a check.

  5. 5

    Share the link

    Public, password-protected or sign-in only, on every plan.

Start with a template

14-day Pro trial · No credit card

FAQ

Safety dashboard questions

Last reviewed against the template catalogue.

What should a safety dashboard show?
Whether people are getting hurt less often, and whether hazards are caught first. That means the injury rate against hours worked, days away from work, near misses reported, how injuries happen, and inspections done against planned. The boards above cover those.
What KPIs should a safety dashboard track?
TRIR, recordable injuries, days away from work, near misses reported, near misses per recordable and inspections done are the core. The list below shows each one with the data it needs.
How do I build a safety dashboard?
Start with the injury rate the leadership meeting already reports. Then follow five steps.
  1. Export the incident log with date, site, department, type and whether it was recordable.
  2. Add hours worked per site and month from payroll, so the rate is per hour and not per head.
  3. Log near misses and inspections in the same place, with the same site names.
  4. Check one quarter's recordables against the official injury log before anyone relies on the board.
  5. Refresh monthly, and give each site lead a view filtered to their site.
What is a good TRIR?
It depends on the industry: offices sit well under 1, construction and manufacturing run several times higher. The number that matters on the board is your own trend and the spread between sites, because one site well above the rest is a specific problem with a specific fix.
Where does safety data come from?
Usually an EHS or incident reporting system, payroll for hours worked, and an inspection or audit schedule, often in spreadsheets. Mammoth has 100+ tested connectors, and can also connect to anything with a REST API. You combine the sources once, and Mammoth repeats the same steps on every refresh.
Can every site lead see it without a licence?
Yes. Dashboard viewers are unlimited and free on every Mammoth plan, including the free one, so each site manager, supervisor and safety rep can open it at no per-viewer cost. Only the people building the dashboards count as platform users.

Build the safety dashboard you actually need.

Start from one of these templates or your own spreadsheet. Share it with as many people as you like, free.

  • ✓ 14-day Pro trial
  • ✓ No credit card
  • ✓ Viewers always free