Skip to content

Customer experience dashboards

Customer experience dashboard examples

Four dashboards for customer experience: NPS and what detractors talk about by channel, how fast support replies, whether callers get through, and whether orders arrive on time. Open any of them to see it in full, then use it as a template for your own data.
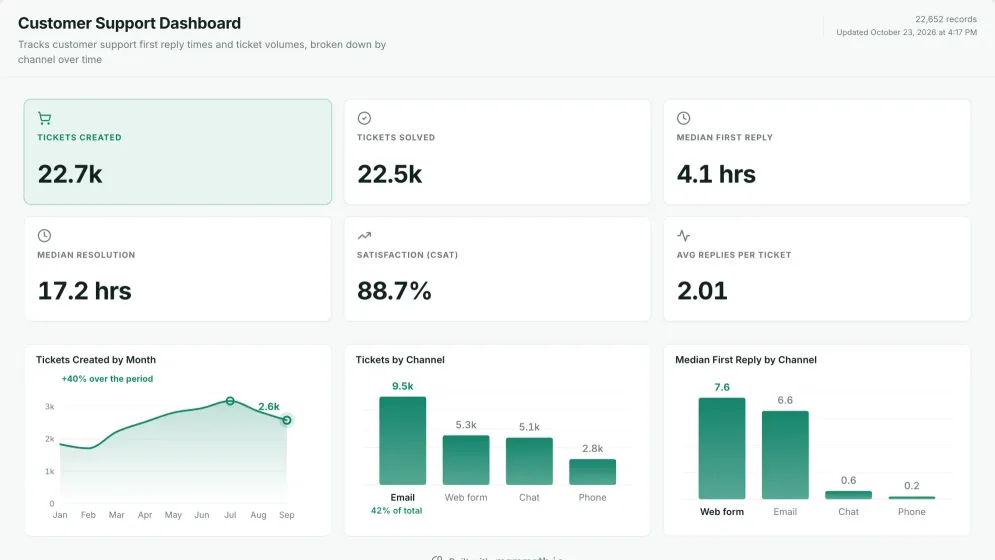
Customer Support dashboard on sample data: tickets, reply and resolution times, and CSAT, by month and channel.
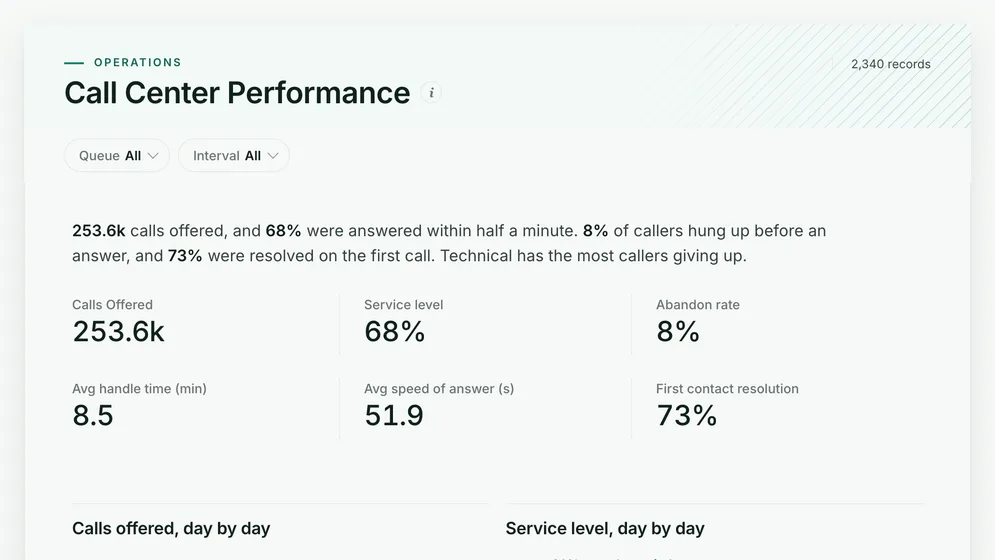
Call Center Performance dashboard: Calls Offered, Service level, Abandon rate and Avg handle time (min) tiles.
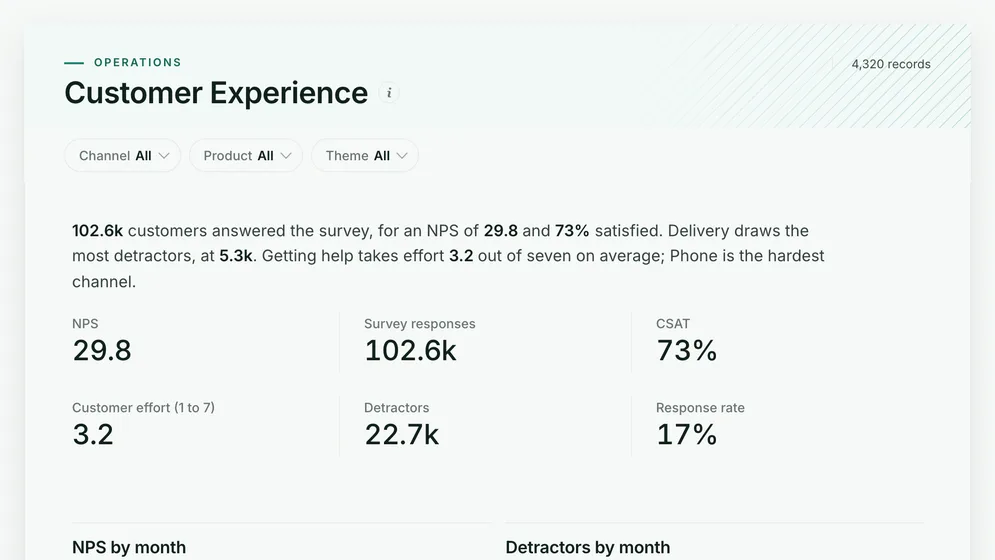
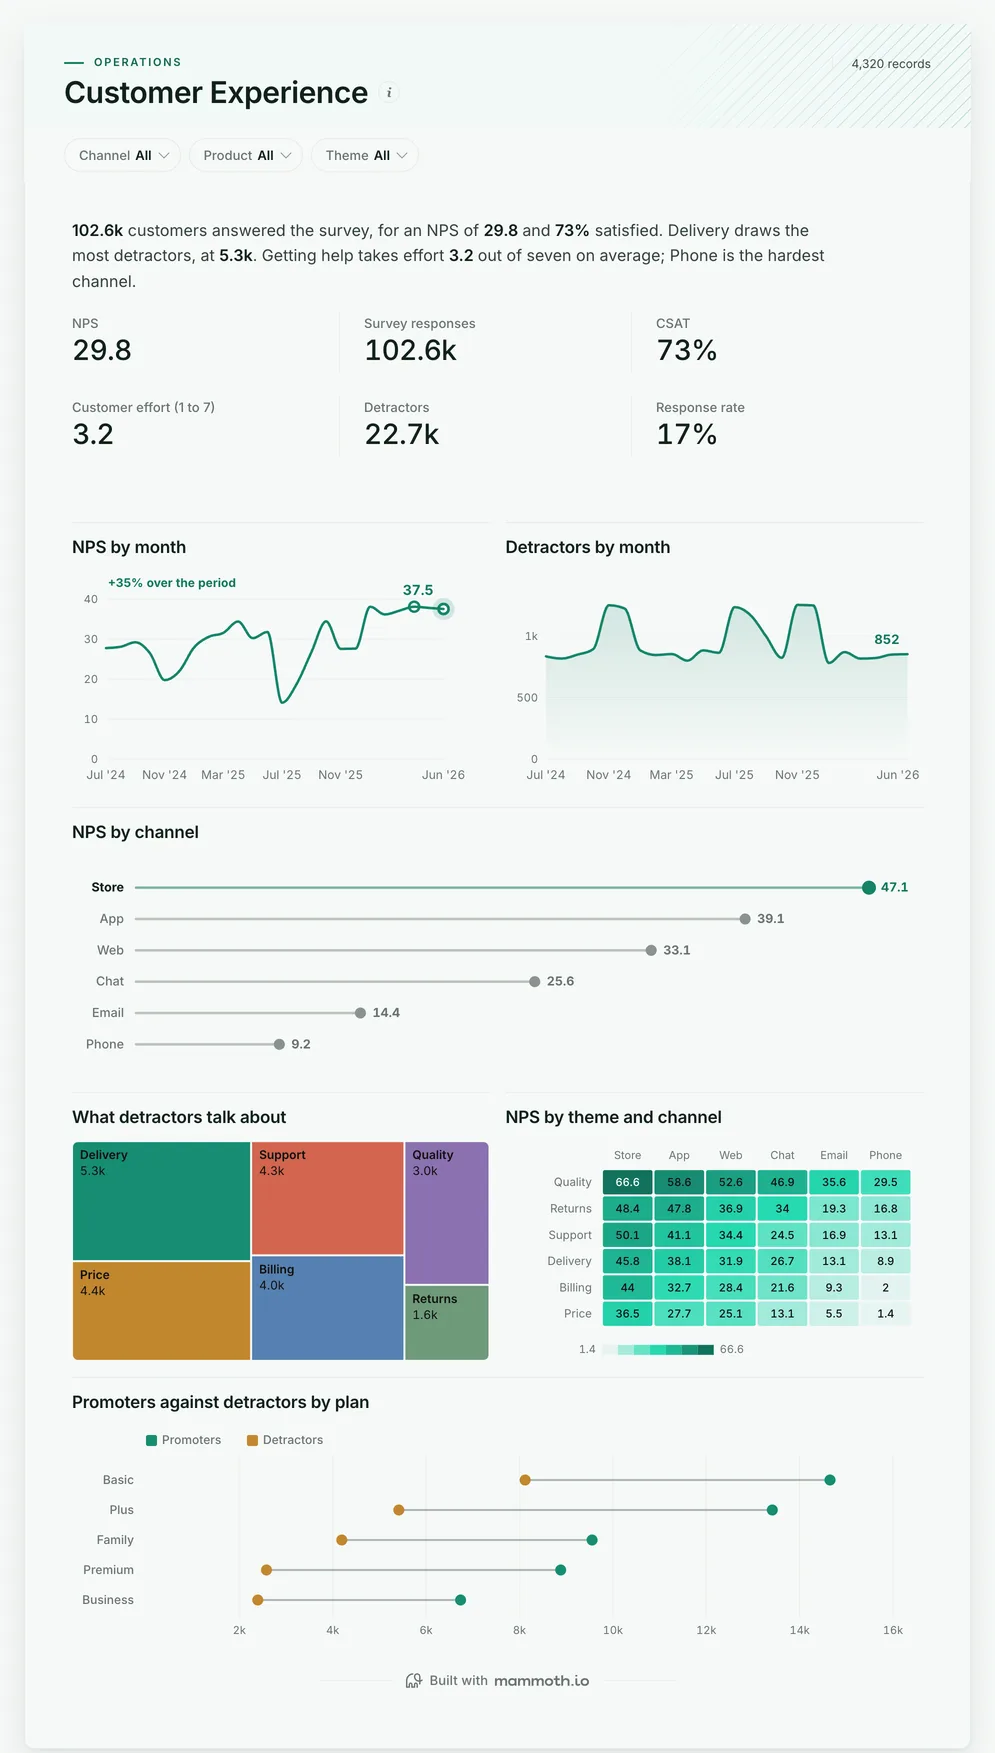
Customer Experience dashboard: NPS, Survey responses, CSAT, Customer effort (1 to 7), Detractors and Response rate tiles.

Three of the four examples. All figures are sample data.

The examples

Four customer experience dashboard examples and templates

Click a board to see all of it. Click Use template to start your own copy in Mammoth. All figures are sample data.

  1. Customer Experience dashboard: NPS, Survey responses, CSAT, Customer effort (1 to 7), Detractors and Response rate tiles.
    Sample data

    Customer experience dashboard

    Would customers recommend us, and which channel lets them down?

    • NPS
    • Survey responses
    • CSAT
    • Customer effort (1 to 7)
    Use template
  2. Customer Support dashboard on sample data: tickets, reply and resolution times, and CSAT, by month and channel.
    Sample data

    Customer service dashboard

    Are customers hearing back fast enough, and is the queue keeping up?
    • Tickets created
    • Tickets solved
    • Median first reply
    • Median resolution
    Use template
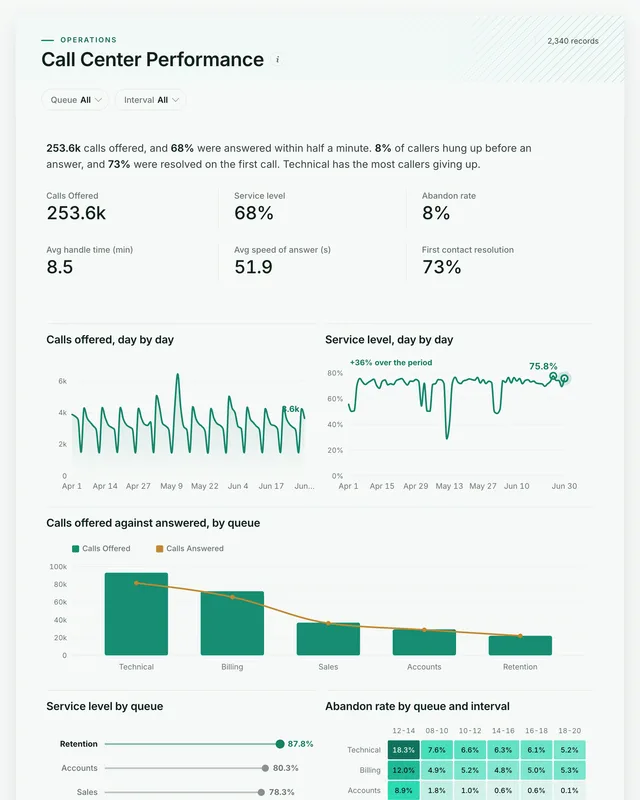
  3. Call Center Performance dashboard: Calls Offered, Service level, Abandon rate and Avg handle time (min) tiles.
    Sample data

    Contact center experience dashboard

    Are callers getting through, or giving up?
    • Calls offered
    • Service level
    • Abandon rate
    • Avg handle time (min)
    Use template
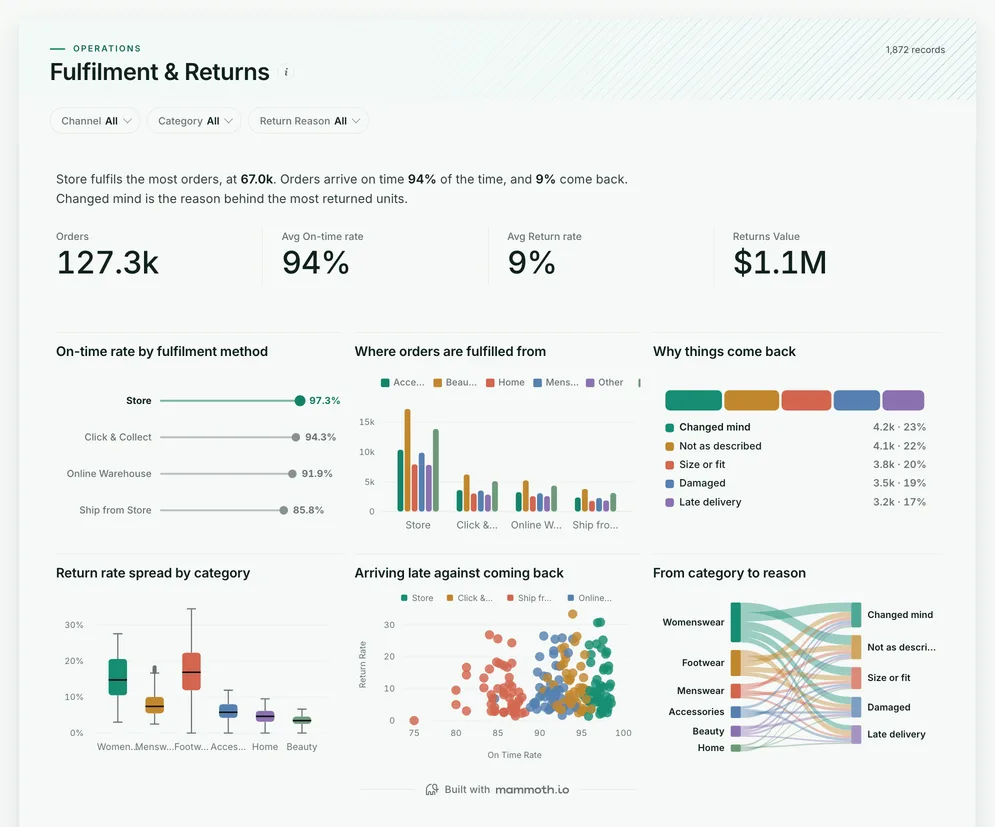
  4. Fulfilment & Returns dashboard: Orders, On-time rate, Return rate and Returns Value tiles.
    Sample data

    Delivery and returns experience dashboard

    Are orders arriving late, and is that why they come back?

    • Orders
    • On-time rate
    • Return rate
    • Returns value
    Use template

Definition

What a customer experience dashboard is

A customer experience dashboard is one screen that shows how customers feel about a business and why: net promoter score, satisfaction and effort scores, what unhappy customers complain about, and the operational numbers behind them, such as reply times, hold times and late deliveries. The data usually comes from a survey tool, the help desk, the phone system and order records.

  • Score and reason together

    NPS beside the themes detractors raise.

  • Every channel

    Store, app, chat, phone and email on one definition.

  • The causes, too

    Support queues, hold times and late parcels.

The metrics

The metrics a customer experience dashboard is built from

Eight numbers. Most depend on a definition agreed first, such as which survey counts or when a reply is a first reply.

  • Net promoter score

    Would customers recommend us?

    What the data needs

    Scores from 0 to 10 per response, with date and channel. Promoters (9 to 10) minus detractors (0 to 6), as a share of responses.

  • CSAT

    Were customers satisfied with the interaction?

    What the data needs

    Satisfaction ratings per response. Report the share satisfied, not the average score, which hides how many were unhappy.

  • Customer effort score

    How hard was it to get something done?

    What the data needs

    Effort ratings per response on one scale. Read it by channel, because effort is usually a process problem in one place.

  • Detractor themes

    What do unhappy customers complain about?

    What the data needs

    A theme on each detractor comment from a fixed list. A list of twenty themes is too long to act on; six to eight works.

  • Response rate

    How many customers answered the survey?

    What the data needs

    Surveys sent and responses received by channel. A low rate in one channel means its score rests on a few people.

  • First reply time

    How long do customers wait to hear back?

    What the data needs

    Ticket created and first agent reply times. Use the median, because a few tickets that wait for days distort an average.

  • Abandon rate

    How many callers give up?

    What the data needs

    Calls offered and calls abandoned by queue and interval, from the phone system.

  • On-time delivery

    Do orders arrive when promised?

    What the data needs

    Promised and actual delivery dates per order. Late deliveries are often where detractors start.

How to build one

How to build your own customer experience dashboard

From one of the examples above to a live dashboard on your own data.

  1. 1

    Pick a template

    Start from any of the four boards above.

  2. 2

    Add your data

    Upload a spreadsheet, or connect one of 100+ tested connectors.

  3. 3

    Clean it once

    Fix and combine your data once. Mammoth repeats those steps for you.

  4. 4

    Set it to refresh

    The dashboard updates on a schedule and flags data that fails a check.

  5. 5

    Share the link

    Public, password-protected or sign-in only, on every plan.

Start with a template

14-day Pro trial · No credit card

FAQ

Customer experience dashboard questions

Last reviewed against the template catalogue.

What should a customer experience dashboard show?
How customers rate you, and what is behind the rating. That means NPS, CSAT and effort by month and channel, what detractors talk about, and the service numbers that cause it: reply times, abandoned calls and late orders. The four boards above cover those.
What KPIs should a CX dashboard track?
NPS, CSAT, customer effort score, detractor count, survey response rate and the themes in detractor comments are the core, with first reply time, abandon rate and on-time delivery underneath. The list below shows each one with the data it needs.
How do I build a customer experience dashboard?
Start with the score the business already reports. Then follow five steps.
  1. Export survey responses with the score, the date, the channel and the customer's plan or segment.
  2. Tag each comment with a theme from a short fixed list, by hand or with a rule.
  3. Add the help desk, phone and order exports with the same channel names.
  4. Check one month's NPS against the survey tool's own figure before anyone relies on the board.
  5. Refresh weekly, and give each channel owner a view filtered to their channel.
What is the difference between NPS, CSAT and CES?
NPS asks whether a customer would recommend you, and measures loyalty. CSAT asks how satisfied they were with one interaction. CES asks how much effort it took to get something done. The first board carries all three, because a customer can be satisfied with an answer and still find the process hard.
Where does customer experience data come from?
Usually a survey tool, a help desk such as Zendesk, the phone system, the order or e-commerce platform and the CRM. Mammoth has 100+ tested connectors, and can also connect to anything with a REST API. You combine the sources once, and Mammoth repeats the same steps on every refresh.
Can every team see it without a licence?
Yes. Dashboard viewers are unlimited and free on every Mammoth plan, including the free one, so support, product and store teams can all open it at no per-viewer cost. Only the people building the dashboards count as platform users.

Build the customer experience dashboard you actually need.

Start from one of these templates or your own spreadsheet. Share it with as many people as you like, free.

  • ✓ 14-day Pro trial
  • ✓ No credit card
  • ✓ Viewers always free