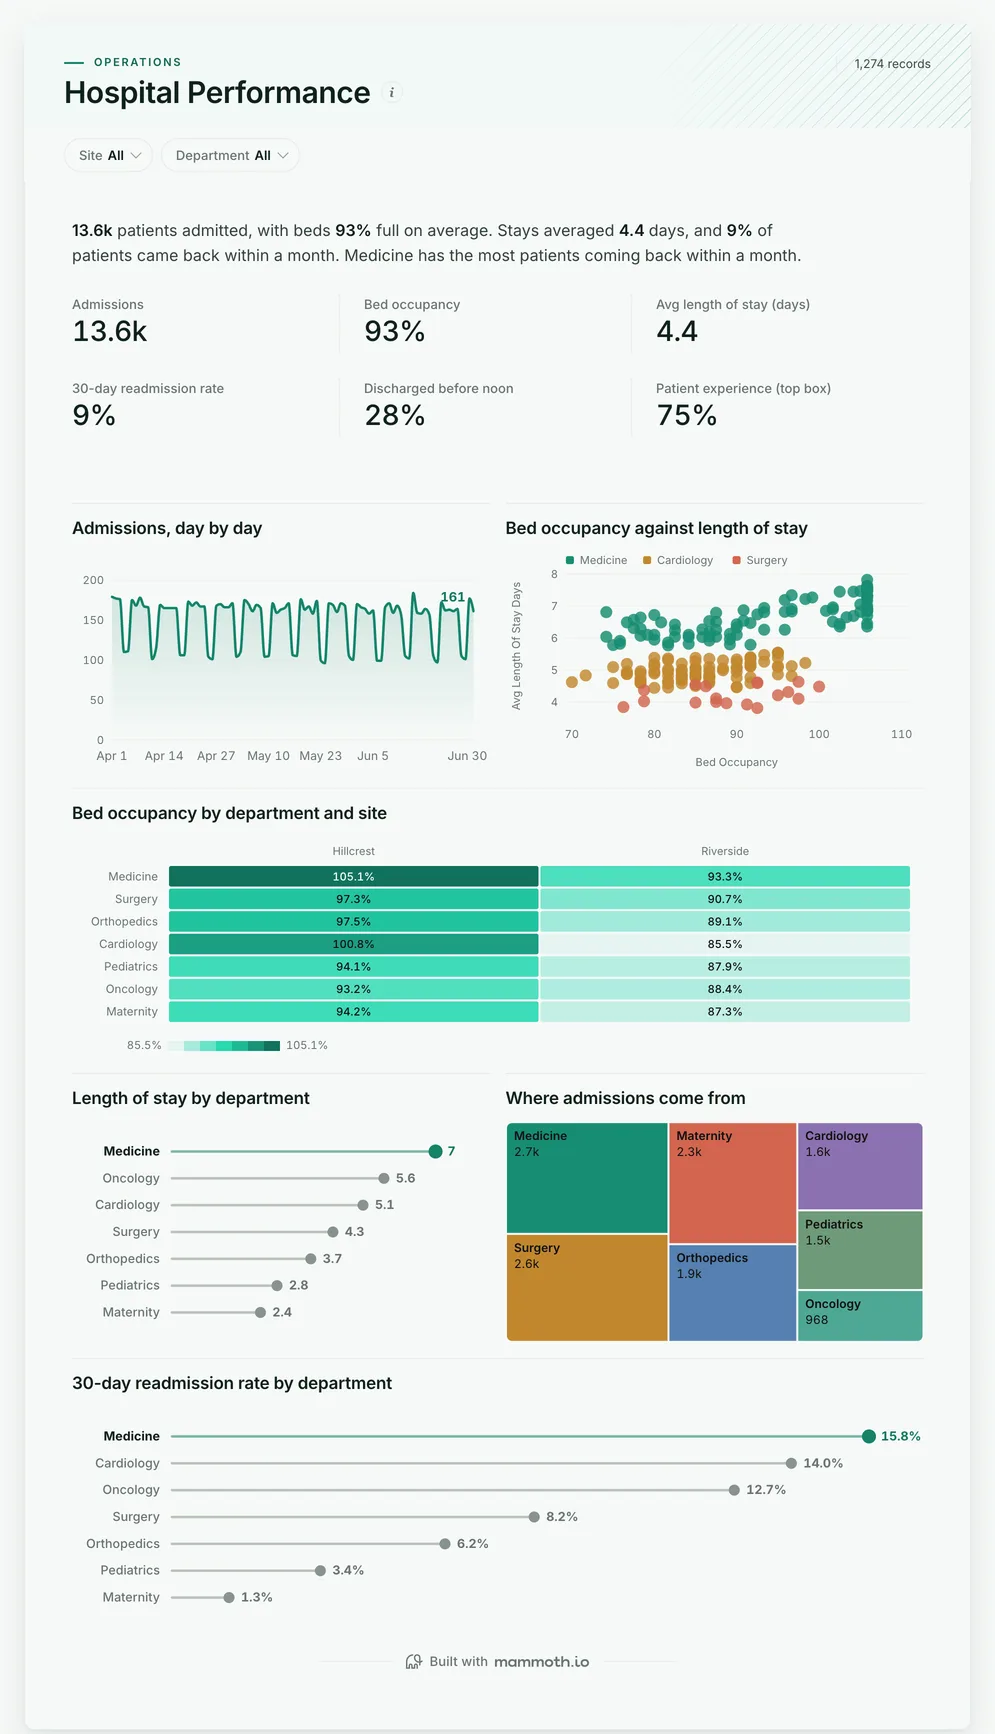
Hospital dashboard
Are there beds for the next patient, and which wards see patients come back?
- Admissions
- Bed occupancy
- Avg length of stay (days)
- 30-day readmission rate
Healthcare dashboards
Five dashboards for a hospital or care group: beds, stays and readmissions by ward, why clinical staff leave, where absence leaves gaps in the rota, each department against its budget, and where the supplies money goes. Open any of them to see it in full, then use it as a template for your own data.
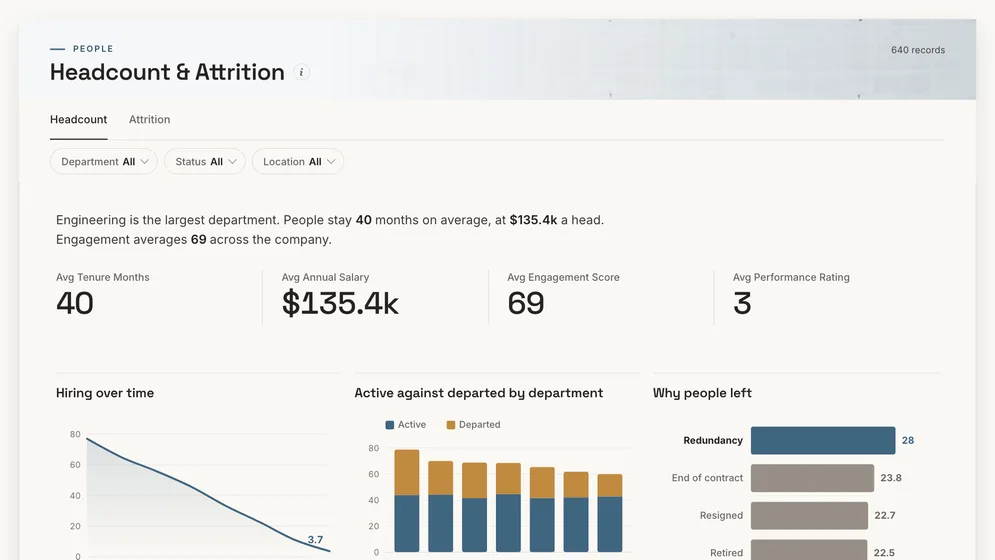
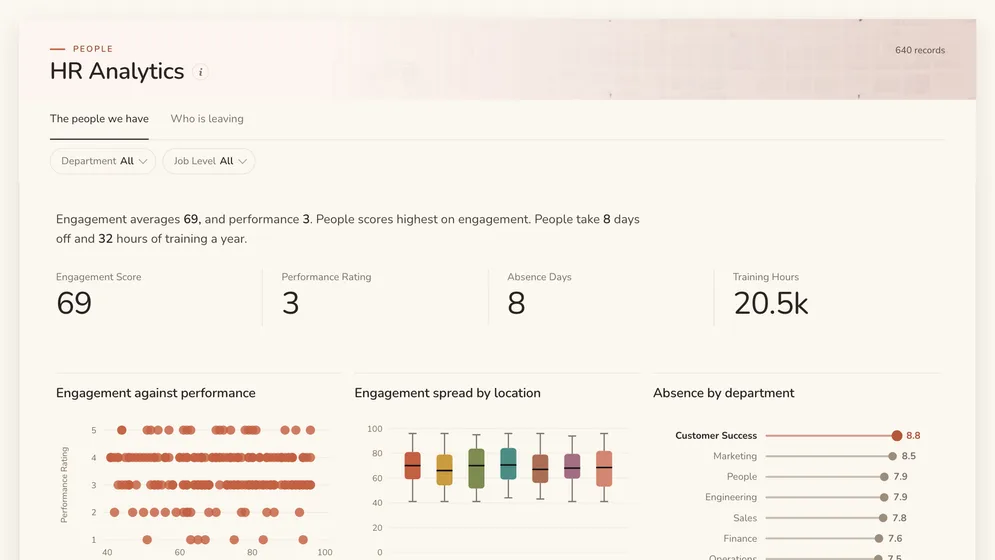
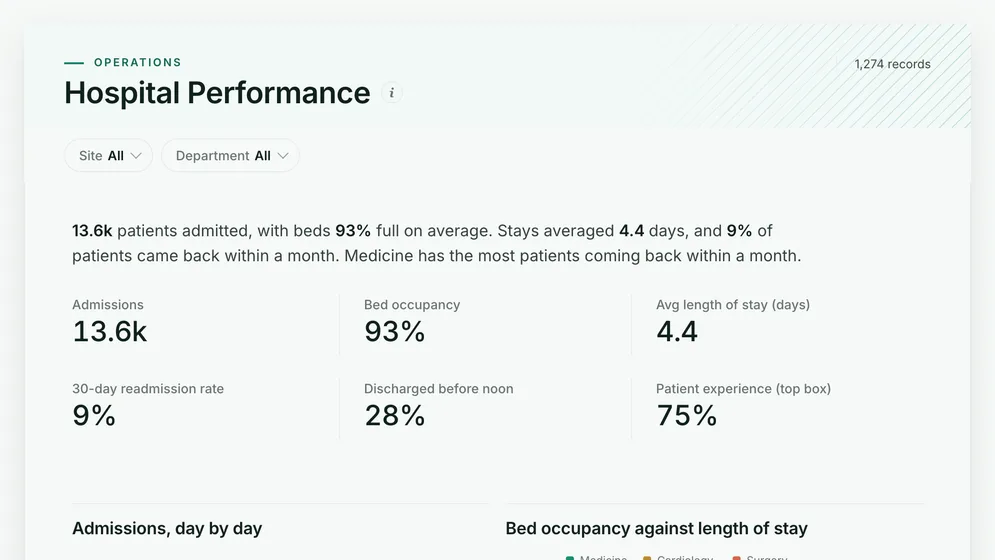
Three of the five examples. All figures are sample data.
The examples
Click a board to see all of it. Click Use template to start your own copy in Mammoth. All figures are sample data.
Are there beds for the next patient, and which wards see patients come back?
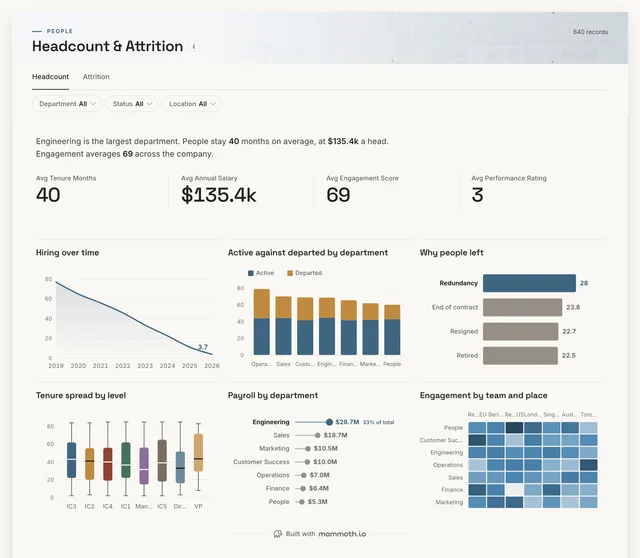
How many nurses and clinicians are leaving, and why?
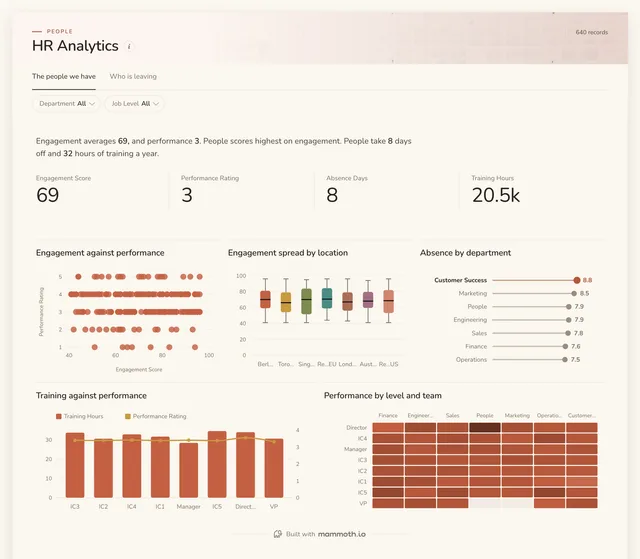
Which wards are short of staff through absence?
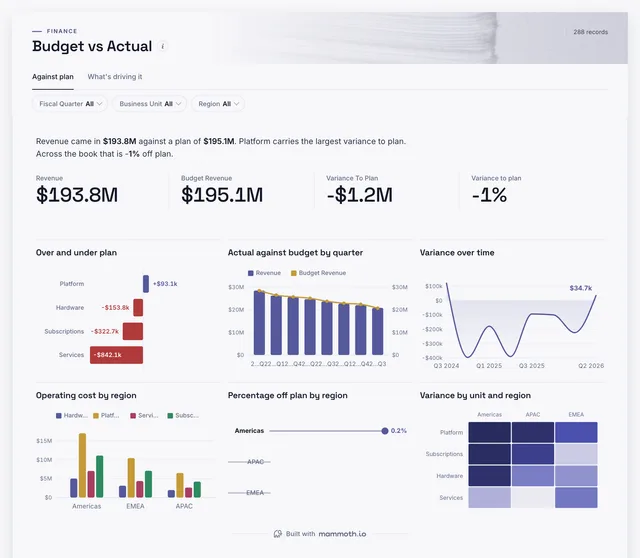
Is each department running to budget?
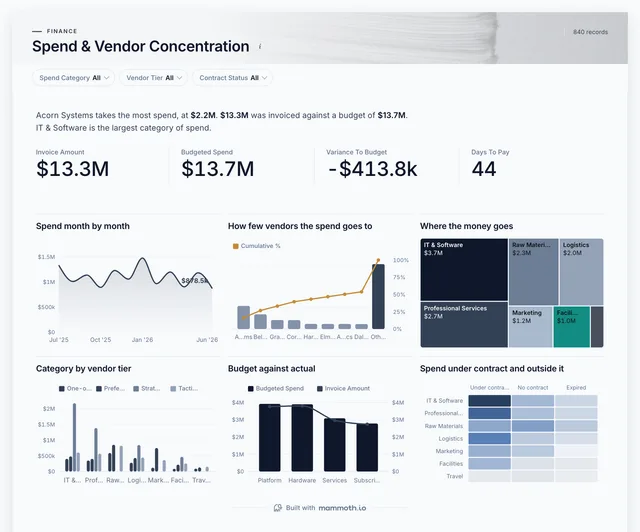
Where does the supplies money go?
Definition
A healthcare dashboard is one screen that shows how a hospital, clinic or care group is running: how many patients came in, how full the beds are, how long stays last, how many patients come back, and whether the staff and the budget can carry it. The data usually comes from the patient administration system, the rota and the finance ledger.
Occupancy, stay and readmissions on one set of definitions.
Turnover and absence beside the beds they staff.
Built from admissions and rota exports, not patient records.
The metrics
Eight numbers. Most depend on a definition agreed first, such as when a stay ends or what counts as a readmission.
How many patients came in?
One row per admission with date, ward and site. Count elective and emergency apart, because a drop in planned surgery and a quiet emergency department are different problems.
How full are the beds?
Occupied beds against staffed beds per ward and day, at the same time of day. Measured against total beds it hides the wards that are full because staff are short.
How long do patients stay?
Admission and discharge dates per stay. Read it by department, because a long stay in rehabilitation and a long stay in surgery mean different things.
How many patients come back within a month?
Discharges, and the readmissions that follow within 30 days, linked to the first stay. Planned returns, such as a second round of treatment, should be left out.
Are beds freed in time for the afternoon's admissions?
Discharge times per stay. A late discharge leaves a patient waiting in the emergency department for a bed, which is why this sits beside occupancy.
Would patients rate their care well?
Survey responses with the top-box share per ward. Show the response count too, because a ward with ten responses swings on one bad week.
How many clinicians are leaving?
Leavers and average headcount by department and role. Nursing turnover read separately from the rest shows where agency spend will follow.
Which departments are running over?
Budget and actual per department and cost line for the same period. Agency staffing is usually the line that explains it.
How to build one
From one of the examples above to a live dashboard on your own data.
Start from any of the five boards above.
Upload a spreadsheet, or connect one of 100+ tested connectors.
Fix and combine your data once. Mammoth repeats those steps for you.
The dashboard updates on a schedule and flags data that fails a check.
Public, password-protected or sign-in only, on every plan.
14-day Pro trial · No credit card
FAQ
Last reviewed against the template catalogue.
Start from one of these templates or your own spreadsheet. Share it with as many people as you like, free.
More dashboard examples


