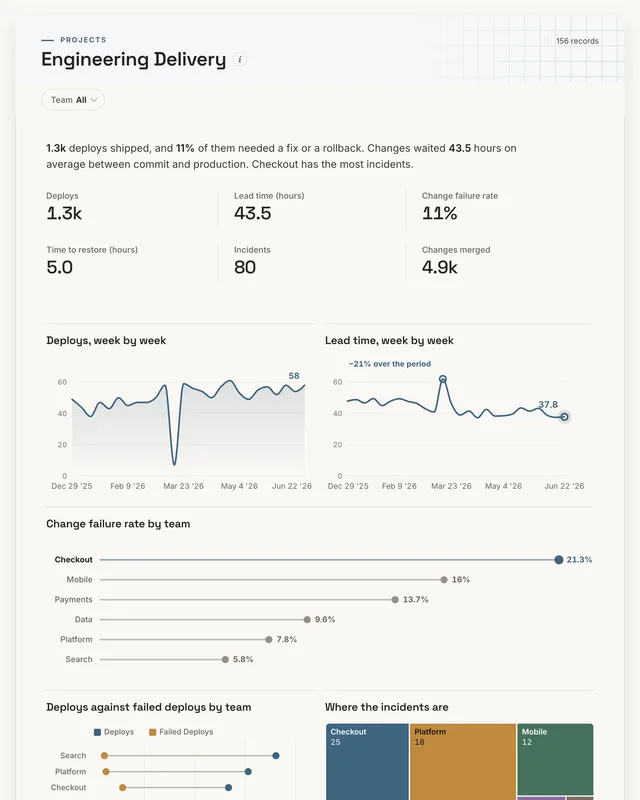
DevOps dashboard
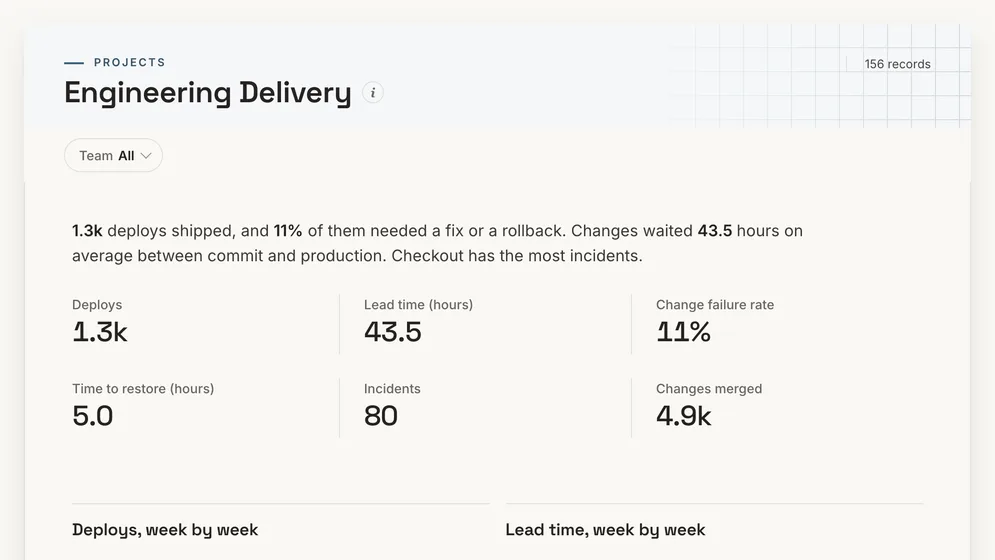
How often does each team ship, and how often does a release break?
- Deploys
- Lead time (hours)
- Change failure rate
- Time to restore (hours)
DevOps dashboards
Three dashboards for an engineering team: the four DORA measures by team with the incidents behind them, whether roadmap work is on track, and where engineering effort goes against plan. Open any of them to see it in full, then use it as a template for your own data.
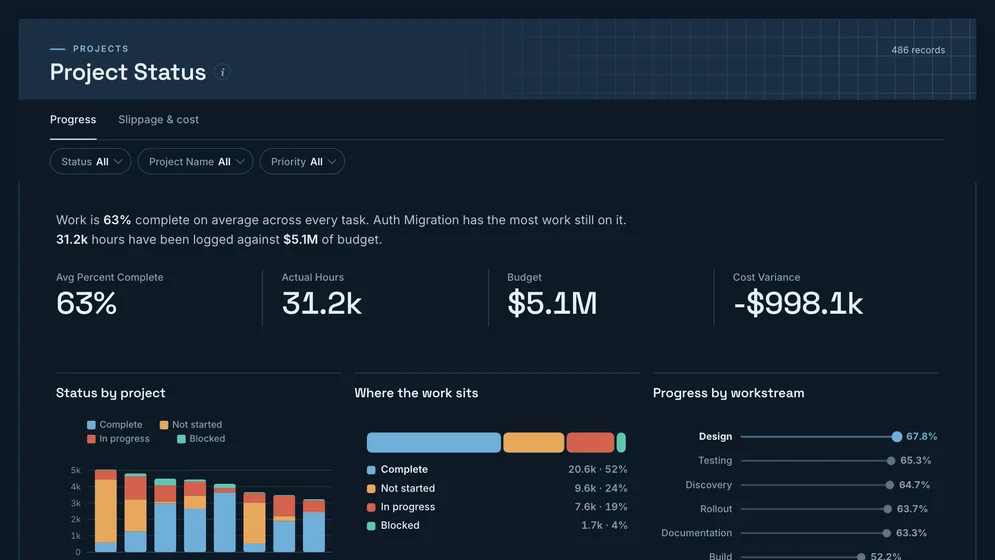
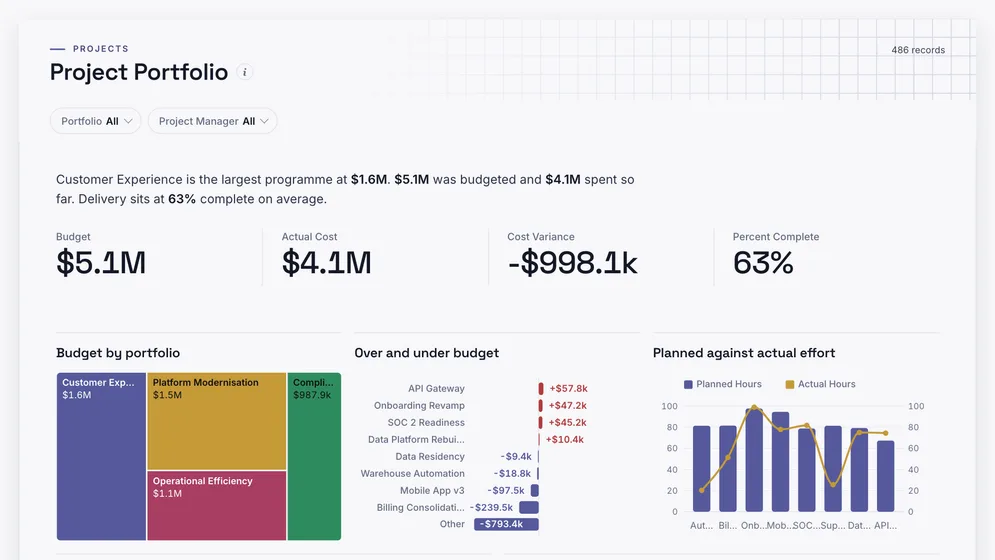
All figures are sample data.
The examples
Click a board to see all of it. Click Use template to start your own copy in Mammoth. All figures are sample data.
How often does each team ship, and how often does a release break?
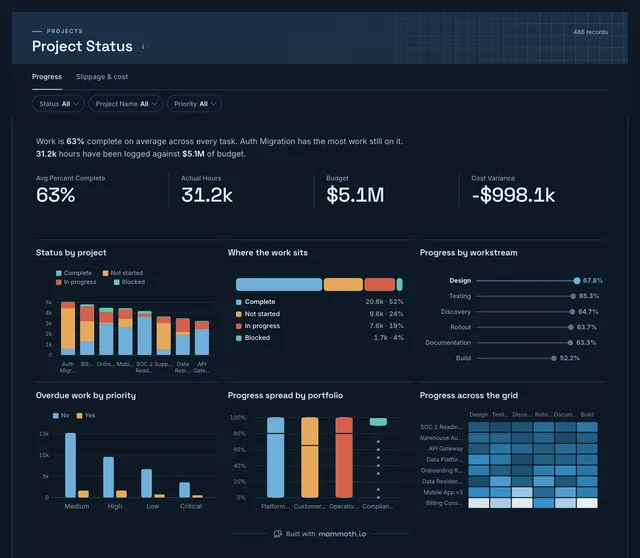
Is the roadmap work on track?
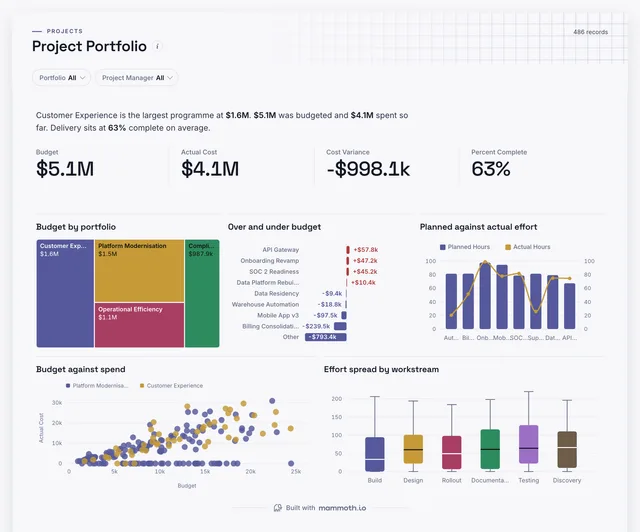
Is engineering effort going where it was planned?
Definition
A DevOps dashboard is one screen that shows how well an engineering organisation ships software: how often each team deploys, how long a change waits between commit and production, how often a release breaks something, and how long it takes to recover. The data usually comes from the CI/CD pipeline, the Git host and the incident tool.
Deploys, lead time, failure rate and restore time.
One fast, fragile team cannot hide in the average.
CI, Git and incident exports, joined once.
The metrics
Eight numbers. Most depend on a definition agreed first, such as what counts as a failed deploy.
How often does each team ship?
One row per production deploy with team and time. Count deploys, not merges, because a merge that waits a week has not shipped.
How long does a change wait to reach production?
Commit time and the time of the deploy that shipped it. Use the median, since one forgotten branch distorts the average.
How often does a release break something?
Deploys and the ones that needed a fix or rollback. Agree the rule once, or each team counts failure its own way.
How long does recovery take?
Incident start and resolution times. Clock it from when users were hurt, not from when someone noticed.
How many things went wrong in production?
Incidents by team, service and severity from the on-call or incident tool.
How much work is flowing through?
Merged pull requests by team and week. More merges with flat deploys means changes are queueing.
How much is started but not done?
Open tickets by status from the tracker. Too much in progress slows everything else.
How much time goes on fixes and support?
Effort tagged as planned or unplanned. Unplanned work that grows quarter on quarter is the roadmap shrinking.
How to build one
From one of the examples above to a live dashboard on your own data.
Start from any of the three boards above.
Upload a spreadsheet, or connect one of 100+ tested connectors.
Fix and combine your data once. Mammoth repeats those steps for you.
The dashboard updates on a schedule and flags data that fails a check.
Public, password-protected or sign-in only, on every plan.
14-day Pro trial · No credit card
FAQ
Last reviewed against the template catalogue.
Start from one of these templates or your own spreadsheet. Share it with as many people as you like, free.
More dashboard examples


