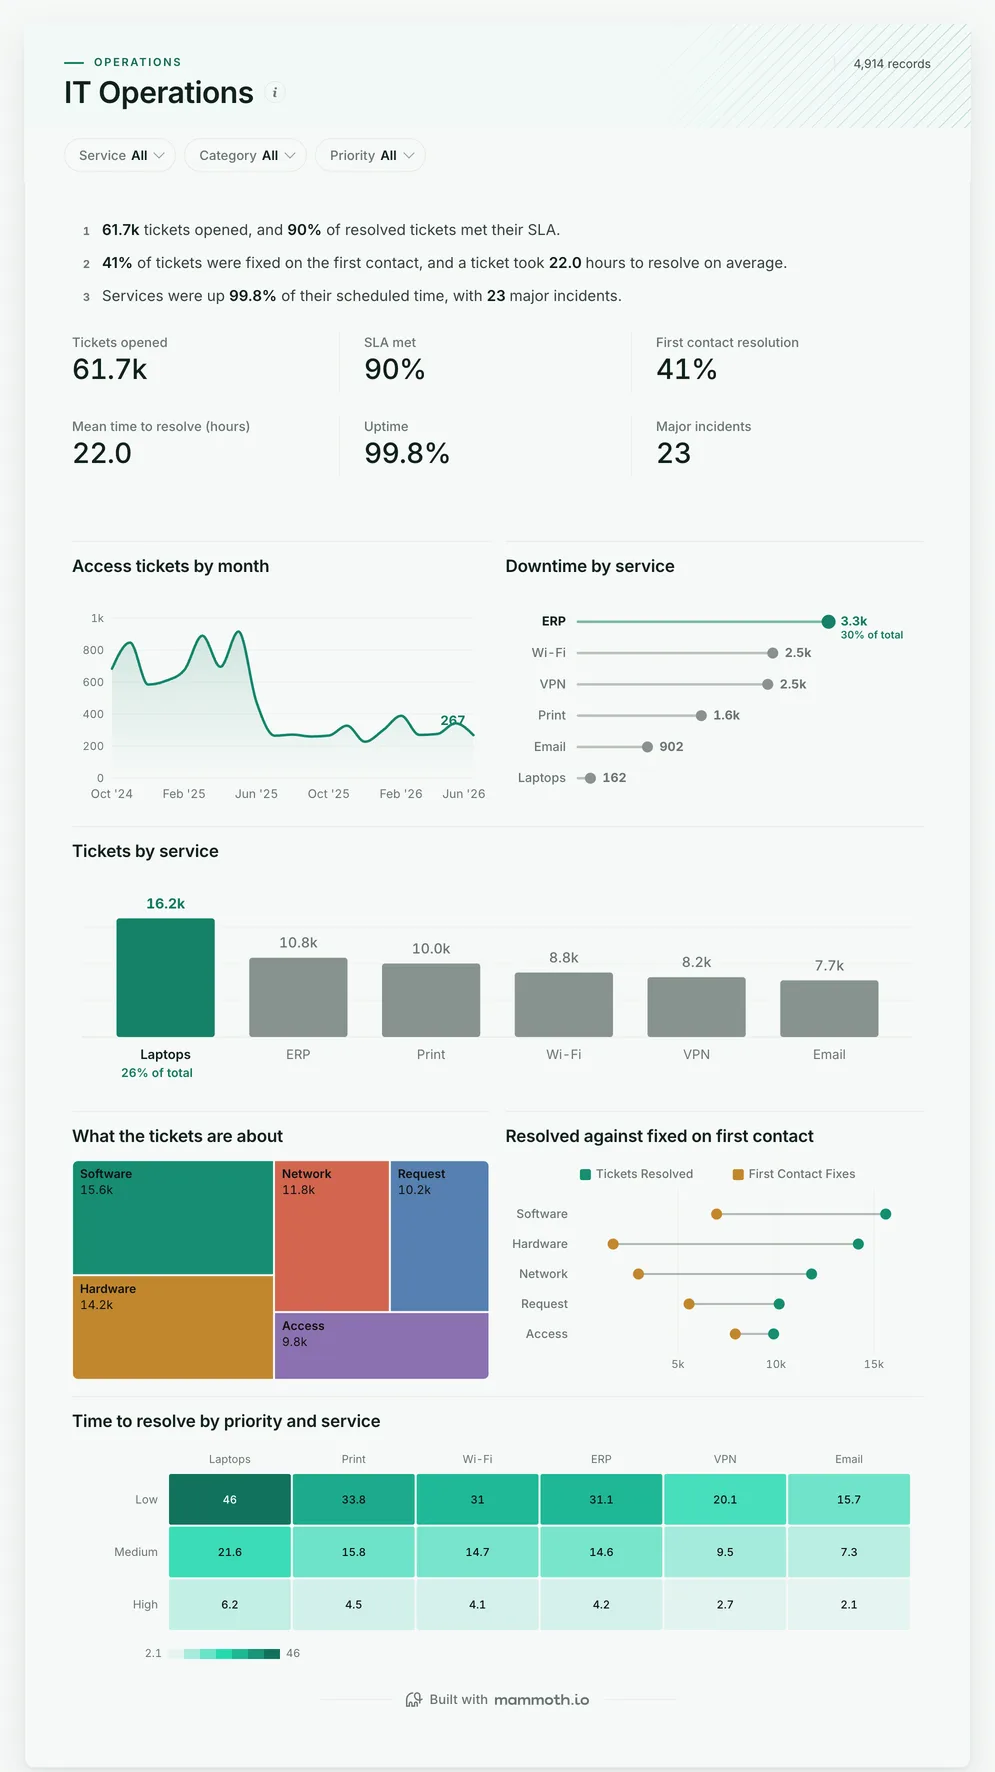
IT dashboard
Are our services up, and is the service desk keeping up?
- Tickets opened
- SLA met
- First contact resolution
- Mean time to resolve (hours)
IT dashboards
Four dashboards for an IT team: uptime, tickets and resolution times by service, the service desk queue, whether changes are breaking production, and whether IT projects are on budget. Open any of them to see it in full, then use it as a template for your own data.
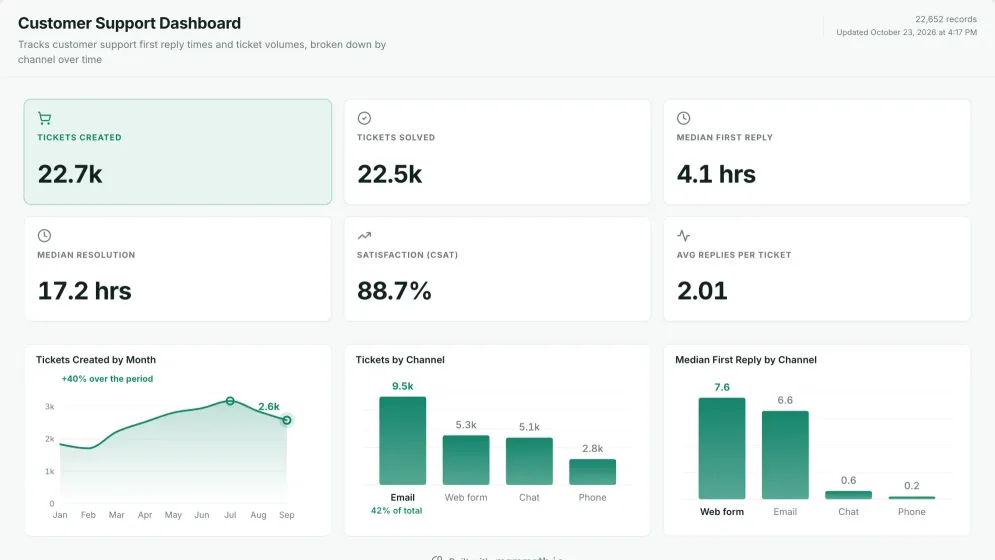
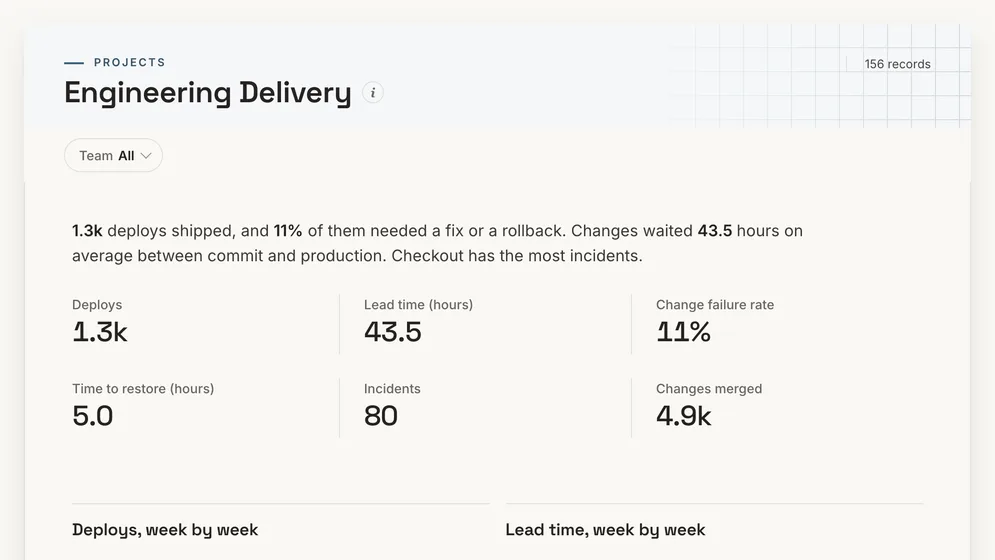
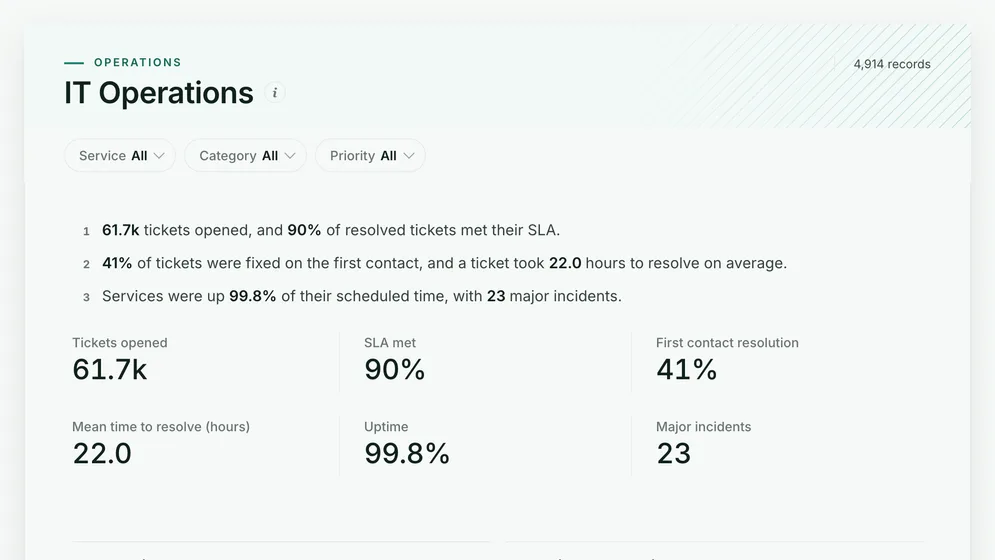
Three of the four examples. All figures are sample data.
The examples
Click a board to see all of it. Click Use template to start your own copy in Mammoth. All figures are sample data.
Are our services up, and is the service desk keeping up?
Are customers hearing back fast enough, and is the queue keeping up?
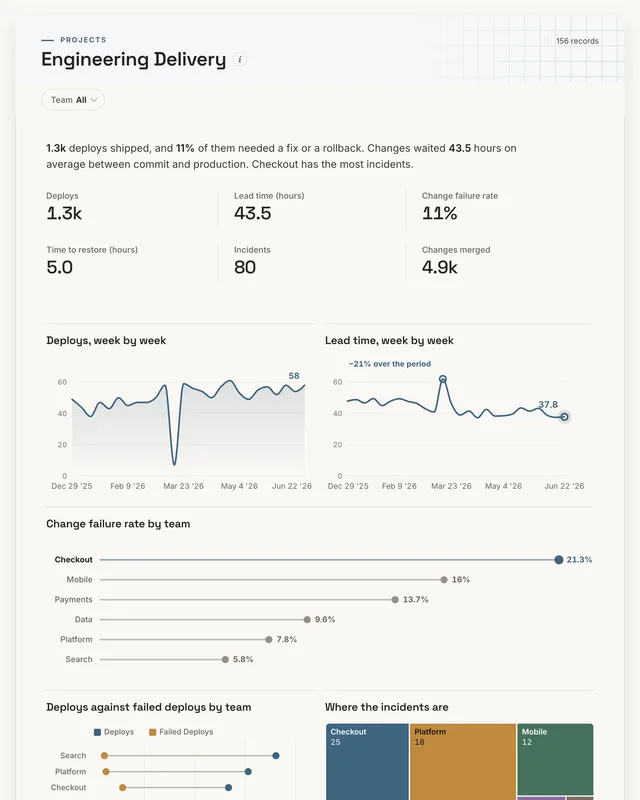
Are changes breaking production?
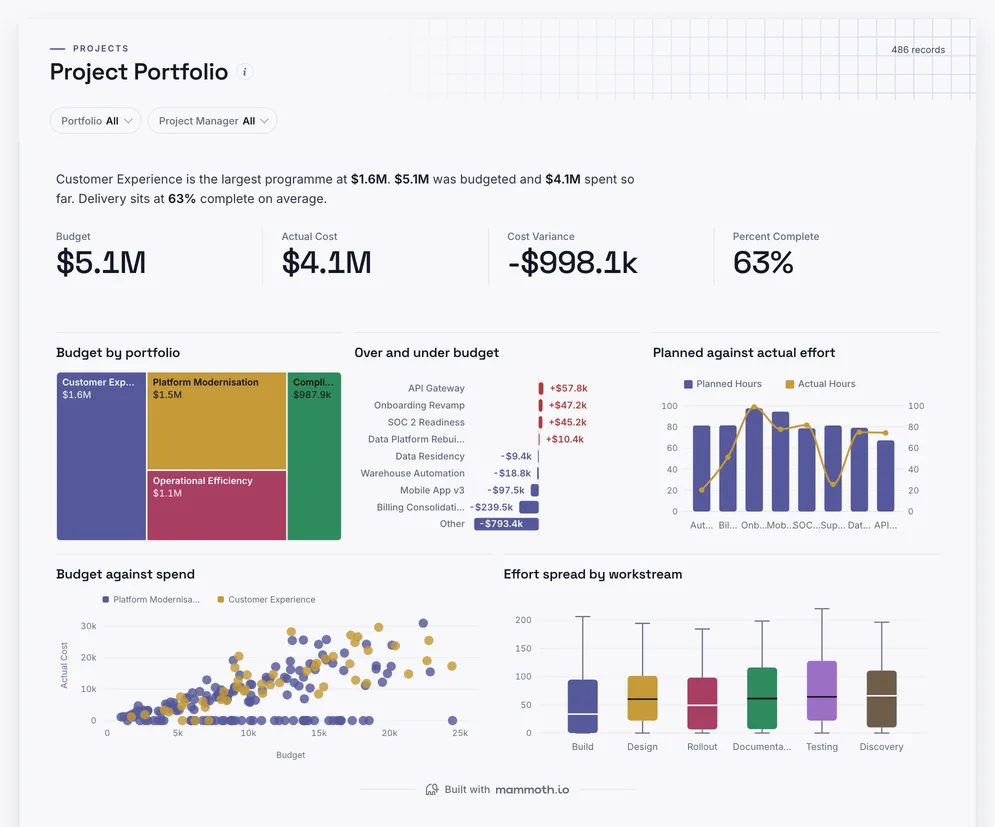
Are IT projects on budget?
Definition
An IT dashboard is one screen that shows how an IT team is serving the business: whether systems are up, how many tickets come in and from where, how many are fixed on first contact, how long the rest take, and whether service levels are met. The data usually comes from the service desk or ITSM tool and a monitoring system.
Uptime beside the tickets each service brings.
Tickets by category show the repeat requests.
ServiceNow, Jira or Freshservice data, joined once.
The metrics
Eight numbers. Most depend on a definition agreed first, such as when a ticket counts as resolved.
How much work comes in?
Tickets by service, category and week. Read it by category to find the requests that repeat.
Are tickets resolved within the promised time?
Resolution time and the target for each priority. Pausing the clock while waiting on the user needs one rule for everyone.
How many tickets are fixed in one go?
A flag on each ticket for fixed on first contact. A high rate lowers cost and lifts satisfaction together.
How long does a fix take?
Opened and resolved times, by priority. A median by priority reads truer than one average over all of them.
Are services available when people need them?
Up and scheduled minutes per service from monitoring. Planned maintenance should be agreed in or out once.
How many outages hit many people?
Incidents flagged major by a fixed rule, with the services affected.
Which systems fail most?
Downtime minutes per service. A small service down often can cost less than a core one down once.
How many changes cause an incident?
Changes and the incidents they caused. Most outages follow a change.
How to build one
From one of the examples above to a live dashboard on your own data.
Start from any of the four boards above.
Upload a spreadsheet, or connect one of 100+ tested connectors.
Fix and combine your data once. Mammoth repeats those steps for you.
The dashboard updates on a schedule and flags data that fails a check.
Public, password-protected or sign-in only, on every plan.
14-day Pro trial · No credit card
FAQ
Last reviewed against the template catalogue.
Start from one of these templates or your own spreadsheet. Share it with as many people as you like, free.
More dashboard examples


