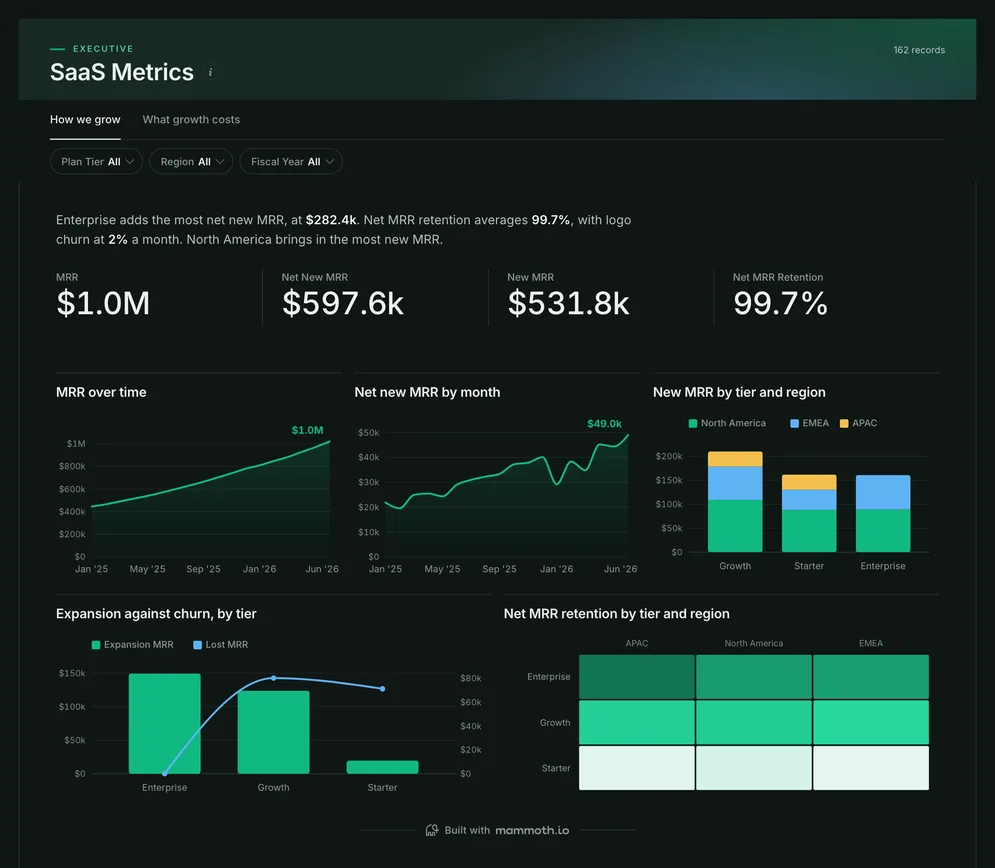
Startup metrics dashboard
Is recurring revenue growing, and for the right reasons?
- MRR
- Net new MRR
- New MRR
- Net MRR retention
Startup dashboards
Five dashboards a startup runs on: recurring revenue, the financial headline, spending against plan, the sales pipeline, and an investor's view across many companies. Then the same numbers as a board deck. Open any of them to see it in full, then use it as a template for your own data.
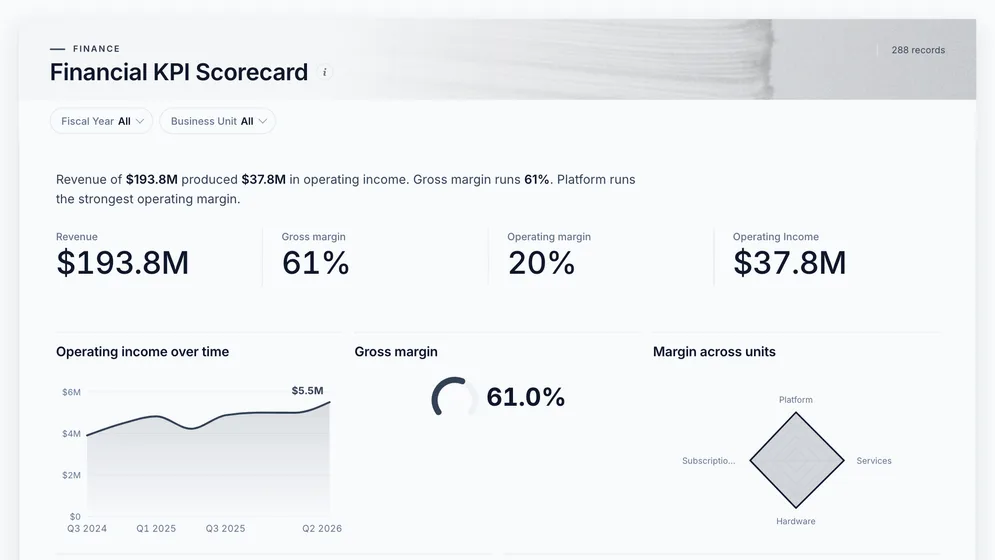
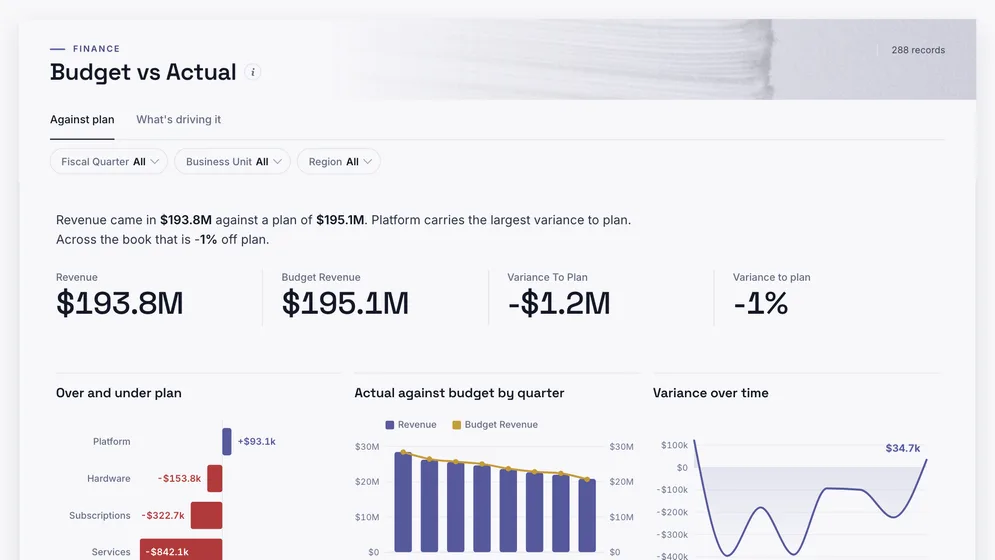
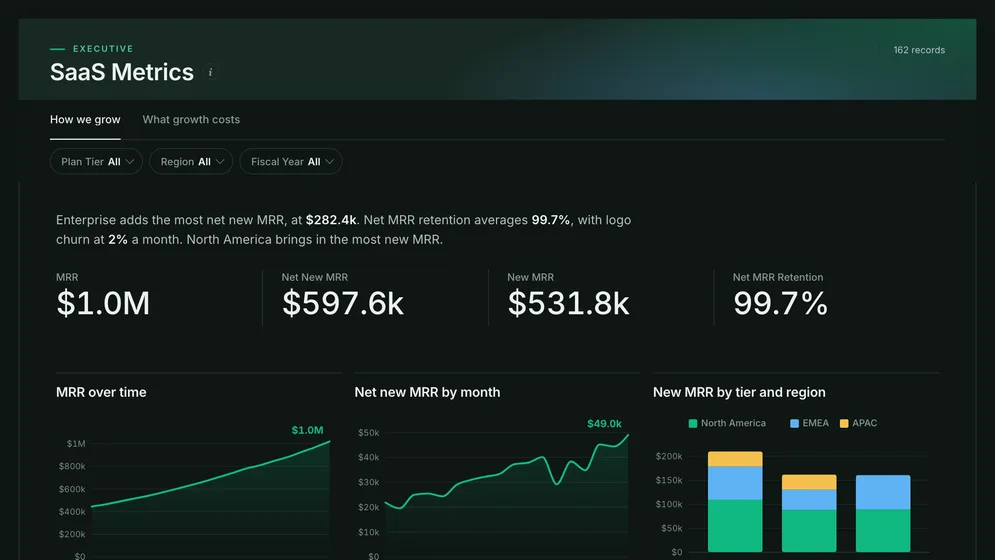
Three of the five examples. All figures are sample data.
The examples
Click a board to see all of it. Click Use template to start your own copy in Mammoth. All figures are sample data.
Is recurring revenue growing, and for the right reasons?
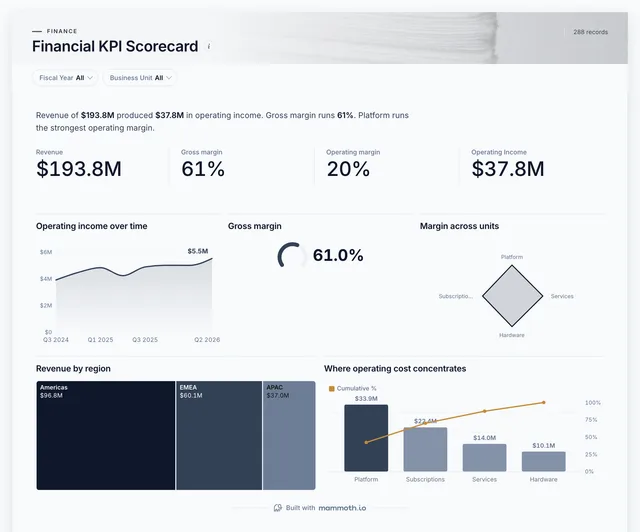
Are revenue and margin moving the right way?
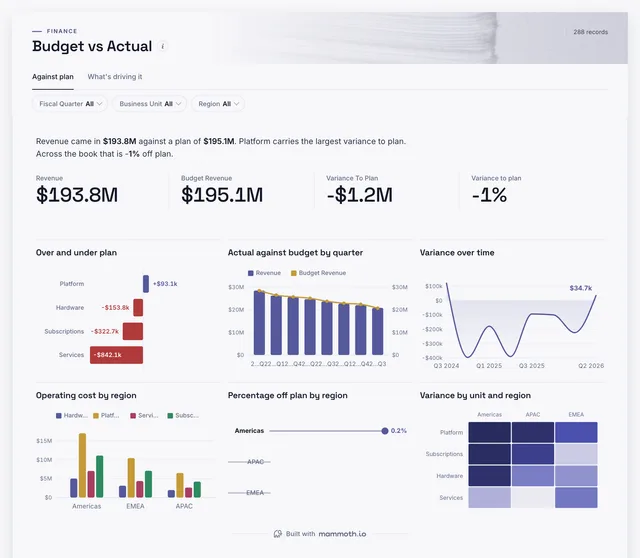
Is the money going where the plan said it would?
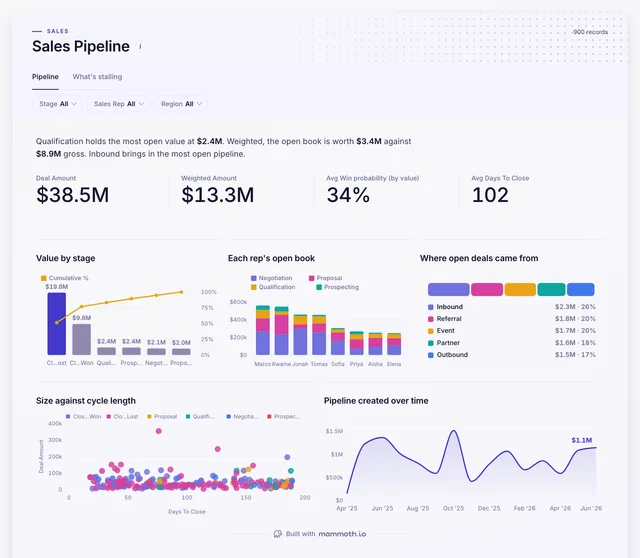
Is there enough pipeline to make next quarter's number?
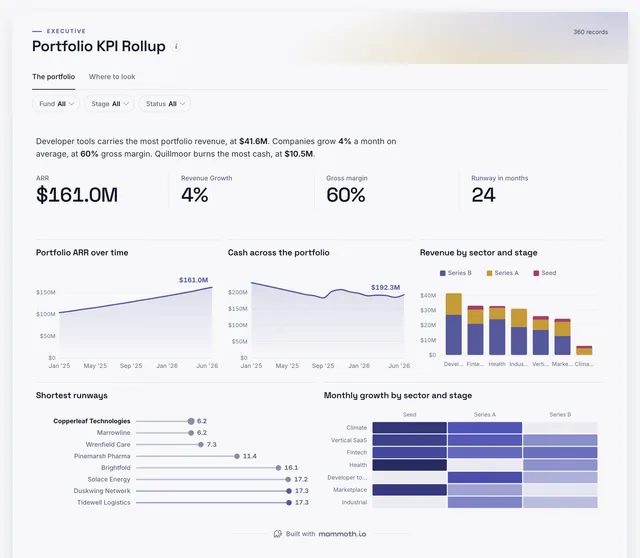
Across a portfolio of startups, which are growing and which are running out of cash?
Definition
A startup dashboard is one screen that shows whether a young company is growing and how long its cash lasts: recurring revenue, growth, retention, margin, burn, runway and the pipeline behind next quarter. The data usually comes from billing, accounting, the CRM and the budget.
Recurring revenue beside what it costs.
Spend against plan, every month.
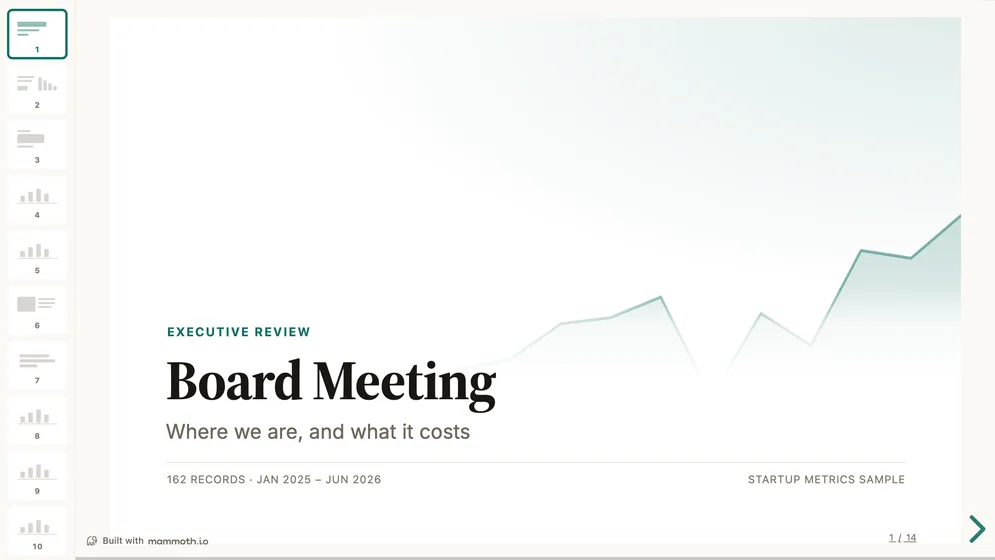
The same numbers as a deck.
The metrics
Eight numbers. Several need a definition agreed first, such as what counts as recurring.
How much revenue repeats every month?
Active subscriptions by customer and month from billing. One-off fees and services stay out.
How fast is the company growing?
MRR or revenue by month. Read it over three months, since one large customer makes a single month look like a trend.
Do existing customers spend more or less over time?
This month's revenue from customers who were paying a year ago, over what they paid then.
How much revenue or how many customers left?
Cancelled and downgraded MRR by month. Report revenue churn and customer churn separately.
How much of each sale is left after the cost of delivering it?
Revenue and cost of revenue (hosting, support, payment fees) by month.
How much cash does the company use each month?
Cash out minus cash in by month, from the bank or the cash-flow statement.
How many months until the cash runs out?
Cash on hand over average monthly burn. Average a few months, since one large payment distorts one month.
What does a new customer cost to win?
Sales and marketing spend over new customers for the same period.
Reports and decks
This deck uses the same sample company as the first dashboard above, as five slides for the board meeting.
How to build one
From one of the examples above to a live dashboard on your own data.
Start from any of the five boards above.
Upload a spreadsheet, or connect one of 100+ tested connectors.
Fix and combine your data once. Mammoth repeats those steps for you.
The dashboard updates on a schedule and flags data that fails a check.
Public, password-protected or sign-in only, on every plan.
14-day Pro trial · No credit card
FAQ
Last reviewed against the template catalogue.
Start from one of these templates or your own spreadsheet. Share it with as many people as you like, free.
More dashboard examples


