Skip to content

Law firm dashboards

Law firm dashboard examples

Five dashboards for a law firm: fees, utilization and realization by practice, which clients owe fees and for how long, each practice against its budget, which associates are leaving, and how pay sits against level. Open any of them to see it in full, then use it as a template for your own data.
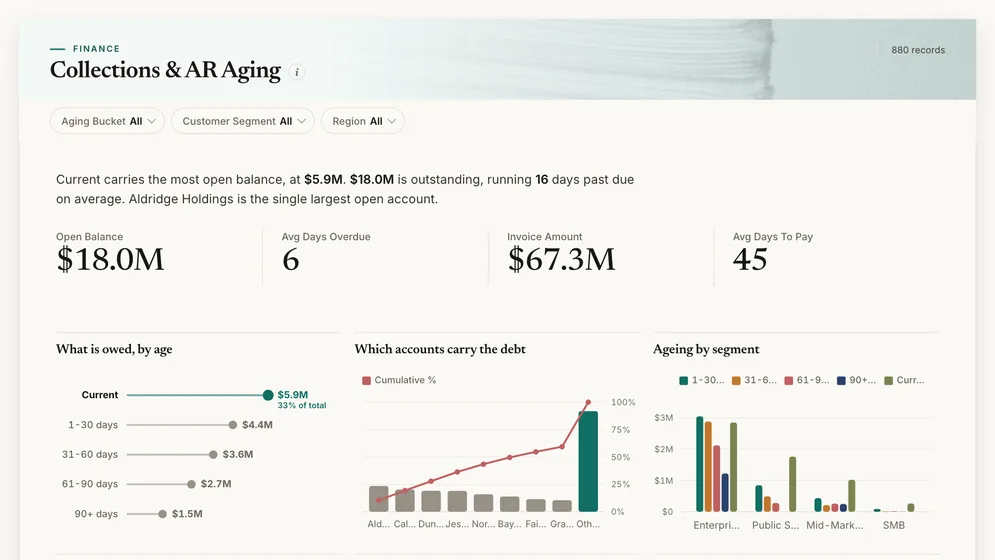
Collections & AR Aging dashboard: Open Balance, Days Overdue, Invoice Amount and Days To Pay tiles.
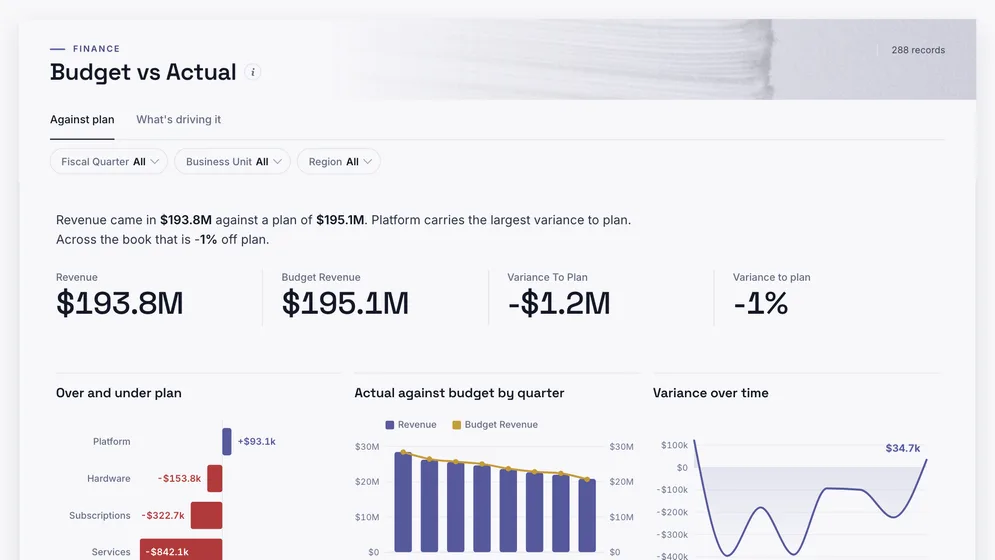
Budget vs Actual dashboard: Revenue, Budget Revenue and Variance To Plan tiles, above Over and under plan.
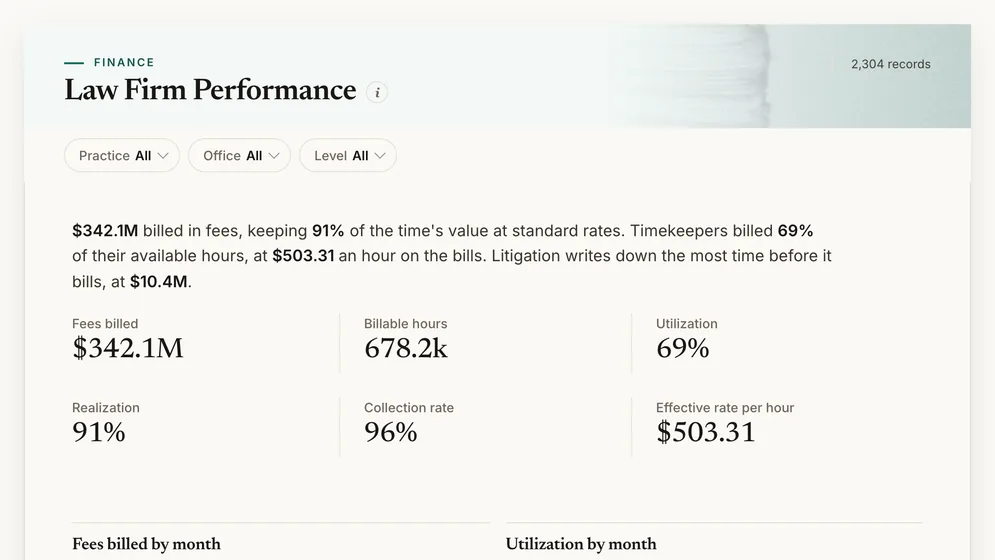
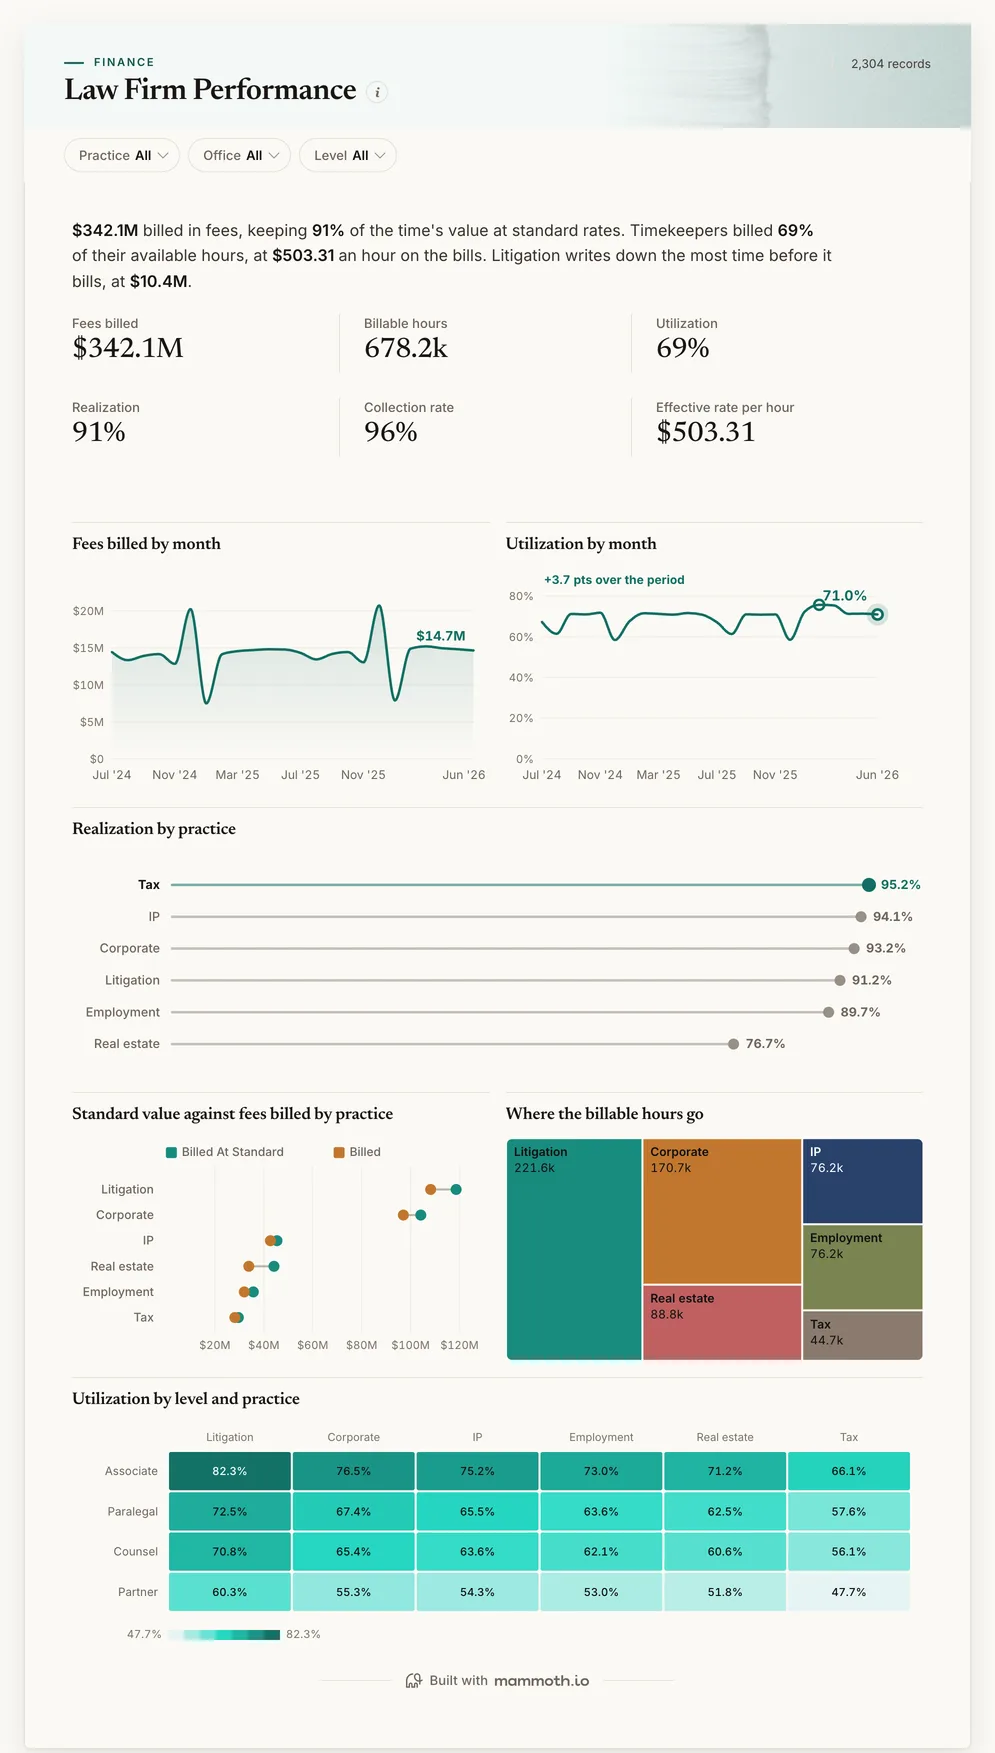
Law Firm Performance dashboard: Fees billed, Billable hours, Utilization, Realization and Collection rate tiles.

Three of the five examples. All figures are sample data.

The examples

Five law firm dashboard examples and templates

Click a board to see all of it. Click Use template to start your own copy in Mammoth. All figures are sample data.

  1. Law Firm Performance dashboard: Fees billed, Billable hours, Utilization, Realization and Collection rate tiles.
    Sample data

    Law firm dashboard

    Are lawyers busy, and how much of their time turns into fees?
    • Fees billed
    • Billable hours
    • Utilization
    • Realization
    Use template
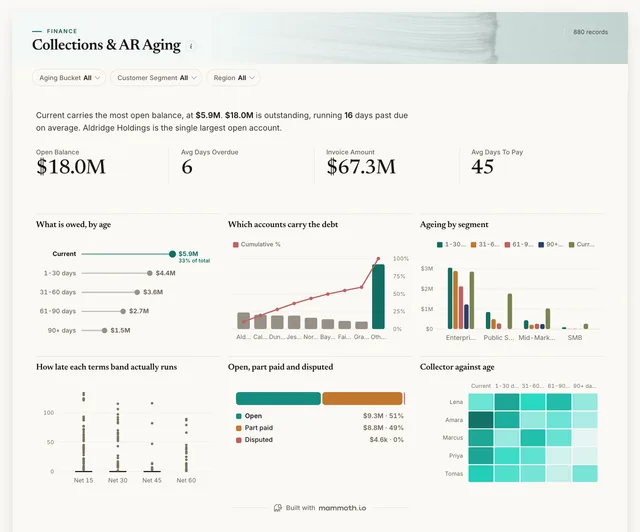
  2. Collections & AR Aging dashboard: Open Balance, Days Overdue, Invoice Amount and Days To Pay tiles.
    Sample data

    Law firm collections dashboard

    Which clients owe fees, and how late are they?
    • Open balance
    • Days overdue
    • Invoice amount
    • Days to pay
    Use template
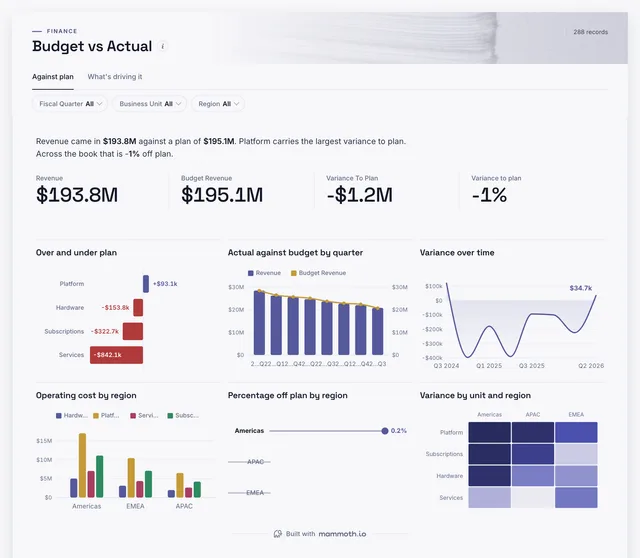
  3. Budget vs Actual dashboard: Revenue, Budget Revenue and Variance To Plan tiles, above Over and under plan.
    Sample data

    Law firm budget dashboard

    Is each practice on budget for the year?
    • Revenue
    • Budget revenue
    • Variance to plan
    Use template
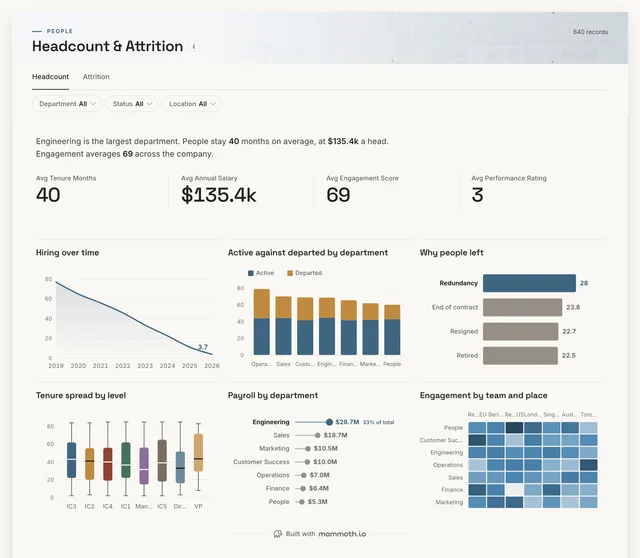
  4. Headcount & Attrition dashboard: Tenure Months, Annual Salary, Engagement Score and Performance Rating tiles.
    Sample data

    Law firm attrition dashboard

    Are associates leaving, and at what level?
    • Tenure months
    • Annual salary
    • Engagement score
    • Performance rating
    Use template
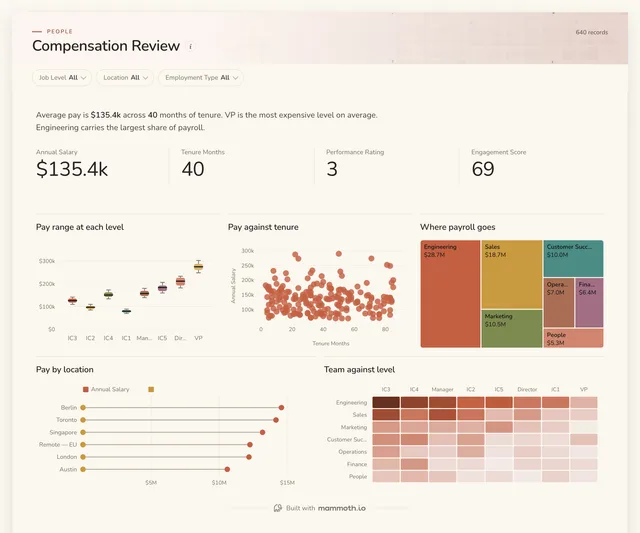
  5. Compensation Review dashboard: Annual Salary, Tenure Months, Performance Rating and Engagement Score tiles.
    Sample data

    Law firm compensation dashboard

    Is pay in line with level and tenure?

    • Annual salary
    • Tenure months
    • Performance rating
    • Engagement score
    Use template

Definition

What a law firm dashboard is

A law firm dashboard is one screen that shows how a firm turns lawyers' time into cash: billable hours, utilization against available hours, fees billed, how much is written down before billing, and how much of what is billed is collected. The data usually comes from the practice management or time and billing system, the accounts and HR.

  • Time to cash

    Hours worked, billed, written down and collected.

  • By practice and level

    Utilization where the leverage is.

  • From the practice system

    Time and billing exports, no new software.

The metrics

The metrics a law firm dashboard is built from

Eight numbers. Most depend on a definition agreed first, such as available hours or the standard rate.

  • Billable hours

    How much client work was done?

    What the data needs

    Time entries marked billable, by lawyer and month. Hours recorded late make the current month look quiet, so read it a week after month end.

  • Utilization

    What share of available time is billable?

    What the data needs

    Billable hours against available hours per lawyer. Agree available hours once, net of leave, or each office will use its own.

  • Realization

    How much of the time's value reaches a bill?

    What the data needs

    Value at standard rate and value billed per matter. The gap is the write-down, and it is the number partners discuss least.

  • Fees billed

    How much was invoiced?

    What the data needs

    Bills by matter, practice and month, net of credit notes.

  • Collection rate

    How much of what was billed was paid?

    What the data needs

    Billed and collected amounts per bill. A high billing month means little if the cash arrives a year later.

  • Effective rate per hour

    What does an hour earn once write-downs are taken?

    What the data needs

    Fees billed divided by hours billed, by level. Compare it with the rate card to see the discount clients get.

  • Lockup

    How long does work wait before it is cash?

    What the data needs

    Unbilled time plus unpaid bills, in days of fees. Long lockup is the firm lending its clients money.

  • Associate attrition

    Are associates leaving?

    What the data needs

    Leavers and headcount by level and practice. Attrition in the second to fifth year costs the most training.

How to build one

How to build your own law firm dashboard

From one of the examples above to a live dashboard on your own data.

  1. 1

    Pick a template

    Start from any of the five boards above.

  2. 2

    Add your data

    Upload a spreadsheet, or connect one of 100+ tested connectors.

  3. 3

    Clean it once

    Fix and combine your data once. Mammoth repeats those steps for you.

  4. 4

    Set it to refresh

    The dashboard updates on a schedule and flags data that fails a check.

  5. 5

    Share the link

    Public, password-protected or sign-in only, on every plan.

Start with a template

14-day Pro trial · No credit card

FAQ

Law firm dashboard questions

Last reviewed against the template catalogue.

What should a law firm dashboard show?
Whether lawyers are busy, whether their time is billed at full value, and whether the bills are paid. That means utilization, realization, fees billed, collection rate and the effective rate per hour by practice and level. The boards above cover those, with debt, budgets and people beside them.
What KPIs should a law firm track?
Fees billed, billable hours, utilization, realization, collection rate and effective rate per hour are the core, with lockup and associate attrition underneath. The list below shows each one with the data it needs.
How do I build a law firm dashboard?
Start with the number the partners' meeting opens with. Then follow five steps.
  1. Export time entries with lawyer, level, practice, office, hours and value at standard rate.
  2. Export bills and receipts with the matter and client, from the billing system.
  3. Add available hours per lawyer and month, so utilization has a fixed base.
  4. Check one month's fees against the accounts before anyone relies on the board.
  5. Refresh monthly, and give each practice head a view filtered to their group.
What is the difference between utilization and realization?
Utilization is the share of available hours that were billable. Realization is the share of the billable value that reached a bill, after write-downs. A practice can be fully busy and still earn poorly if it writes down a large part of its time, which is why the first board shows both.
Where does law firm data come from?
Usually a practice management or time and billing system such as Clio or Aderant, the accounts, and an HR system or spreadsheet. Mammoth has 100+ tested connectors, and can also connect to anything with a REST API. You combine the sources once, and Mammoth repeats the same steps on every refresh.
Can partners see it without a licence?
Yes. Dashboard viewers are unlimited and free on every Mammoth plan, including the free one, so every partner and practice head can open it at no per-viewer cost. Only the people building the dashboards count as platform users.

Build the law firm dashboard you actually need.

Start from one of these templates or your own spreadsheet. Share it with as many people as you like, free.

  • ✓ 14-day Pro trial
  • ✓ No credit card
  • ✓ Viewers always free