Skip to content

PPC dashboards

PPC dashboard examples

Five dashboards for paid ads: one each for Google Ads, Meta Ads and LinkedIn Ads, then every campaign and every channel compared on the same terms. Open any of them to see it in full, then use it as a template for your own data.
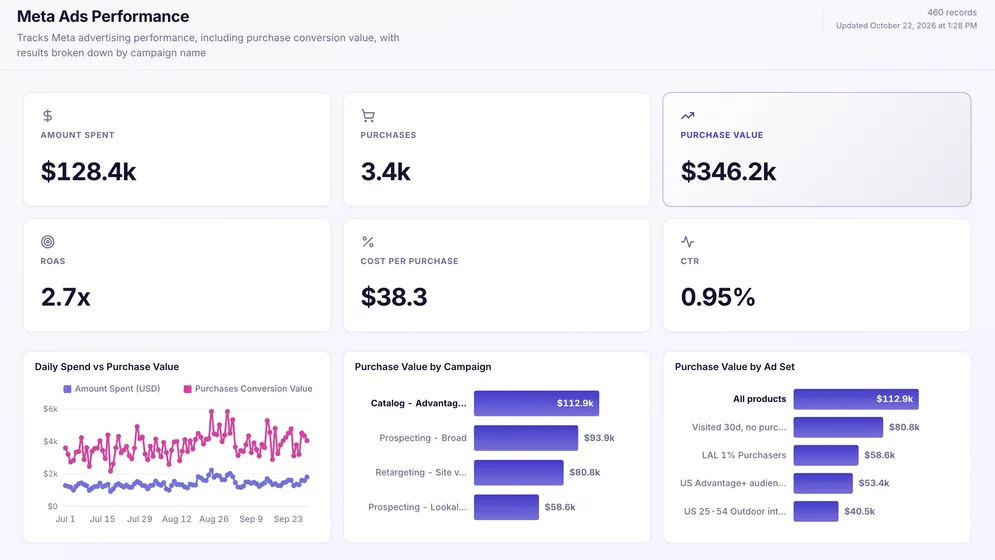
Meta Ads dashboard on sample data: spend, purchases, purchase value, ROAS, cost per purchase and CTR, with daily trend and value by campaign and ad set.
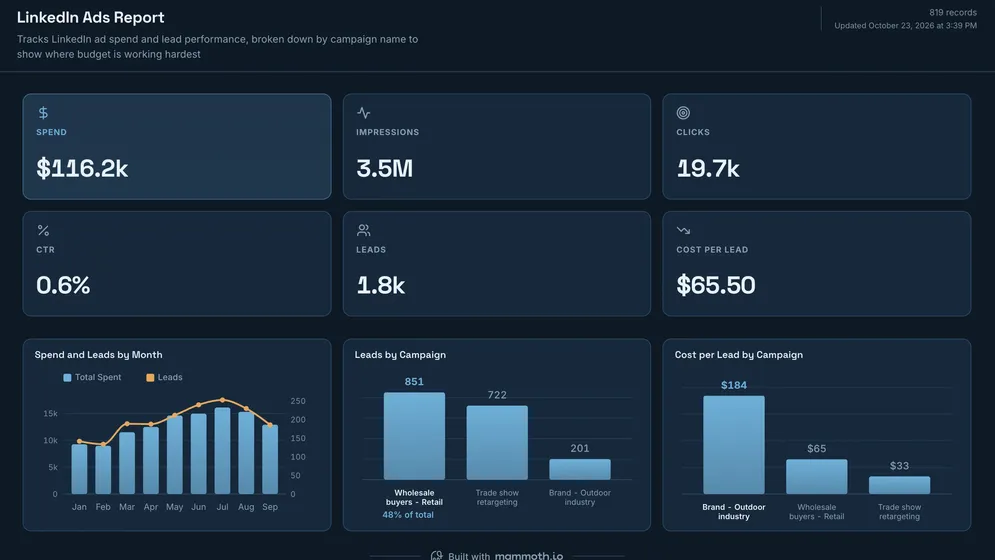
LinkedIn Ads report on sample data: spend, impressions, clicks, CTR, leads and cost per lead, by month and campaign.
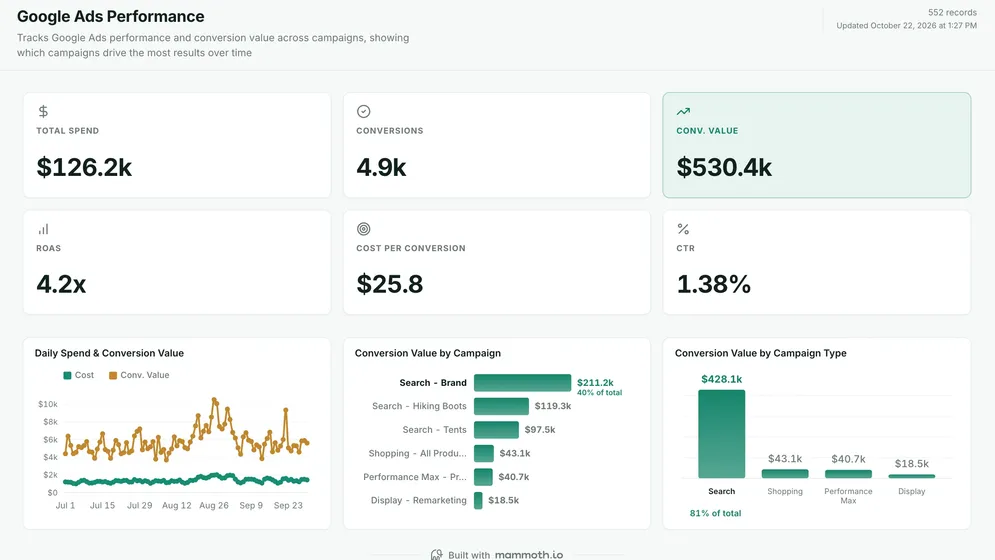
Google Ads dashboard on sample data: spend, conversions, conversion value, ROAS, cost per conversion and CTR, with daily trend and value by campaign and type.

Three of the five examples. All figures are sample data.

The examples

Five PPC dashboard examples and templates

Click a board to see all of it. Click Use template to start your own copy in Mammoth. All figures are sample data.

  1. Meta Ads dashboard on sample data: spend, purchases, purchase value, ROAS, cost per purchase and CTR, with daily trend and value by campaign and ad set.
    Sample data

    Meta Ads dashboard

    What do Facebook and Instagram ads cost, and which ad sets sell?

    • Amount spent
    • Purchases
    • Purchase value
    • ROAS
    Use template
  2. LinkedIn Ads report on sample data: spend, impressions, clicks, CTR, leads and cost per lead, by month and campaign.
    Sample data

    LinkedIn Ads dashboard

    What does a lead from LinkedIn cost, and which campaign brings the cheap ones?
    • Spend
    • Impressions
    • Clicks
    • CTR
    Use template
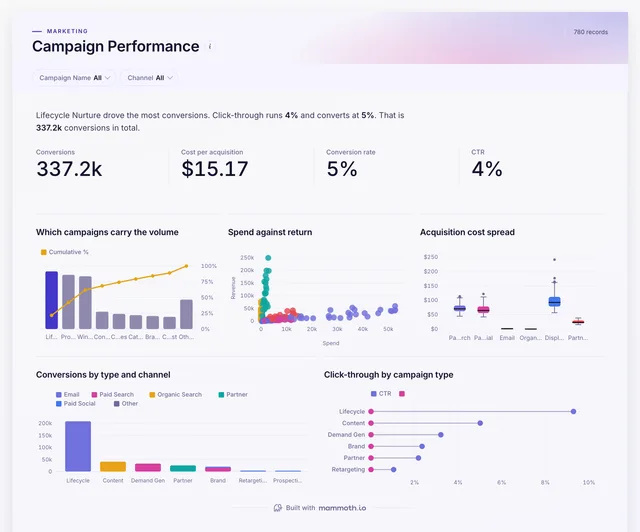
  3. Campaign Performance dashboard: Conversions, Cost per acquisition, Conversion rate and CTR tiles.
    Sample data

    PPC campaign dashboard

    Which campaigns worked, across every platform, measured the same way?
    • Conversions
    • Cost per acquisition
    • Conversion rate
    • CTR
    Use template
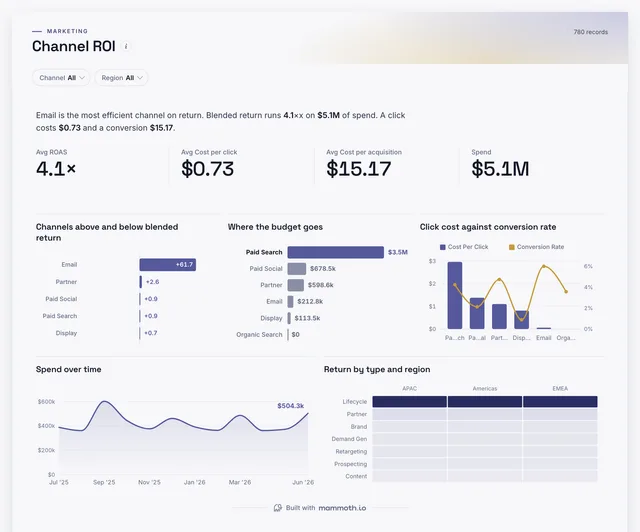
  4. Channel ROI dashboard: ROAS, Cost per click, Cost per acquisition and Spend tiles.
    Sample data

    PPC ROI dashboard

    Which paid channel pays back what it costs, week after week?

    • ROAS
    • Cost per click
    • Cost per acquisition
    • Spend
    Use template

Definition

What a PPC dashboard is

A PPC dashboard is one screen that shows what paid advertising costs and what it brings back: spend, clicks, conversions, conversion value, cost per conversion and return on ad spend, by day, campaign and platform. Each ad platform reports in its own account and credits itself with every sale it touched, so a useful PPC dashboard puts the platforms side by side with one definition of a conversion.

  • Spend against return

    Cost beside the value it brought back.

  • One platform each

    Google, Meta and LinkedIn, each read its own way.

  • All of them compared

    One definition of a conversion across every channel.

The metrics

The metrics a PPC dashboard is built from

Eight numbers. Most are ratios, so check both halves come from the same dates and campaigns.

  • Spend

    How much did the ads cost?

    What the data needs

    Cost by day and campaign from each platform, in one currency.

  • Return on ad spend

    How much came back for each dollar spent?

    What the data needs

    Conversion value over spend for the same dates. Each platform credits itself, so the platforms' returns add up to more than you sold.

  • Cost per conversion

    What does one sale or sign-up cost?

    What the data needs

    Spend over conversions, with the conversion defined once across platforms.

  • Cost per lead

    What does one lead cost?

    What the data needs

    Spend over leads, for lead-generation campaigns such as LinkedIn's. Read it beside lead quality from the CRM.

  • Conversion rate

    What share of clicks turned into a conversion?

    What the data needs

    Conversions over clicks for the same campaigns. A drop usually points at the landing page, not the ad.

  • Click-through rate

    Do people click when they see the ad?

    What the data needs

    Clicks over impressions by campaign or ad. Compare within a platform, since search and social run at very different rates.

  • Cost per click

    What does each visit cost?

    What the data needs

    Spend over clicks. It rises with competition for the same keywords or audiences.

  • Impression share

    How much of the available search traffic did the ads win?

    What the data needs

    Impression share from Google Ads by campaign. A low share with a good return says the budget is the limit.

How to build one

How to build your own PPC dashboard

From one of the examples above to a live dashboard on your own data.

  1. 1

    Pick a template

    Start from any of the five boards above.

  2. 2

    Add your data

    Upload a spreadsheet, or connect one of 100+ tested connectors.

  3. 3

    Clean it once

    Fix and combine your data once. Mammoth repeats those steps for you.

  4. 4

    Set it to refresh

    The dashboard updates on a schedule and flags data that fails a check.

  5. 5

    Share the link

    Public, password-protected or sign-in only, on every plan.

Start with a template

14-day Pro trial · No credit card

FAQ

PPC dashboard questions

Last reviewed against the template catalogue.

What should a PPC dashboard include?
Spend, conversions, conversion value, return on ad spend, cost per conversion and click-through rate at the top. Then spend against value over time, and the same numbers by campaign. Add a view across platforms once you run ads in more than one.
What KPIs should a PPC dashboard track?
Return on ad spend, cost per conversion or per lead, conversion rate, click-through rate, cost per click and impression share are the core. The list below shows each one with the data it needs.
How do I build a PPC dashboard?
Start with the question the weekly ads review has to answer. Then follow five steps.
  1. Connect Google Ads and Meta Ads, or export a campaign report from each platform.
  2. Agree one definition of a conversion, because each platform counts its own.
  3. Name campaigns the same way across platforms, so they can be grouped.
  4. Put spend beside value, never clicks on their own.
  5. Share the link with the team or client instead of a weekly screenshot.
Does Mammoth connect to Google Ads and Meta Ads?
Yes. Google Ads and Meta Ads connect directly, so those boards refresh on their own. LinkedIn Ads reads a Campaign Manager export: upload it, and upload the next one to update the dashboard. PPC report template
What is a good ROAS?
It depends on your margin. A return of 3 on a product with a 20% margin loses money, while the same return on software can be very profitable. Work out the return you need to break even, then compare each campaign with that rather than with an industry average.
Can a client or the whole team see it?
Yes. Dashboard viewers are unlimited and free on every Mammoth plan, including the free one, so a client or the whole marketing team can open it. Only the people building the dashboards count as platform users.

Build the PPC dashboard you actually need.

Start from one of these templates or your own spreadsheet. Share it with as many people as you like, free.

  • ✓ 14-day Pro trial
  • ✓ No credit card
  • ✓ Viewers always free