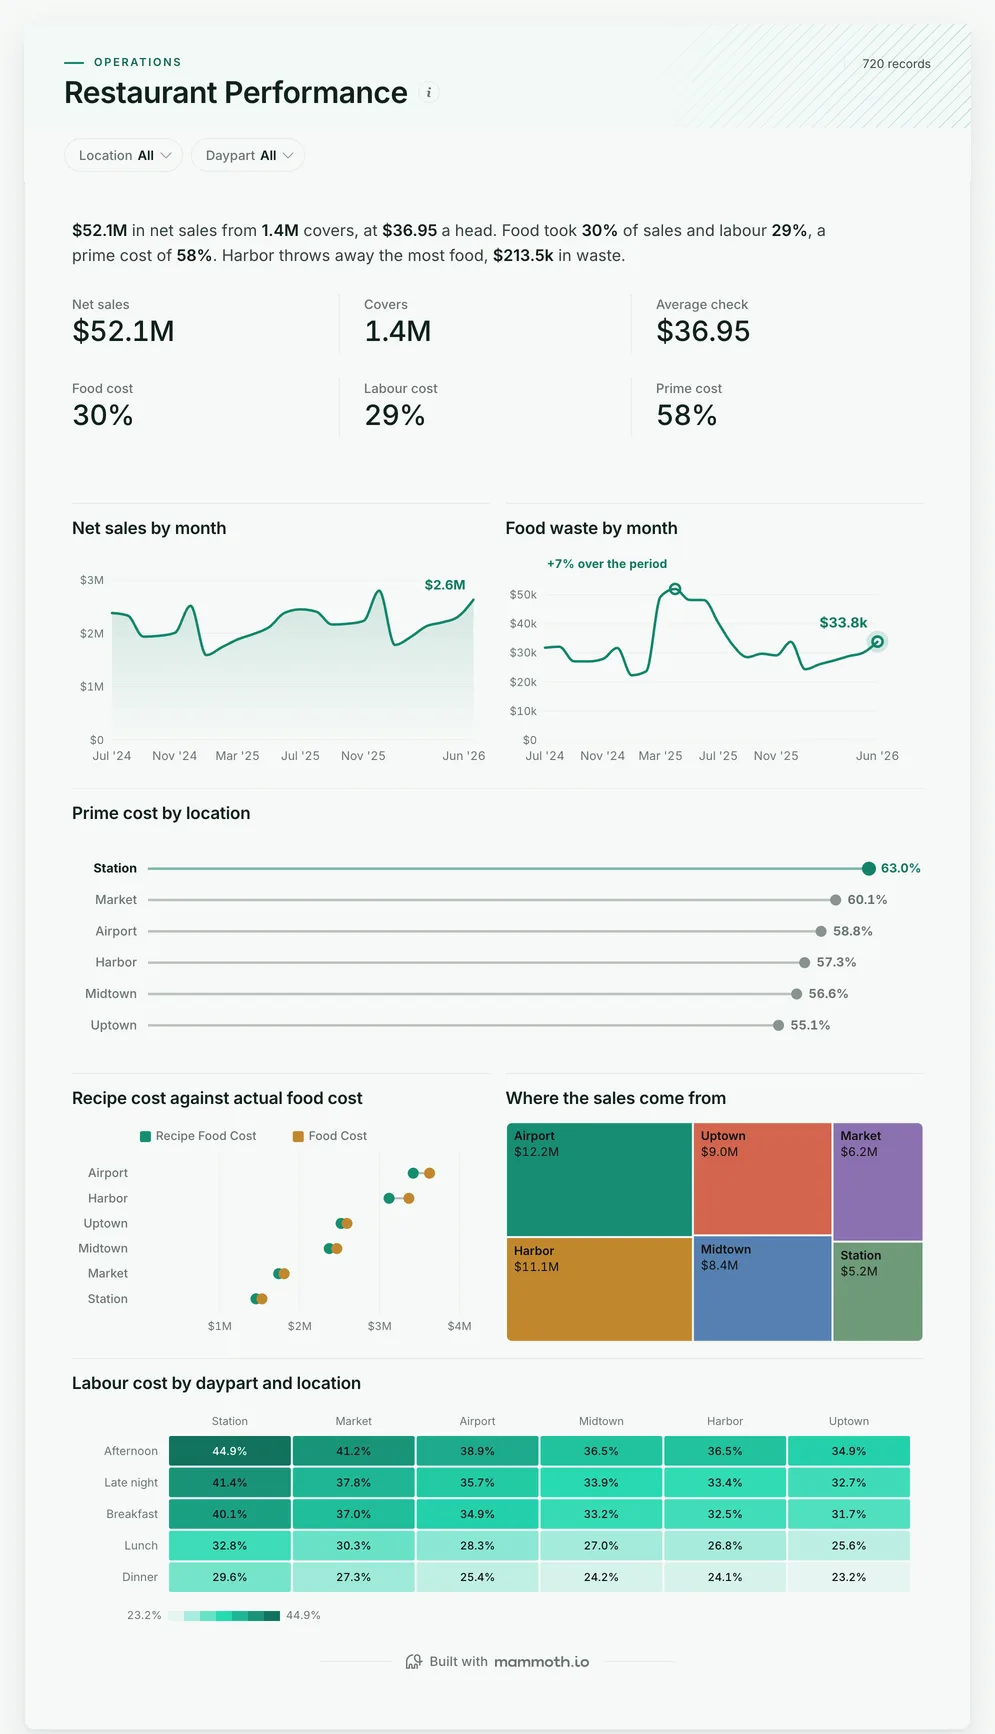
Restaurant dashboard
Are we busy, and where do food and labour costs run away?
- Net sales
- Covers
- Average check
- Food cost
Restaurant dashboards
Four dashboards for a restaurant or group: sales, covers and prime cost by location with food waste and labour by daypart, how each site compares with last year, how much depends on a few suppliers, and how fast staff turn over. Open any of them to see it in full, then use it as a template for your own data.
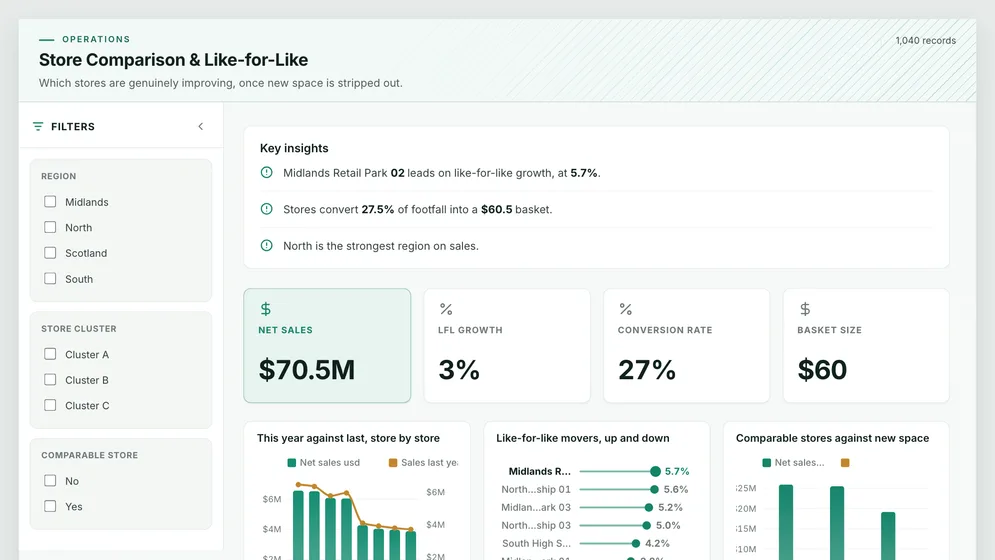
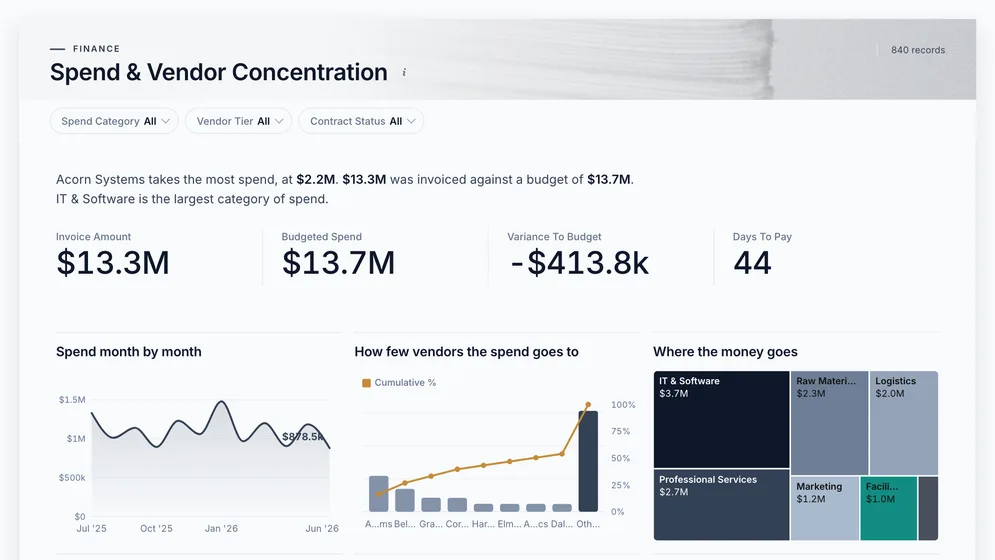
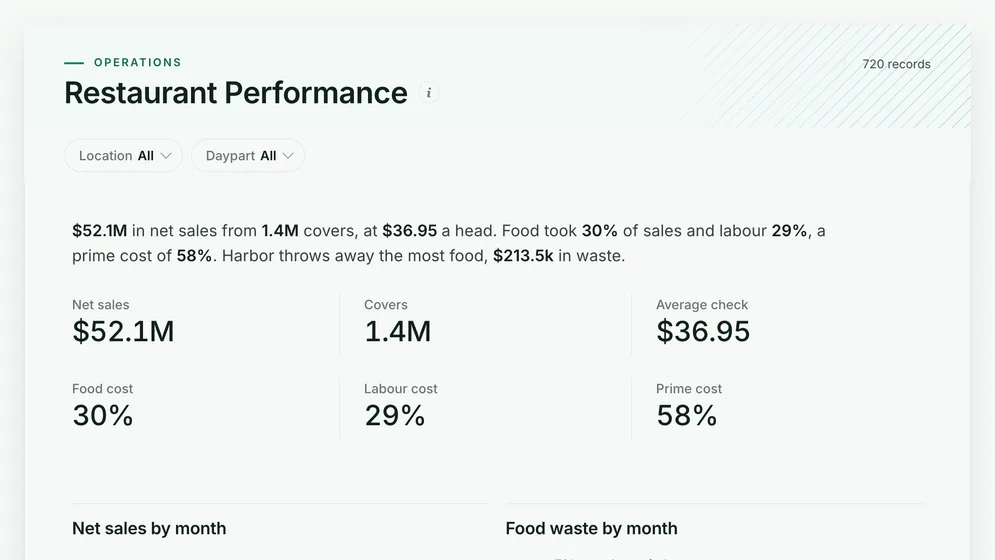
Three of the four examples. All figures are sample data.
The examples
Click a board to see all of it. Click Use template to start your own copy in Mammoth. All figures are sample data.
Are we busy, and where do food and labour costs run away?
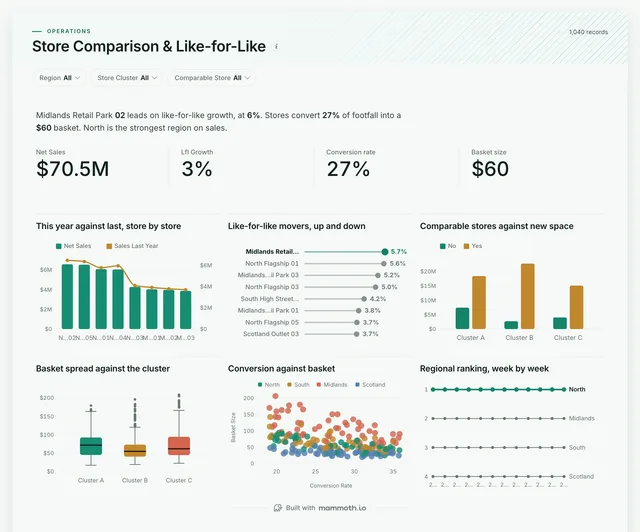
Which locations are growing, and which are slipping?
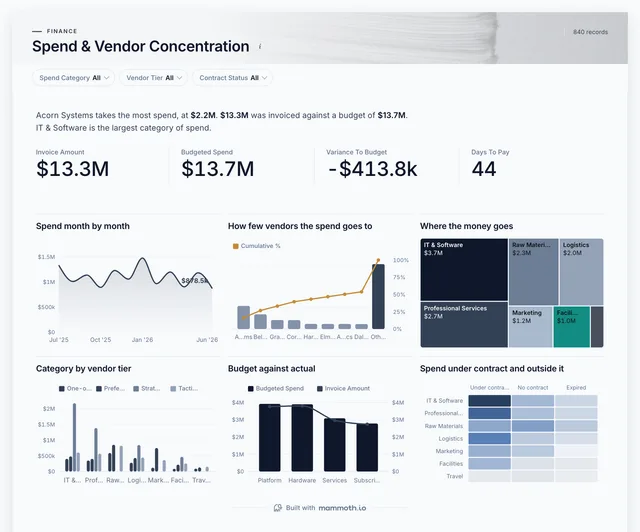
How much depends on one supplier?
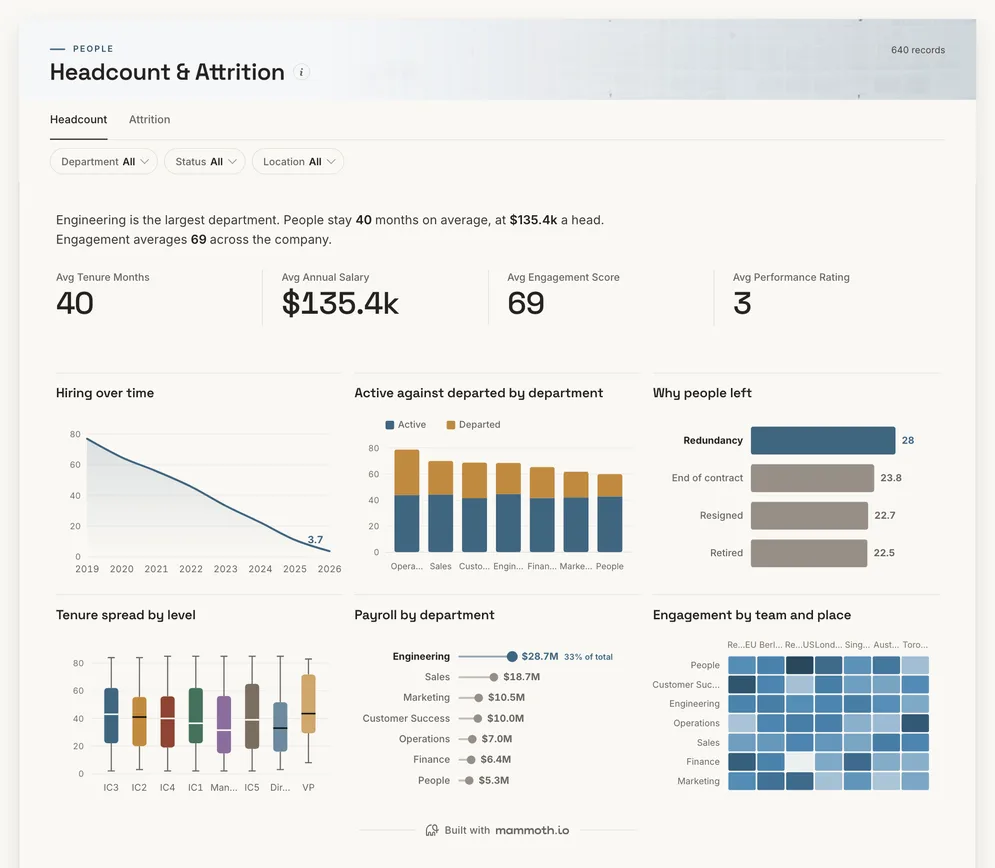
How fast are front and back of house turning over?
Definition
A restaurant dashboard is one screen that shows how a restaurant or group is trading: net sales, covers and the average check, food and labour cost as a share of sales, waste, and how each location compares. The data usually comes from the point of sale, purchasing or inventory, and the rota or payroll.
Food and labour as a share of sales, site by site.
The kitchen using more than the recipe says.
Sales, purchasing and rota exports you already have.
The metrics
Eight numbers. Most depend on a definition agreed first, such as what counts as a cover or which costs sit in labour.
How much did we take?
Sales after discounts and voids, before tax, by location and day from the point of sale.
How many guests did we serve?
Guest counts per check. Takeaway orders need a rule, or a delivery-heavy site looks quiet.
How much does each guest spend?
Net sales divided by covers, by daypart. Lunch and dinner checks are different businesses.
What share of sales goes on food?
Food used, from purchases adjusted for stock or from stock counts, against food sales.
What share of sales goes on staff?
Wages, overtime and employer costs from payroll, by location and daypart.
How much of each sale do food and labour take?
Food cost plus labour cost against sales, for the same location and period.
Is the kitchen using more than the recipe?
Recipe cost of what was sold against actual food used. A gap is waste, portioning or loss.
How much food is thrown away?
Waste logged by value and reason. A site that never logs waste is not a site without waste.
How to build one
From one of the examples above to a live dashboard on your own data.
Start from any of the four boards above.
Upload a spreadsheet, or connect one of 100+ tested connectors.
Fix and combine your data once. Mammoth repeats those steps for you.
The dashboard updates on a schedule and flags data that fails a check.
Public, password-protected or sign-in only, on every plan.
14-day Pro trial · No credit card
FAQ
Last reviewed against the template catalogue.
Start from one of these templates or your own spreadsheet. Share it with as many people as you like, free.
More dashboard examples


