Skip to content

Procurement dashboards

Procurement dashboard examples

Four dashboards for a procurement team: orders, cycle time, supplier delivery, savings and contract coverage, how much depends on a few suppliers, spend against budget by cost centre, and what needs reordering now. Open any of them to see it in full, then use it as a template for your own data.
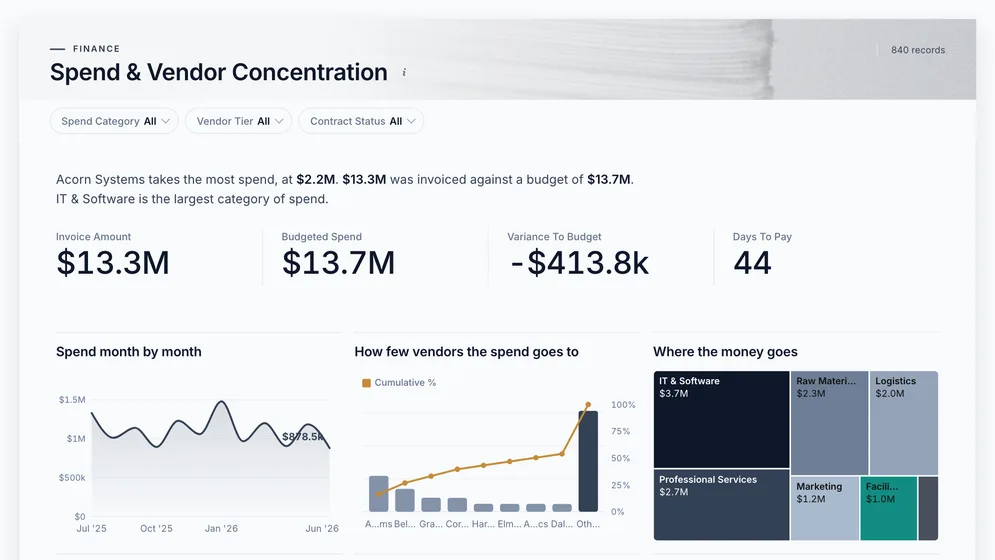
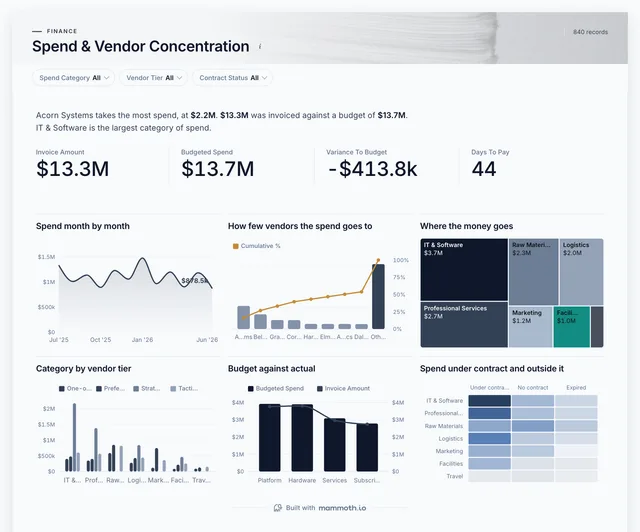
Spend & Vendor Concentration dashboard: Invoice Amount, Budgeted Spend, Variance To Budget and Days To Pay tiles.
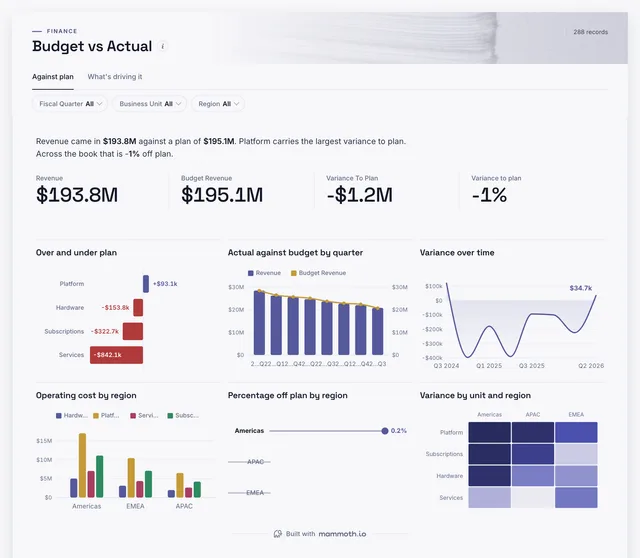
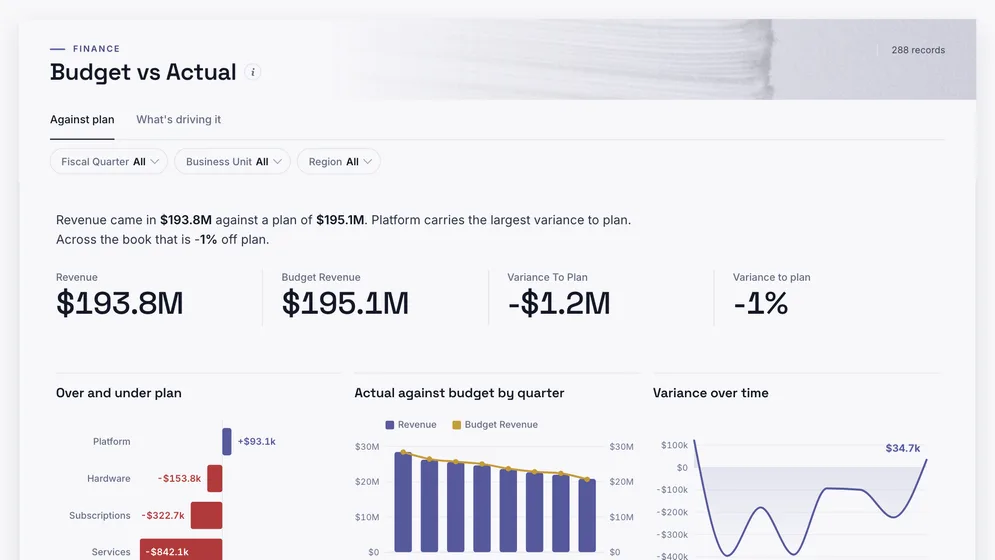
Budget vs Actual dashboard: Revenue, Budget Revenue and Variance To Plan tiles, above Over and under plan.
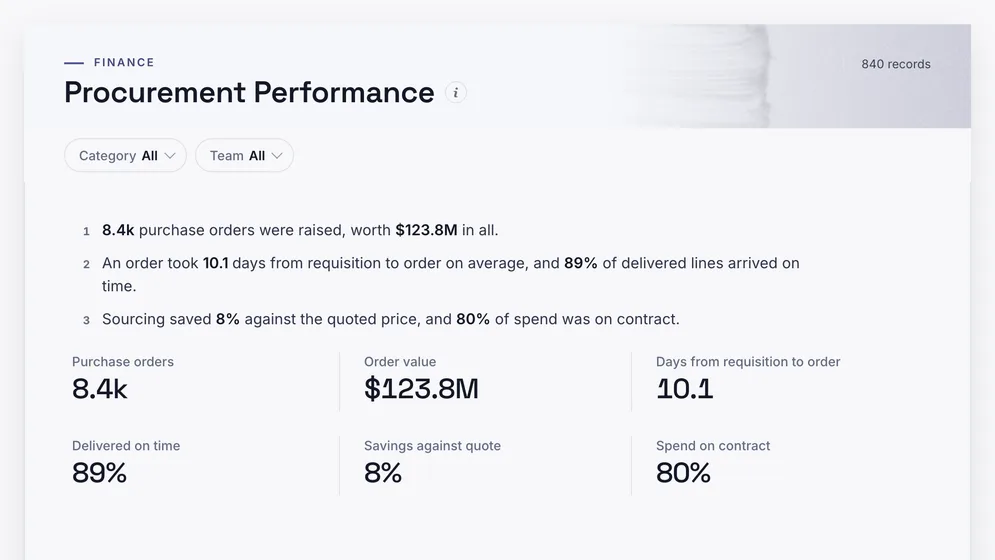
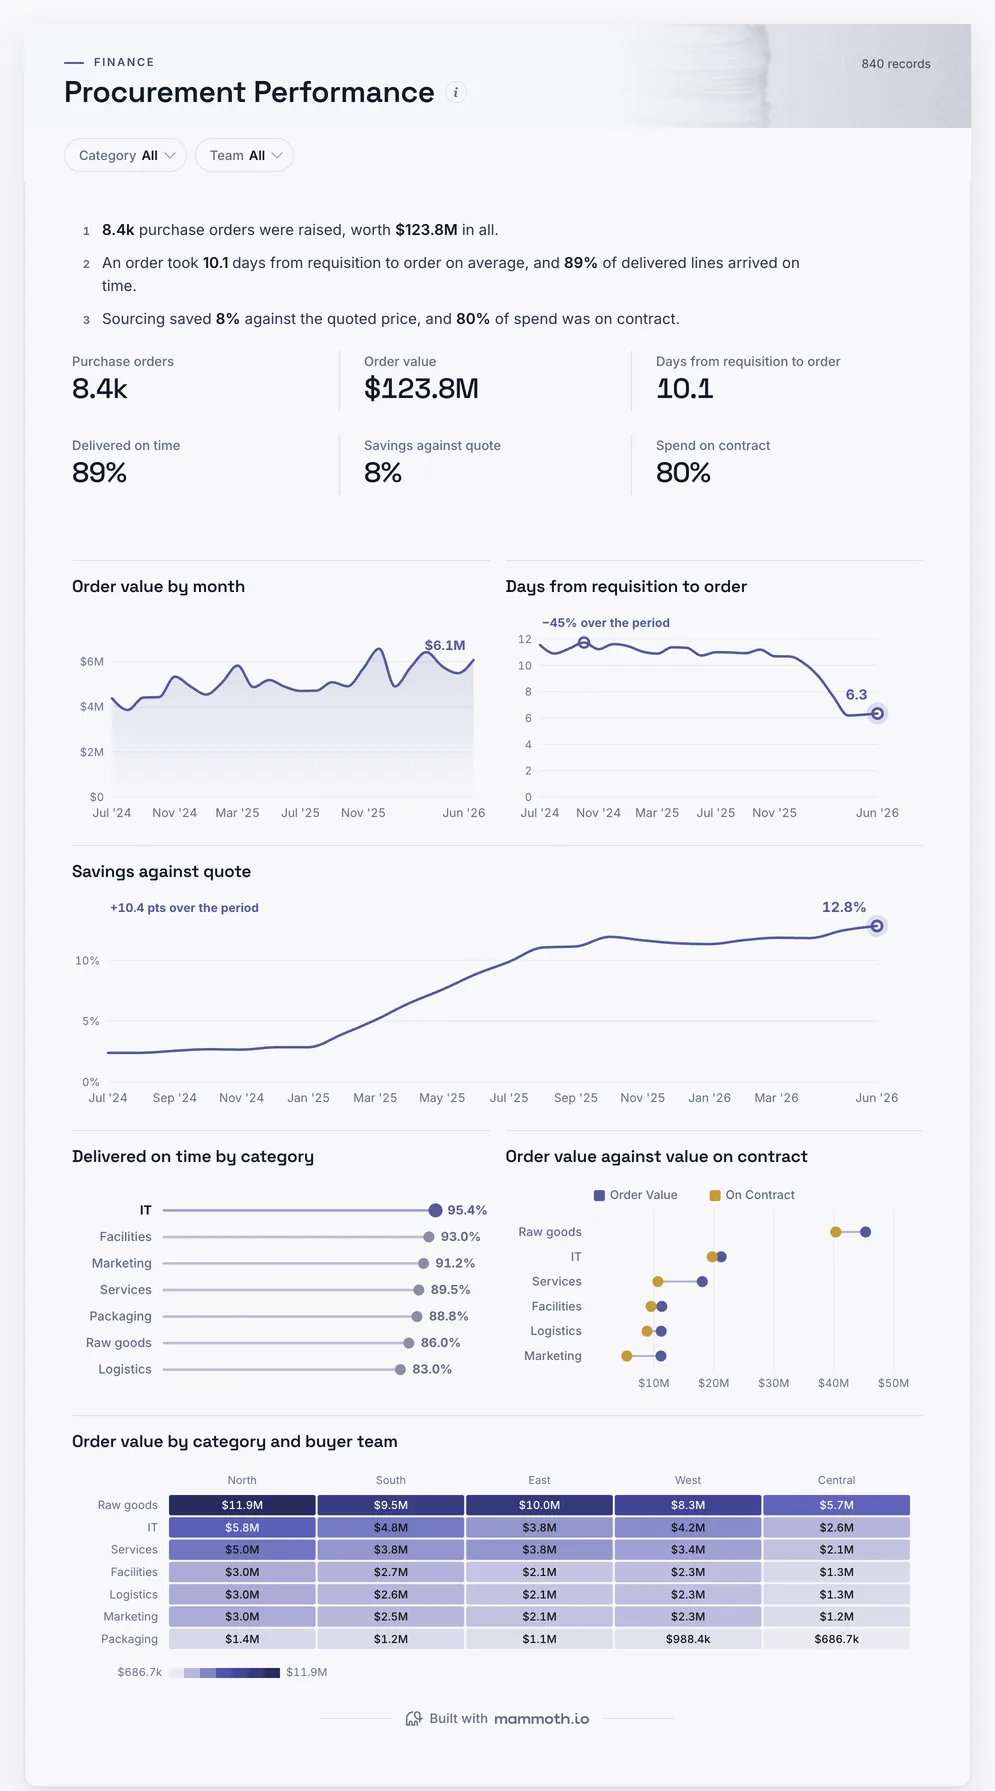
Procurement Performance dashboard: Purchase orders, Order value, Days from requisition to order and Delivered on time tiles.

Three of the four examples. All figures are sample data.

The examples

Four procurement dashboard examples and templates

Click a board to see all of it. Click Use template to start your own copy in Mammoth. All figures are sample data.

  1. Procurement Performance dashboard: Purchase orders, Order value, Days from requisition to order and Delivered on time tiles.
    Sample data

    Procurement dashboard

    How fast do orders go through, and do suppliers deliver?
    • Purchase orders
    • Order value
    • Days from requisition to order
    • Delivered on time
    Use template
  2. Spend & Vendor Concentration dashboard: Invoice Amount, Budgeted Spend, Variance To Budget and Days To Pay tiles.
    Sample data

    Spend analysis dashboard

    How much depends on a few suppliers?

    • Invoice amount
    • Budgeted spend
    • Variance to budget
    • Days to pay
    Use template
  3. Budget vs Actual dashboard: Revenue, Budget Revenue and Variance To Plan tiles, above Over and under plan.
    Sample data

    Procurement budget dashboard

    Is each cost centre buying to budget?
    • Revenue
    • Budget revenue
    • Variance to plan
    Use template
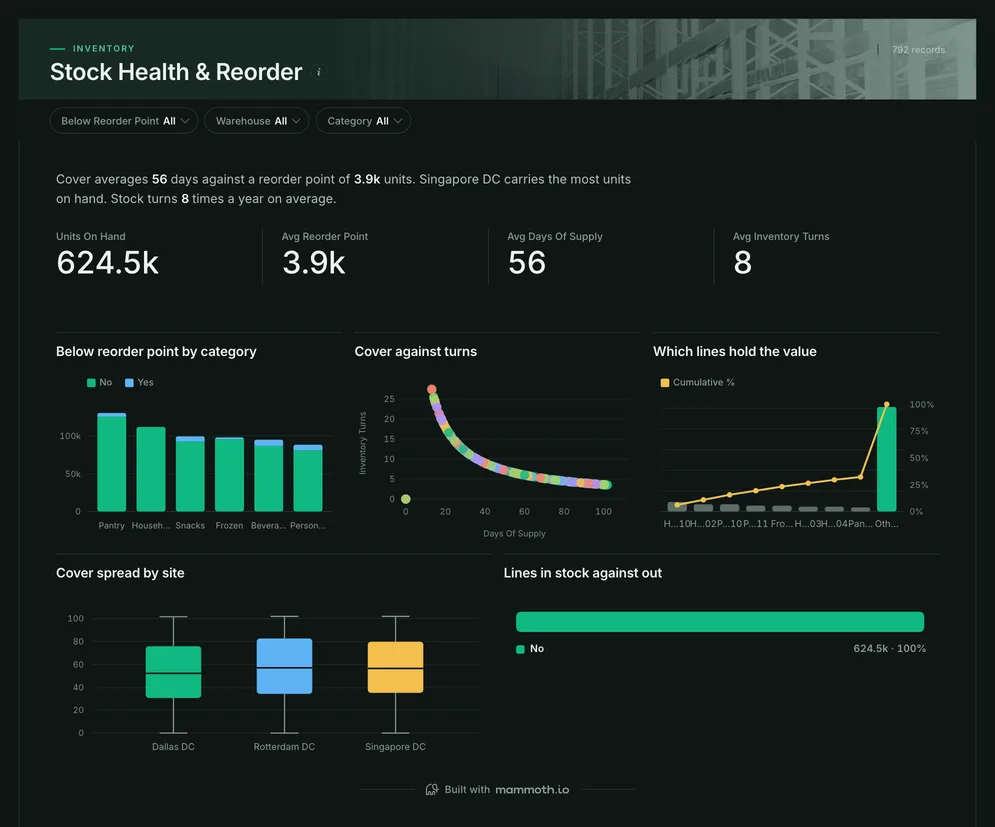
  4. Stock Health & Reorder dashboard: Units On Hand, Reorder Point, Days Of Supply and Inventory Turns tiles.
    Sample data

    Purchasing and reorder dashboard

    What needs ordering now?

    • Units on hand
    • Reorder point
    • Days of supply
    • Inventory turns
    Use template

Definition

What a procurement dashboard is

A procurement dashboard is one screen that shows how well the business buys: purchase orders and their value, how long an order takes from requisition, whether suppliers deliver on time, what sourcing saved against the quoted price, and how much spend sits on contract. The data usually comes from the ERP or purchasing system, supplier invoices and the contract register.

  • Cycle time

    Days from requisition to purchase order.

  • Supplier delivery

    On time by category, every month.

  • On contract

    How much is bought off agreed terms.

The metrics

The metrics a procurement dashboard is built from

Eight numbers. Most depend on a definition agreed first, such as what savings is measured against.

  • Purchase orders

    How much are we buying?

    What the data needs

    Orders raised and their value by category, supplier, buyer team and month.

  • Cycle time

    How long does an order take?

    What the data needs

    Days from requisition to purchase order, with the approval date between them.

  • On-time delivery

    Do suppliers deliver when they promised?

    What the data needs

    Promised and actual delivery dates per order line, from goods receipts.

  • Savings

    What did sourcing save?

    What the data needs

    Agreed price against the first quote, the last price paid or the budget. Pick one and keep it.

  • Spend on contract

    How much is bought on agreed terms?

    What the data needs

    Each order matched to the contract register by supplier and category.

  • Supplier concentration

    How much depends on a few suppliers?

    What the data needs

    Share of spend with the top suppliers in each category, from invoices.

  • Maverick spend

    How much bypasses the process?

    What the data needs

    Invoices with no purchase order, or paid to suppliers outside the approved list.

  • Invoice accuracy

    Do invoices match what was ordered?

    What the data needs

    Invoices matched to order and receipt. Mismatches hold up payment and supplier goodwill.

How to build one

How to build your own procurement dashboard

From one of the examples above to a live dashboard on your own data.

  1. 1

    Pick a template

    Start from any of the four boards above.

  2. 2

    Add your data

    Upload a spreadsheet, or connect one of 100+ tested connectors.

  3. 3

    Clean it once

    Fix and combine your data once. Mammoth repeats those steps for you.

  4. 4

    Set it to refresh

    The dashboard updates on a schedule and flags data that fails a check.

  5. 5

    Share the link

    Public, password-protected or sign-in only, on every plan.

Start with a template

14-day Pro trial · No credit card

FAQ

Procurement dashboard questions

Last reviewed against the template catalogue.

What should a procurement dashboard show?
Whether buying is fast, reliable and on good terms. That means order volume and value, cycle time, supplier on-time delivery, savings and spend on contract, by category and team. The boards above cover those, with spend concentration and reordering beside them.
What procurement KPIs should we track?
Purchase order cycle time, supplier on-time delivery, savings against quote or budget, spend under management, contract coverage and supplier concentration are the core. The list below shows each one with the data it needs.
How do I build a procurement dashboard?
Start with the savings and compliance numbers the finance review already asks for. Then follow five steps.
  1. Export purchase orders with requisition, approval and order dates, category, supplier and buyer team.
  2. Add goods receipts with promised and actual delivery dates.
  3. Add the contract register so each order can be marked on or off contract.
  4. Agree what savings means: against the first quote, last price paid or budget.
  5. Refresh weekly, with a view for each category manager.
What is spend under management?
The share of total spend that goes through procurement on agreed terms, usually a contract or a catalogue. Spend outside it is where prices drift and suppliers multiply, so it is the number most programmes try to raise first.
Where does procurement data come from?
Usually an ERP or purchasing system such as NetSuite, SAP or Coupa, supplier invoices from accounts payable, and a contract register that is often a spreadsheet. Mammoth has 100+ tested connectors, and can also connect to anything with a REST API. You combine the sources once, and Mammoth repeats the same steps on every refresh.
Can budget holders see it without a licence?
Yes. Dashboard viewers are unlimited and free on every Mammoth plan, including the free one, so every budget holder and category manager can open it at no per-viewer cost. Only the people building the dashboards count as platform users.

Build the procurement dashboard you actually need.

Start from one of these templates or your own spreadsheet. Share it with as many people as you like, free.

  • ✓ 14-day Pro trial
  • ✓ No credit card
  • ✓ Viewers always free