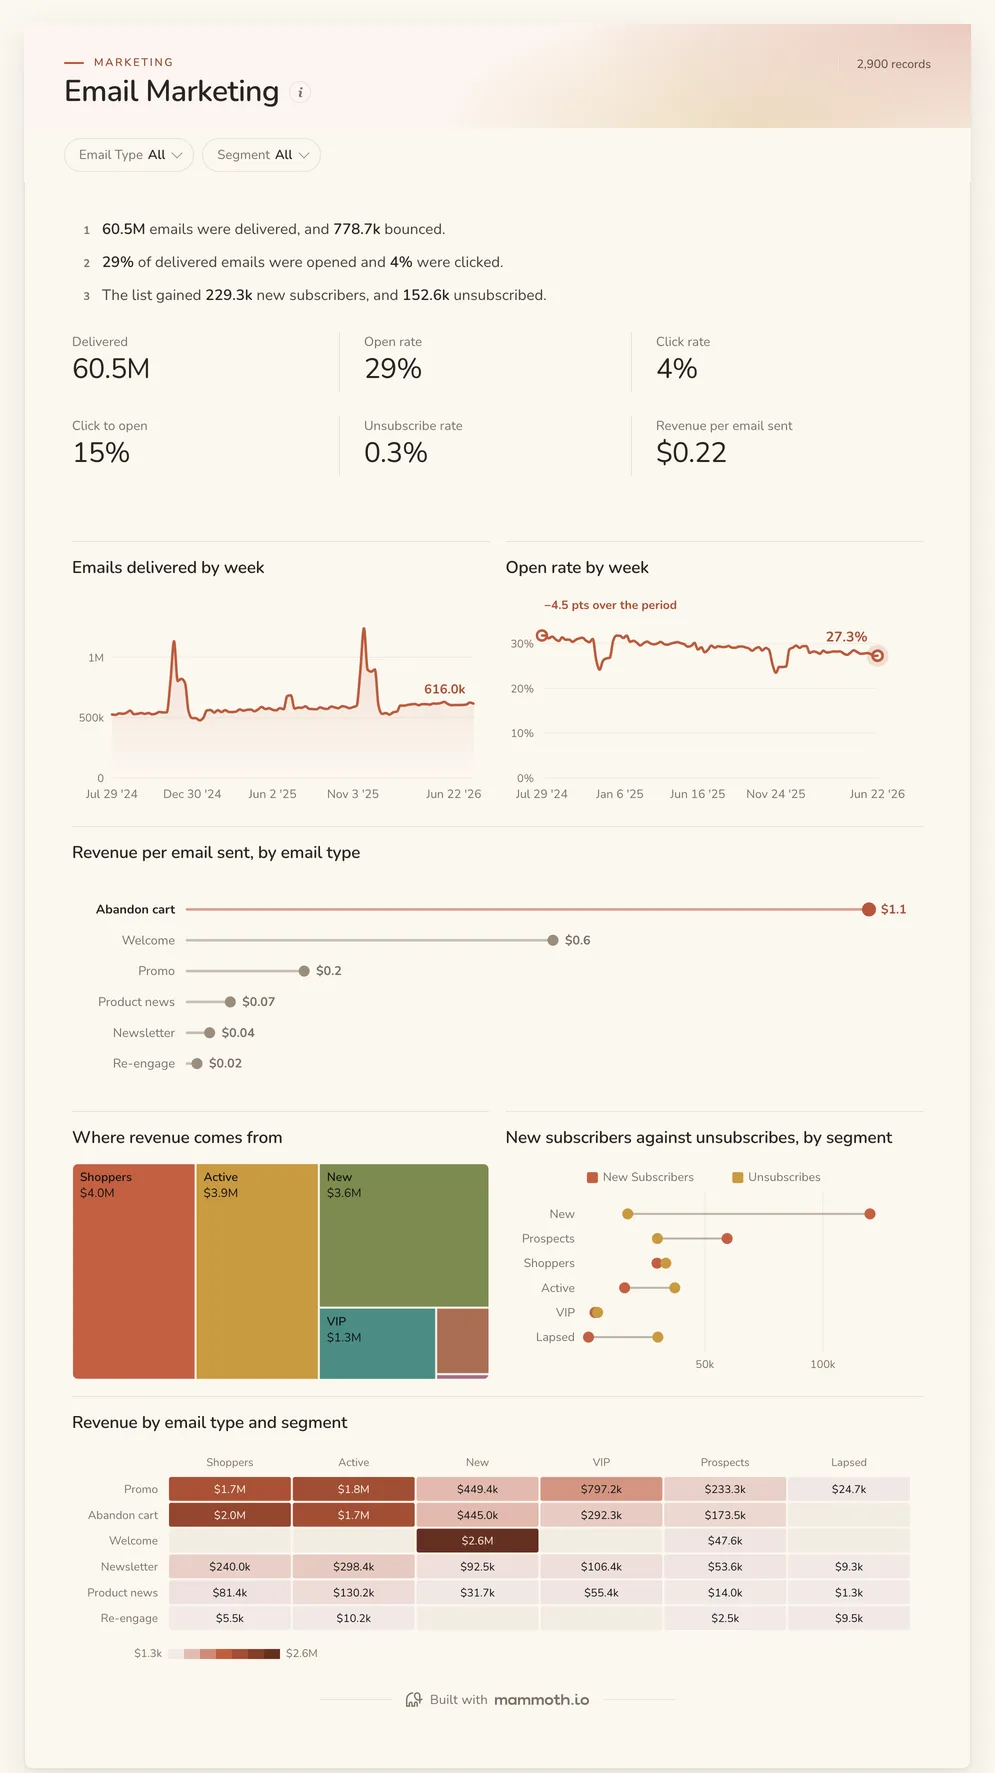
Email marketing dashboard
Are people opening, and which emails earn their keep?
- Delivered
- Open rate
- Click rate
- Click to open
Email marketing dashboards
Four dashboards for an email or lifecycle team: delivery, opens, clicks, unsubscribes and revenue by email type and segment, campaigns side by side, email's return against paid channels, and where email sits in the weekly numbers. Open any of them to see it in full, then use it as a template for your own data.
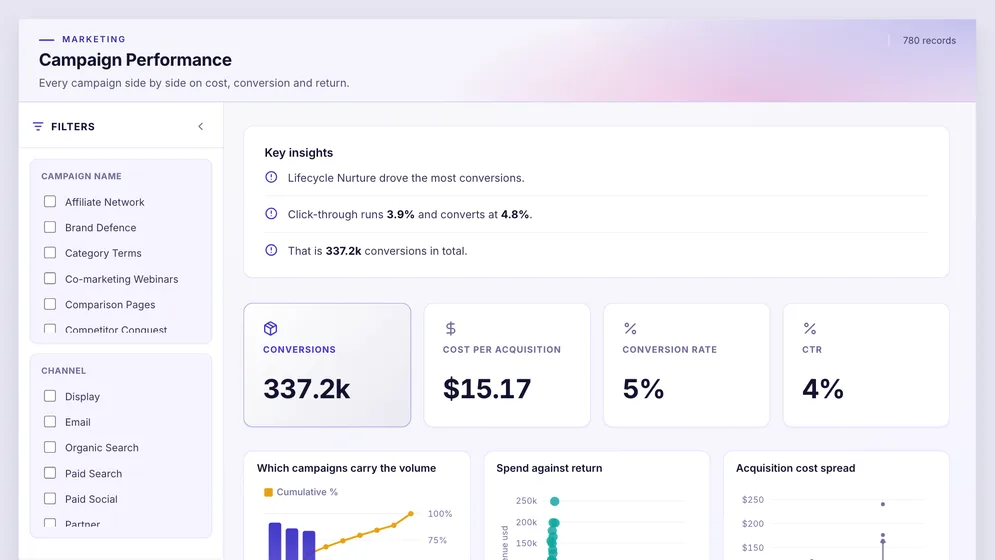
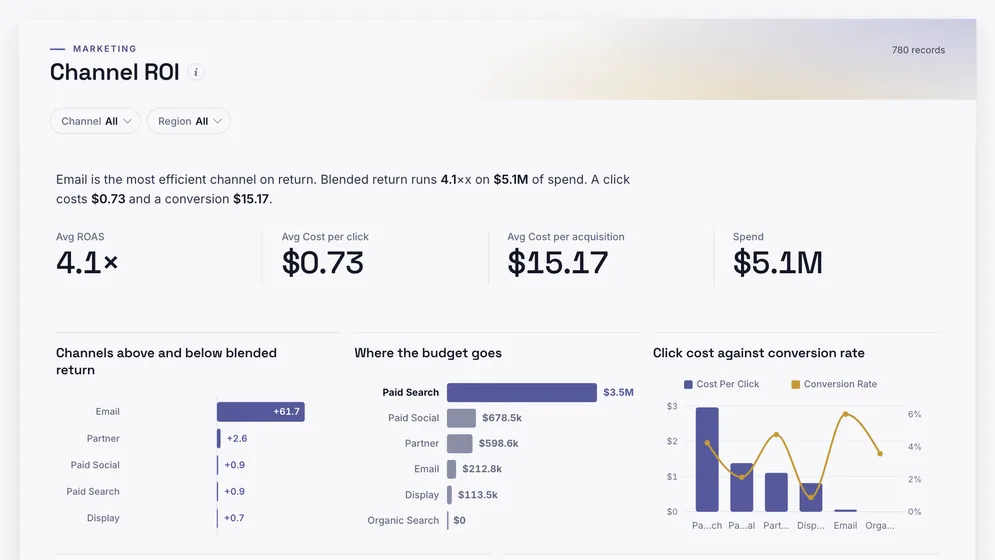
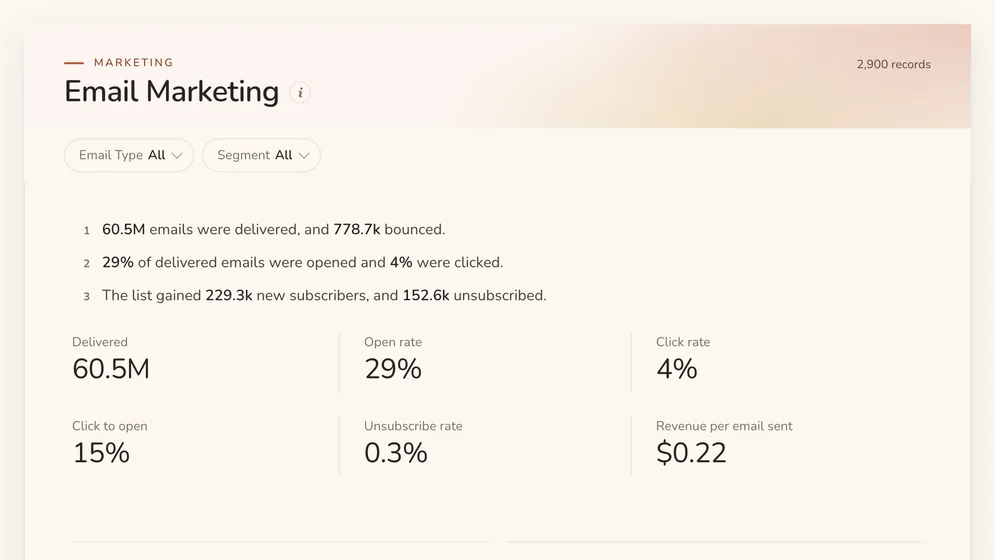
Three of the four examples. All figures are sample data.
The examples
Click a board to see all of it. Click Use template to start your own copy in Mammoth. All figures are sample data.
Are people opening, and which emails earn their keep?
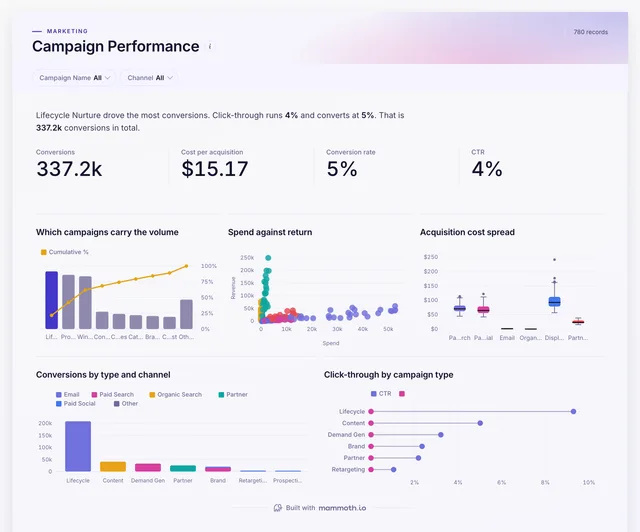
Which campaigns convert, across email and the rest?
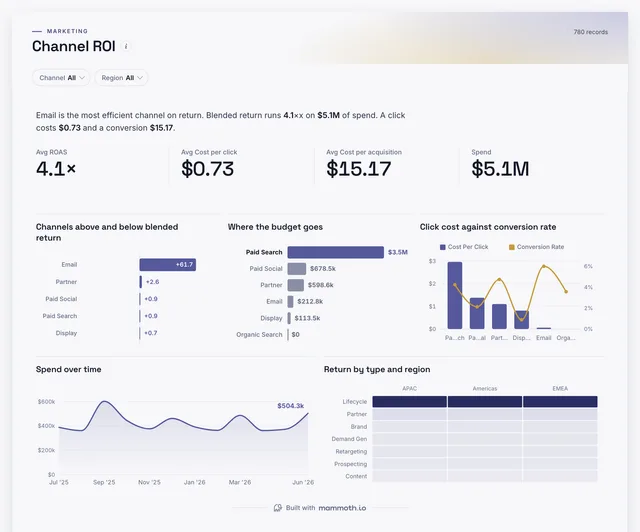
What does email return against paid channels?
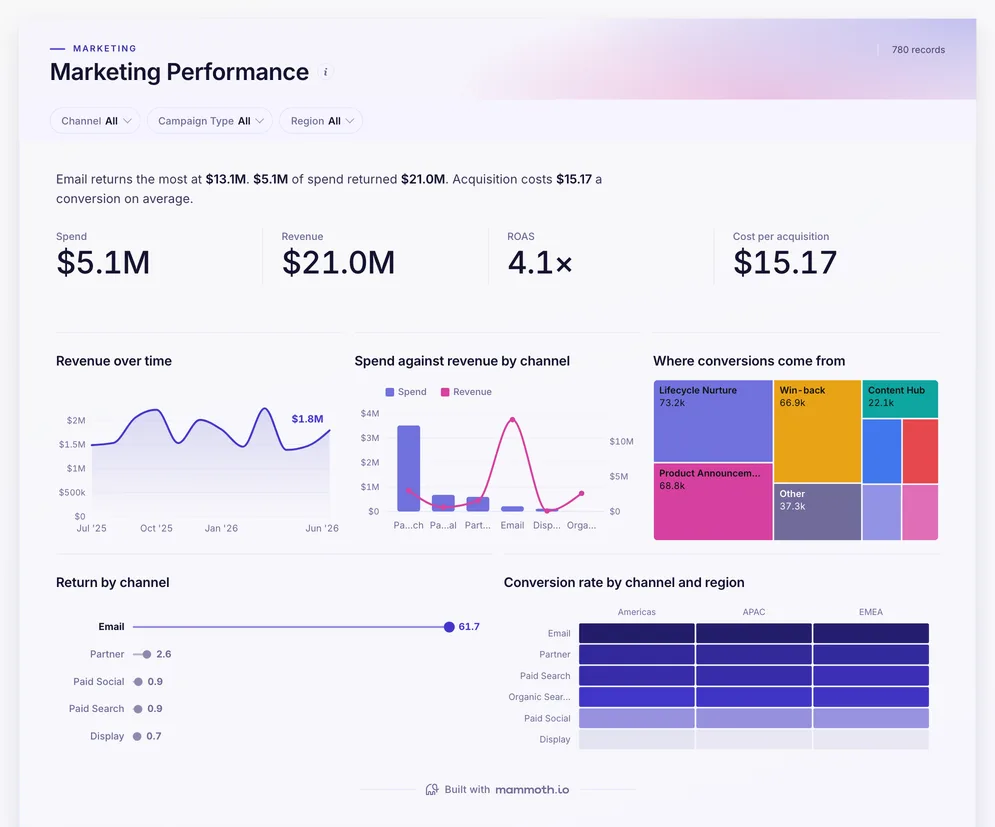
How does email sit in the weekly marketing numbers?
Definition
An email marketing dashboard is one screen that shows whether email is reaching people and earning money: emails delivered, bounce, open, click and unsubscribe rates, list growth, and revenue per email sent, by email type and segment. The data usually comes from the email platform, the store or CRM for revenue, and analytics.
The fair way to compare sends.
Who opens, who clicks, who leaves.
New subscribers against unsubscribes.
The metrics
Eight numbers. Most depend on a definition agreed first, such as how long after a click a sale still counts.
How many emails arrived?
Sends less hard and soft bounces, by campaign and segment.
How many people opened?
Unique opens against delivered. Treat it as directional: privacy features open emails automatically.
How many people clicked?
Unique clicks against delivered, by email type and segment.
Did the content work for people who opened?
Unique clicks against unique opens.
Are we sending too much, or the wrong thing?
Unsubscribes against delivered, by segment and email type.
Is the list growing?
New subscribers less unsubscribes and bounces, by source and month.
Which emails earn their keep?
Revenue attributed to each send divided by emails delivered.
Is deliverability at risk?
Complaints against delivered. A rate above one in a thousand puts future sends at risk.
How to build one
From one of the examples above to a live dashboard on your own data.
Start from any of the four boards above.
Upload a spreadsheet, or connect one of 100+ tested connectors.
Fix and combine your data once. Mammoth repeats those steps for you.
The dashboard updates on a schedule and flags data that fails a check.
Public, password-protected or sign-in only, on every plan.
14-day Pro trial · No credit card
FAQ
Last reviewed against the template catalogue.
Start from one of these templates or your own spreadsheet. Share it with as many people as you like, free.
More dashboard examples


