Skip to content

Construction dashboards

Construction dashboard examples

Four dashboards for a contractor: cost, schedule, billing and safety job by job, every project's hours and budget on one page, injury rates and inspections by site, and how much rides on a few subcontractors. Open any of them to see it in full, then use it as a template for your own data.
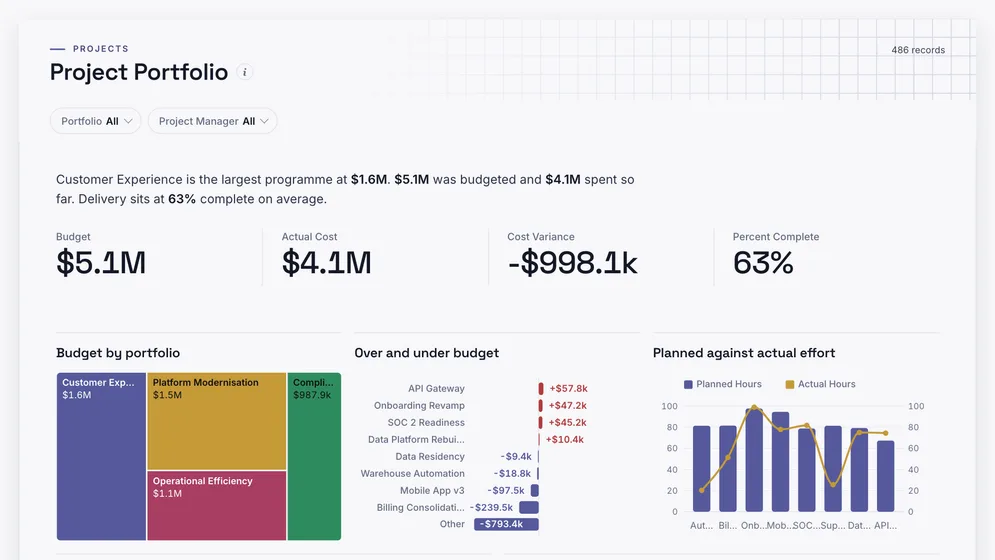
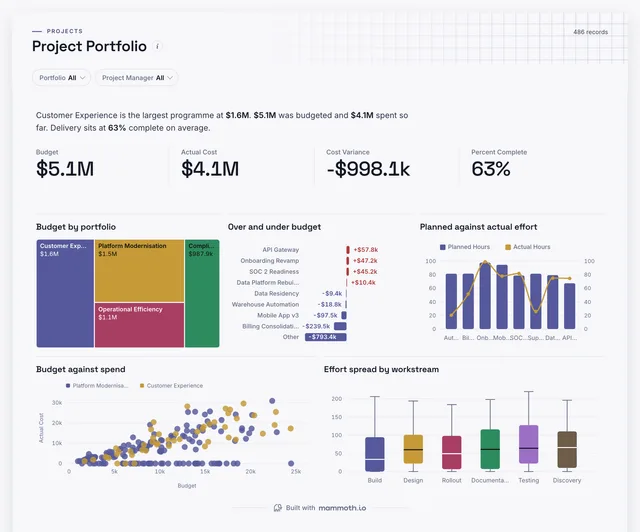
Project Portfolio dashboard: Budget, Actual Cost, Cost Variance and Percent Complete tiles, above Budget by portfolio.
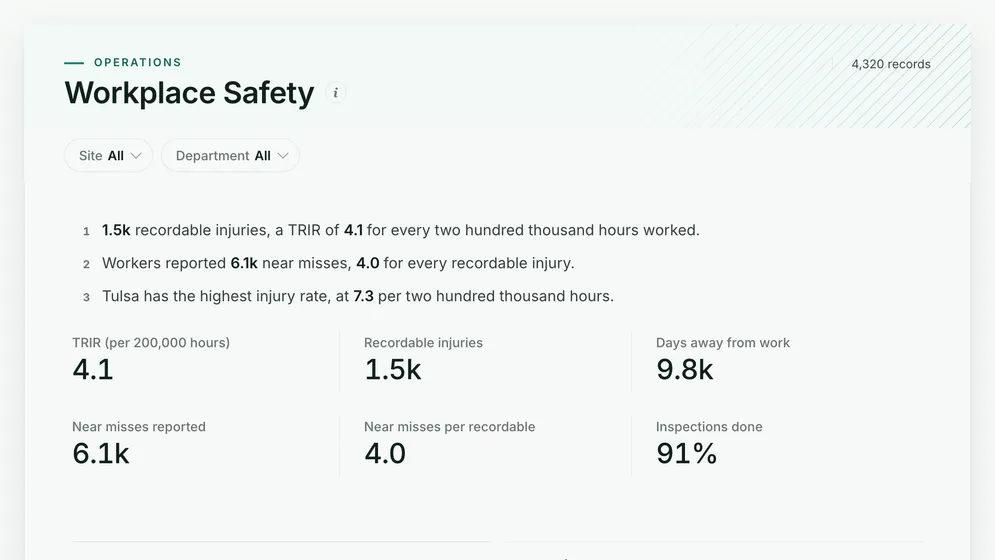
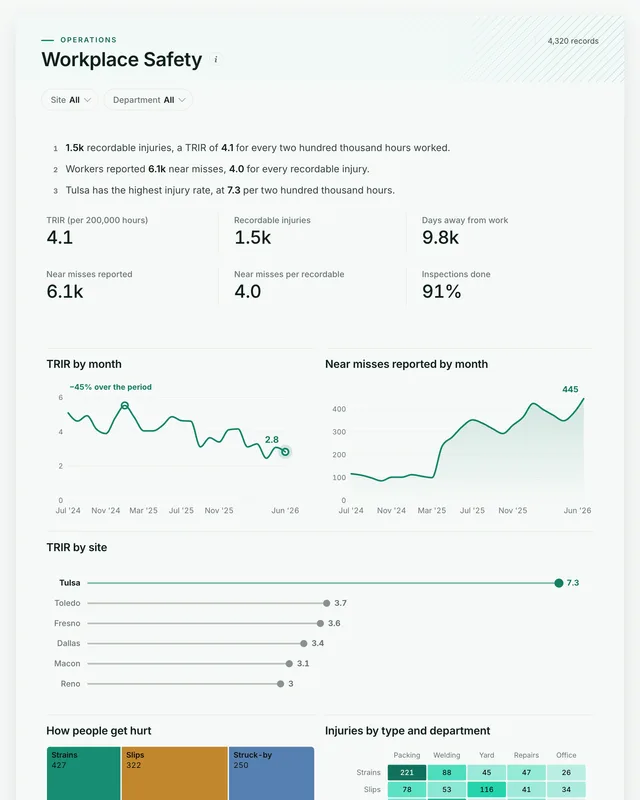
Workplace Safety dashboard: TRIR (per 200,000 hours), Recordable injuries and Days away from work tiles, above TRIR by month.
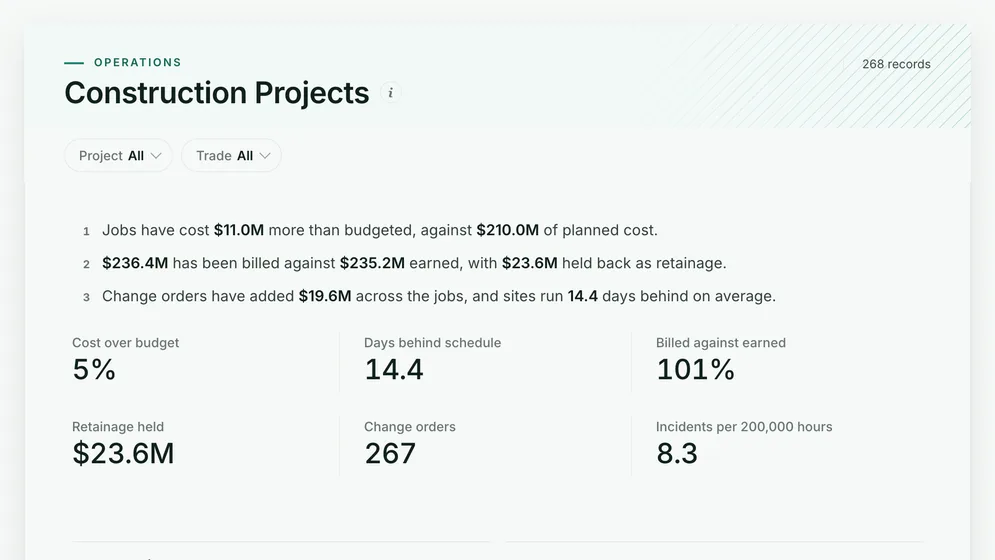
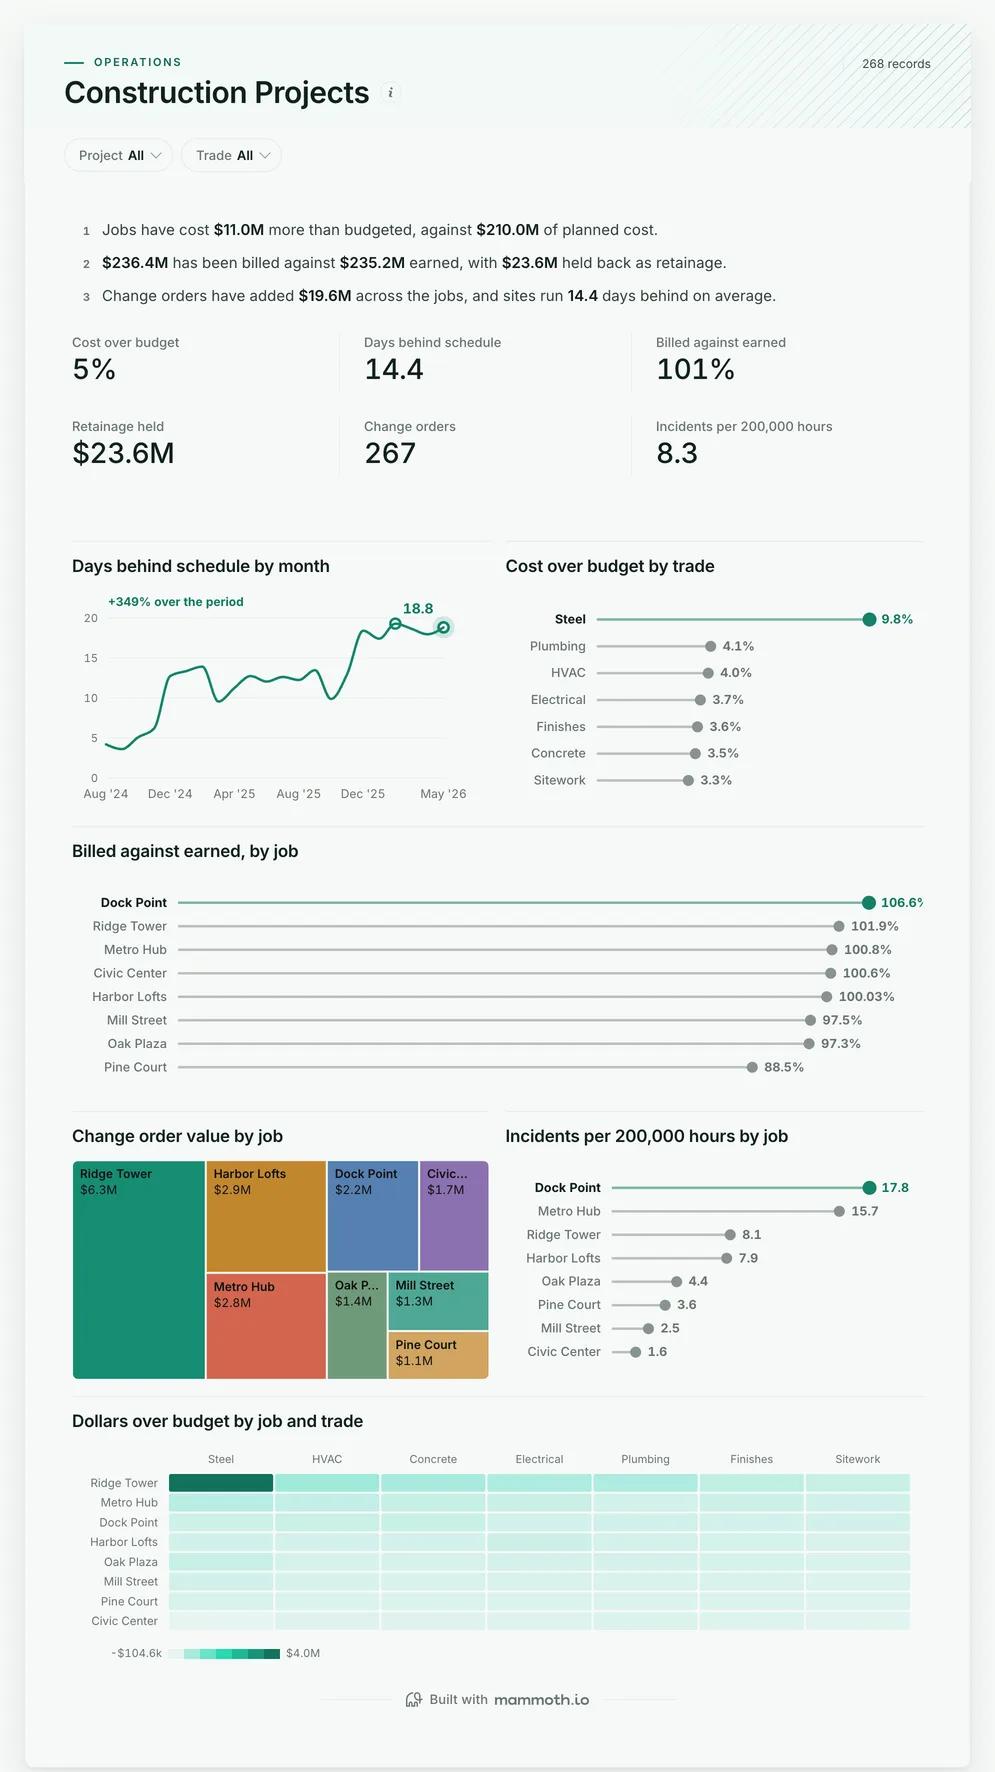
Construction Projects dashboard: Cost over budget, Days behind schedule, Billed against earned and Retainage held tiles.

Three of the four examples. All figures are sample data.

The examples

Four construction dashboard examples and templates

Click a board to see all of it. Click Use template to start your own copy in Mammoth. All figures are sample data.

  1. Construction Projects dashboard: Cost over budget, Days behind schedule, Billed against earned and Retainage held tiles.
    Sample data

    Construction dashboard

    Are our jobs on budget and on schedule?
    • Cost over budget
    • Days behind schedule
    • Billed against earned
    • Retainage held
    Use template
  2. Project Portfolio dashboard: Budget, Actual Cost, Cost Variance and Percent Complete tiles, above Budget by portfolio.
    Sample data

    Construction project portfolio dashboard

    Which jobs are running over on hours and cost?
    • Budget
    • Actual cost
    • Cost variance
    • Percent complete
    Use template
  3. Workplace Safety dashboard: TRIR (per 200,000 hours), Recordable injuries and Days away from work tiles, above TRIR by month.
    Sample data

    Construction safety dashboard

    Are our sites getting safer?

    • TRIR (per 200,000 hours)
    • Recordable injuries
    • Days away from work
    • Near misses reported
    Use template
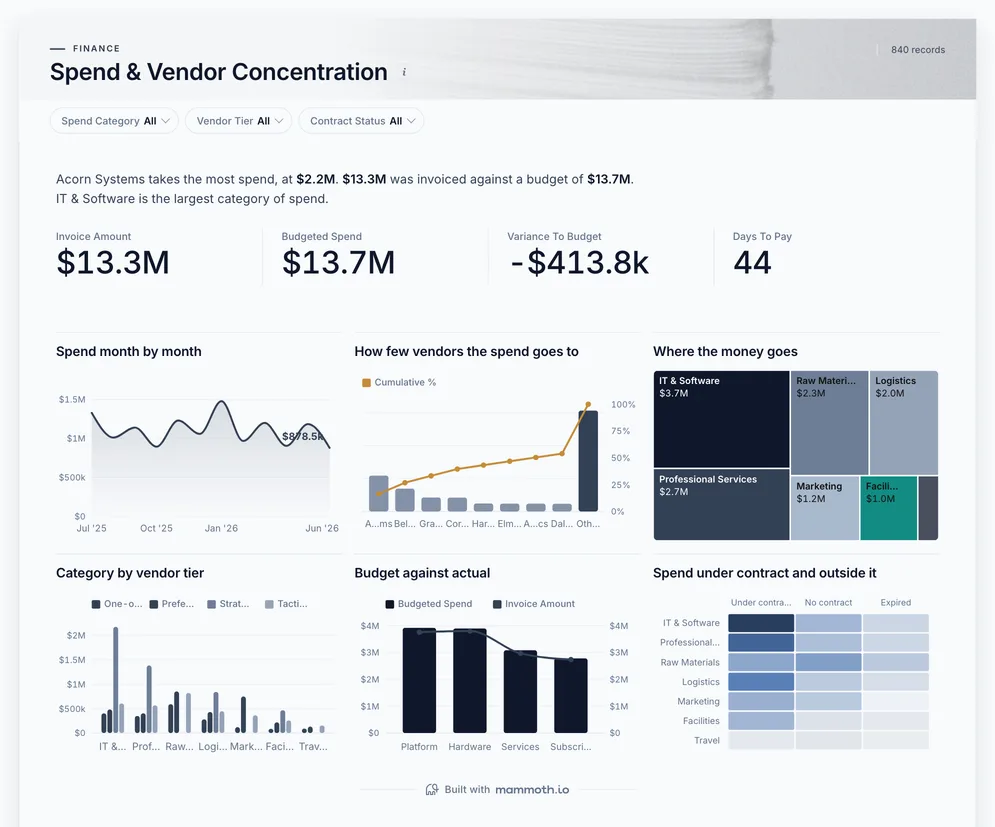
  4. Spend & Vendor Concentration dashboard: Invoice Amount, Budgeted Spend, Variance To Budget and Days To Pay tiles.
    Sample data

    Construction subcontractor spend dashboard

    How much rides on a few subcontractors and suppliers?

    • Invoice amount
    • Budgeted spend
    • Variance to budget
    • Days to pay
    Use template

Definition

What a construction dashboard is

A construction dashboard is one screen that shows whether jobs are on budget, on schedule, billed correctly and safe: cost against budget by job and trade, days behind schedule, billing against earned value, retainage held, change orders, and the incident rate. The data usually comes from job costing, the schedule, the billing system and the safety log.

  • Job by job

    Budget, schedule and billing for every project.

  • Billed against earned

    Over-billing and under-billing at a glance.

  • Safety beside cost

    Incident rate per 200,000 hours by job.

The metrics

The metrics a construction dashboard is built from

Eight numbers. Most depend on a definition agreed first, such as how percent complete is measured.

  • Cost variance

    Is each job on budget?

    What the data needs

    Actual cost against budget by job and trade, at the same percent complete.

  • Schedule variance

    Is each job on time?

    What the data needs

    Planned and actual milestone dates, as days behind or ahead.

  • Billed against earned

    Are we over- or under-billed?

    What the data needs

    Billings to date against earned value: budget times percent complete.

  • Retainage

    How much is the client holding back?

    What the data needs

    Retainage withheld on each billing, and when it is due for release.

  • Change orders

    How much has the scope changed?

    What the data needs

    Approved and pending change orders by job, by count and value.

  • Gross margin by job

    Which jobs make money?

    What the data needs

    Contract value plus approved changes, less cost to complete.

  • Incident rate

    Are the sites safe?

    What the data needs

    Recordable incidents per 200,000 hours worked, by job.

  • Backlog

    How much work is booked?

    What the data needs

    Contract value not yet earned across signed jobs.

How to build one

How to build your own construction dashboard

From one of the examples above to a live dashboard on your own data.

  1. 1

    Pick a template

    Start from any of the four boards above.

  2. 2

    Add your data

    Upload a spreadsheet, or connect one of 100+ tested connectors.

  3. 3

    Clean it once

    Fix and combine your data once. Mammoth repeats those steps for you.

  4. 4

    Set it to refresh

    The dashboard updates on a schedule and flags data that fails a check.

  5. 5

    Share the link

    Public, password-protected or sign-in only, on every plan.

Start with a template

14-day Pro trial · No credit card

FAQ

Construction dashboard questions

Last reviewed against the template catalogue.

What should a construction dashboard show?
Whether each job is on budget, on schedule, billed correctly and safe. That means cost against budget by job and trade, days behind schedule, billed against earned, retainage, change orders and the incident rate. The boards above cover those, with the project portfolio and subcontractor spend beside them.
What KPIs should a contractor track?
Cost variance, schedule variance, gross margin by job, over- and under-billing, change order value, retainage, backlog and the recordable incident rate are the core. The list below shows each one with the data it needs.
How do I build a construction dashboard?
Start with the work-in-progress report the monthly review already uses. Then follow five steps.
  1. Export job cost by job, trade and month from the accounting or job costing system.
  2. Add budget, percent complete and billings for the same jobs.
  3. Add planned and actual milestone dates from the schedule.
  4. Add hours worked and recordable incidents by job from the safety log.
  5. Refresh monthly for cost and weekly for schedule, with a view for each project manager.
What is over-billing in construction?
Billing the client for more than the work completed so far, measured as billings against earned value (budget times percent complete). Some over-billing helps cash flow; a lot of it is a liability, and under-billing means work the client has not paid for yet.
Where does construction data come from?
Usually job costing in an ERP such as Sage, Viewpoint or Procore, the schedule in a project tool, billing applications, and a safety log that is often a spreadsheet. Mammoth has 100+ tested connectors, and can also connect to anything with a REST API. You combine the sources once, and Mammoth repeats the same steps on every refresh.
Can site teams see it without a licence?
Yes. Dashboard viewers are unlimited and free on every Mammoth plan, including the free one, so project managers, superintendents and owners can open it at no per-viewer cost. Only the people building the dashboards count as platform users.

Build the construction dashboard you actually need.

Start from one of these templates or your own spreadsheet. Share it with as many people as you like, free.

  • ✓ 14-day Pro trial
  • ✓ No credit card
  • ✓ Viewers always free