Skip to content

Recruitment dashboards

Recruitment dashboard examples

Four dashboards for a recruiting team: the hiring funnel with time and cost per hire by source, hiring against people leaving, what new offers cost against the pay bands, and the people scorecard recruiting reports into. Open any of them to see it in full, then use it as a template for your own data.
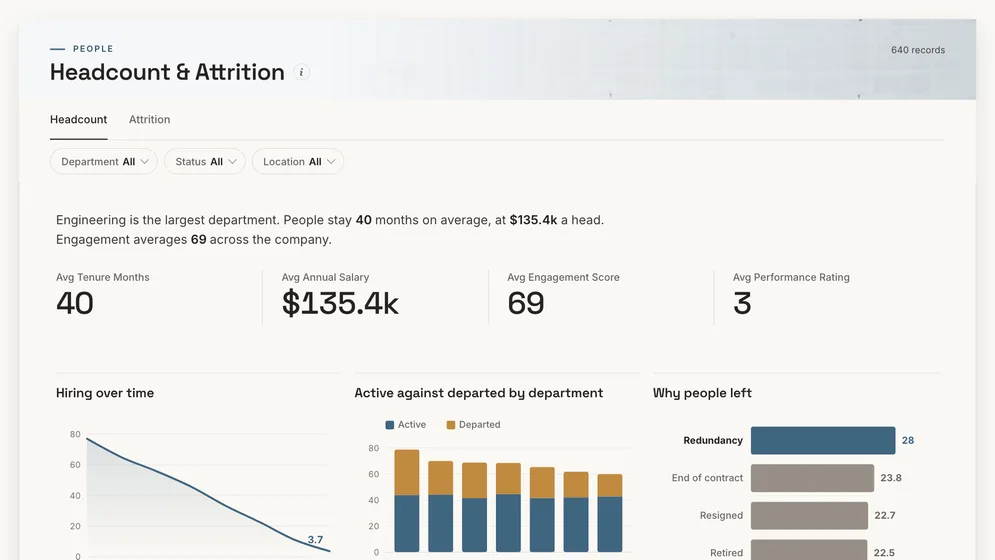
Headcount & Attrition dashboard: Tenure Months, Annual Salary, Engagement Score and Performance Rating tiles.
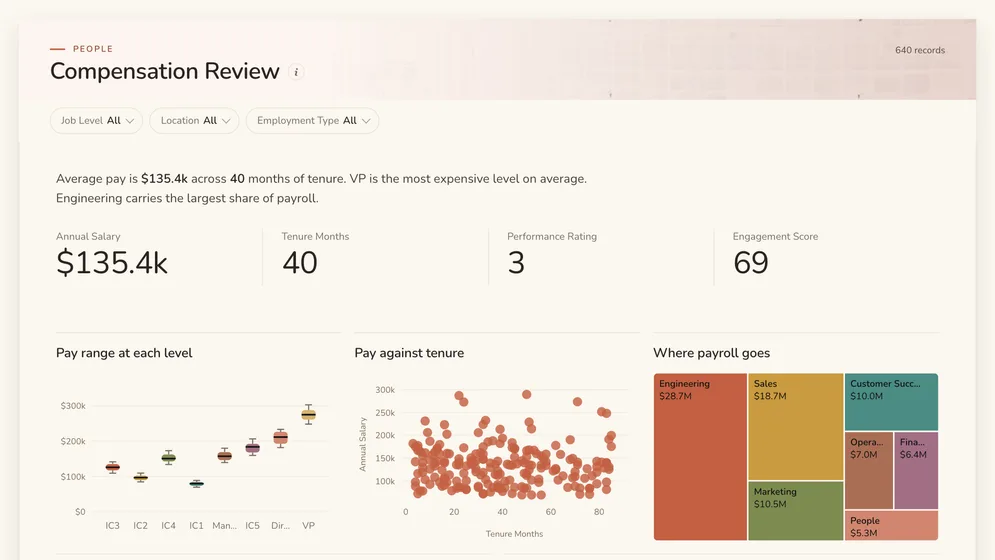
Compensation Review dashboard: Annual Salary, Tenure Months, Performance Rating and Engagement Score tiles.
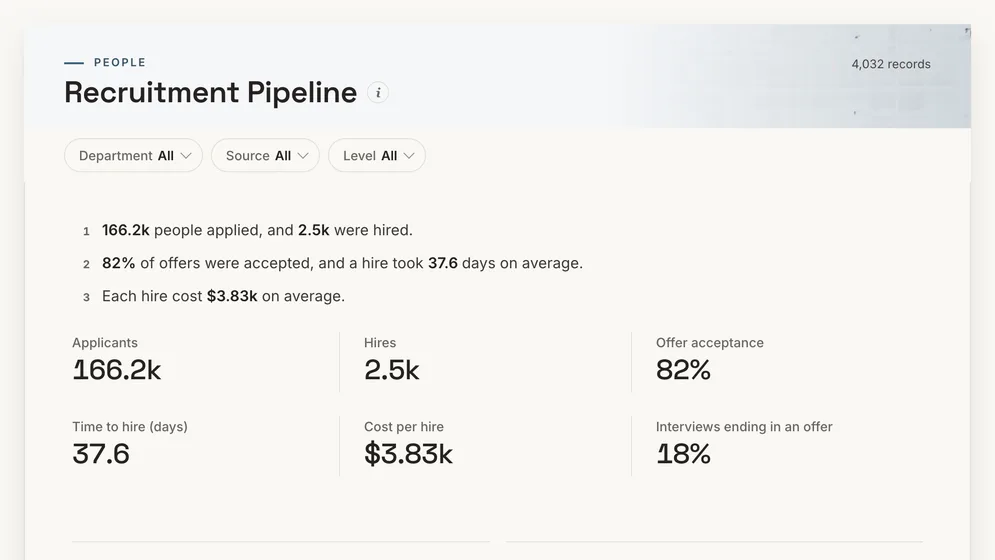
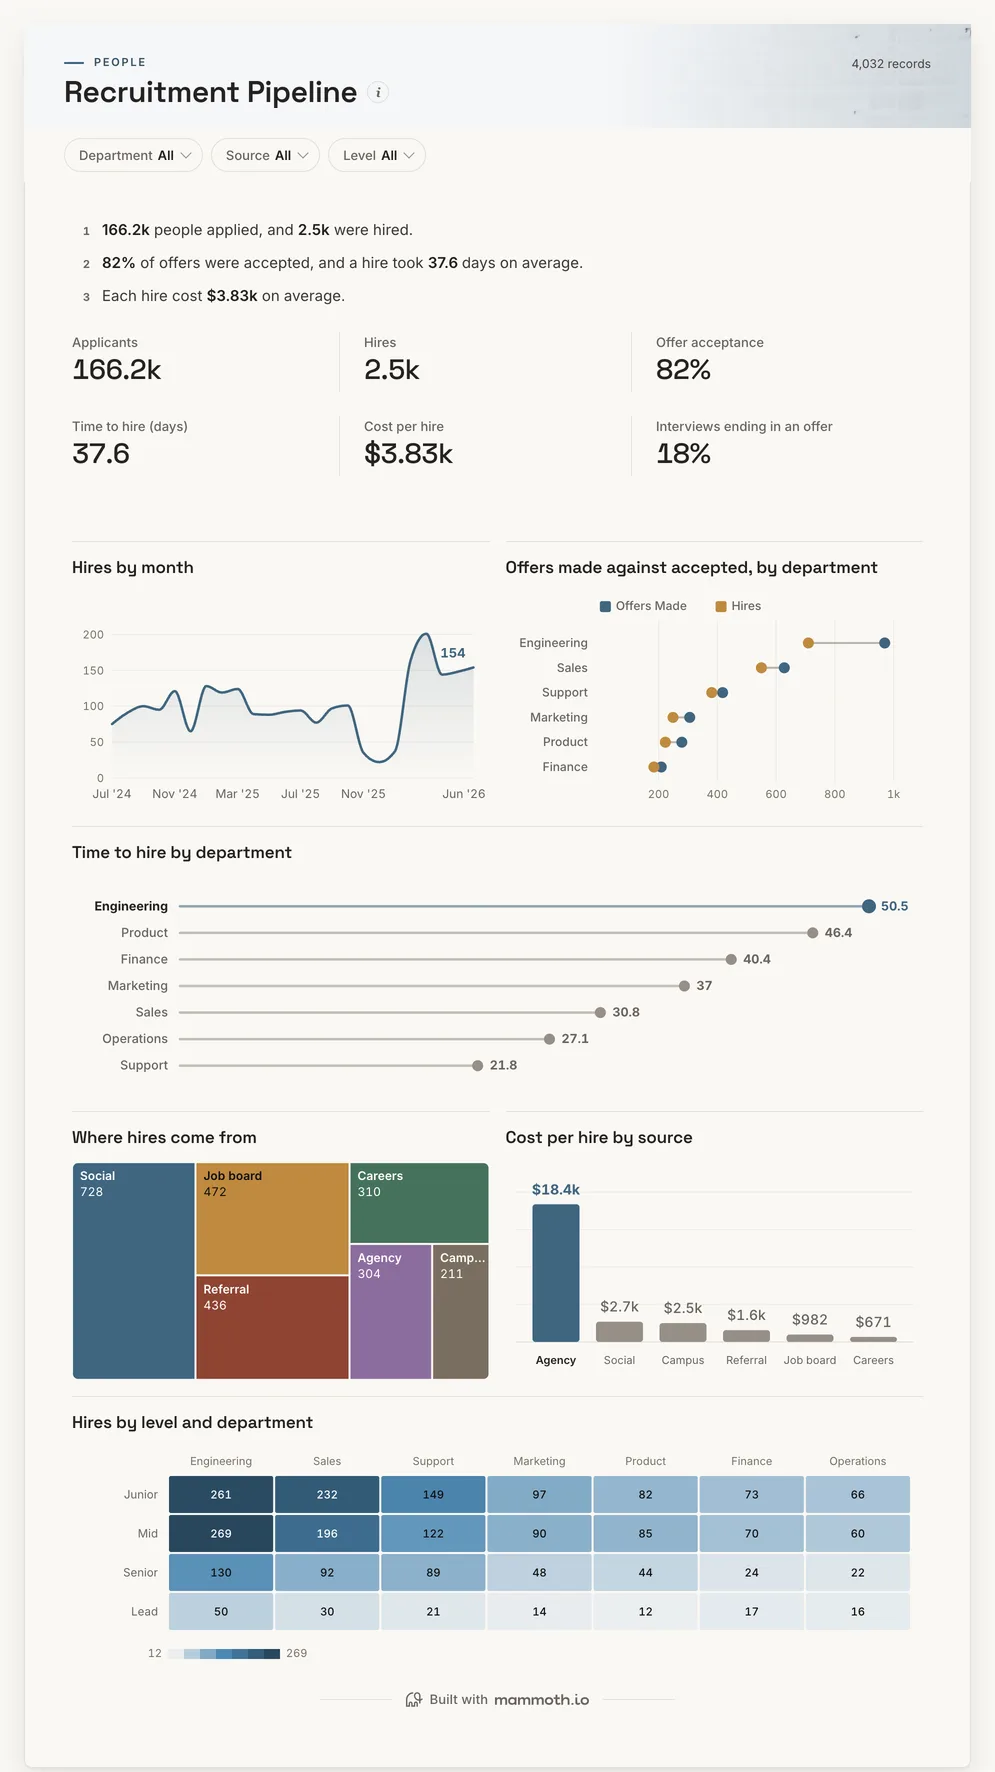
Recruitment Pipeline dashboard: Applicants, Hires, Offer acceptance, Time to hire (days) and Cost per hire tiles.

Three of the four examples. All figures are sample data.

The examples

Four recruitment dashboard examples and templates

Click a board to see all of it. Click Use template to start your own copy in Mammoth. All figures are sample data.

  1. Recruitment Pipeline dashboard: Applicants, Hires, Offer acceptance, Time to hire (days) and Cost per hire tiles.
    Sample data

    Recruitment dashboard

    Are we hiring to plan, and which sources are worth what they cost?
    • Applicants
    • Hires
    • Offer acceptance
    • Time to hire (days)
    Use template
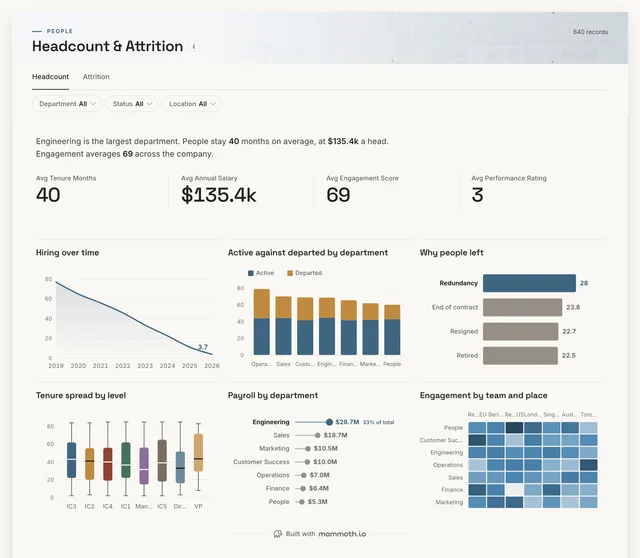
  2. Headcount & Attrition dashboard: Tenure Months, Annual Salary, Engagement Score and Performance Rating tiles.
    Sample data

    Hiring and attrition dashboard

    Are we hiring faster than people leave?
    • Tenure months
    • Annual salary
    • Engagement score
    • Performance rating
    Use template
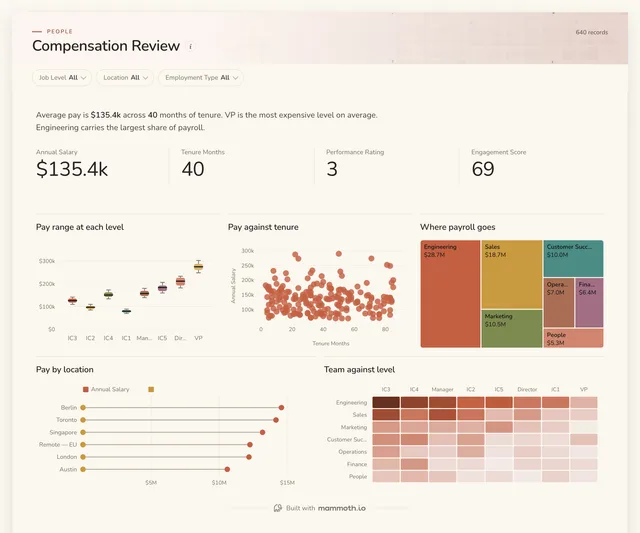
  3. Compensation Review dashboard: Annual Salary, Tenure Months, Performance Rating and Engagement Score tiles.
    Sample data

    Offer and pay band dashboard

    What will the new hires cost against the people already here?
    • Annual salary
    • Tenure months
    • Performance rating
    • Engagement score
    Use template
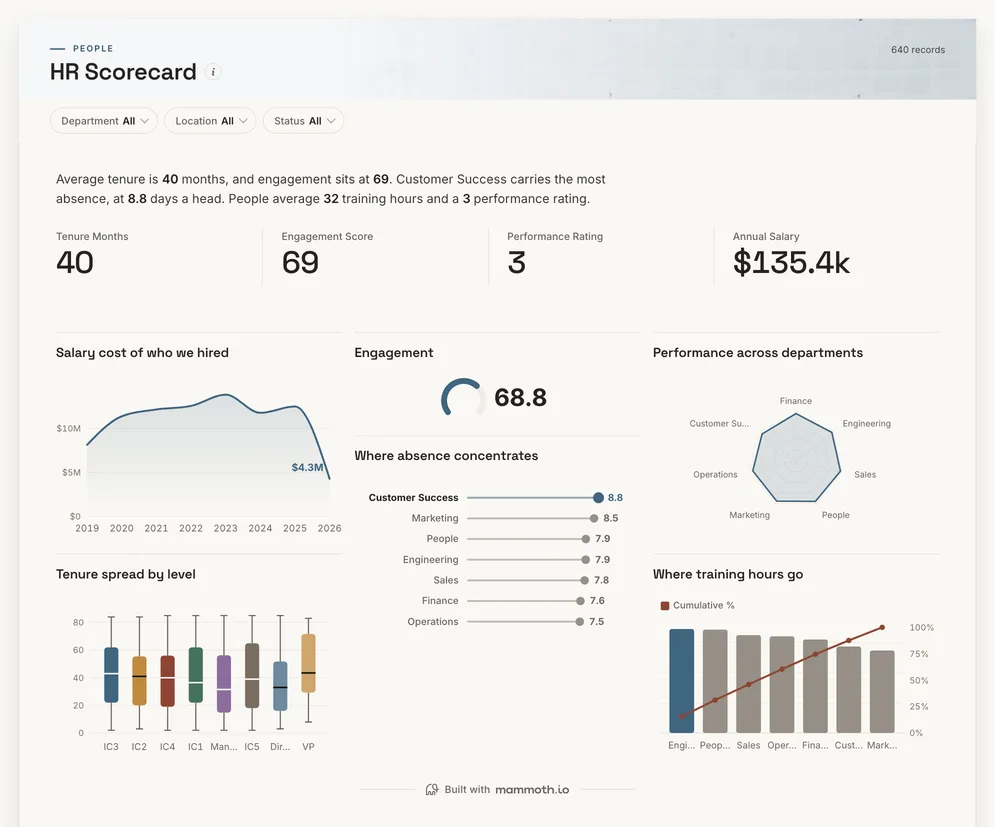
  4. HR Scorecard dashboard: Tenure Months, Engagement Score, Performance Rating and Annual Salary tiles.
    Sample data

    HR recruiting scorecard

    What does the leadership review ask about people?

    • Tenure months
    • Engagement score
    • Performance rating
    • Annual salary
    Use template

Definition

What a recruitment dashboard is

A recruitment dashboard is one screen that shows whether hiring is keeping up with the plan: applicants, interviews, offers and hires, how long a hire takes, what it costs, and which sources produce people who accept. The data usually comes from the applicant tracking system, the recruiting budget and the HR system.

  • Cost by source

    Agency, referral and job board side by side.

  • Speed by team

    Days to hire for every department.

  • From the ATS

    Applicant exports you already have.

The metrics

The metrics a recruitment dashboard is built from

Eight numbers. Most depend on a definition agreed first, such as when the clock starts or what counts as a source.

  • Applicants

    How many people applied?

    What the data needs

    Candidates by requisition, department and source, deduplicated across roles.

  • Hires

    How many people did we hire, against plan?

    What the data needs

    Accepted offers with a start date, beside the hiring plan for the same period.

  • Time to hire

    How long does a hire take?

    What the data needs

    Days from the agreed start of the clock to an accepted offer, by department and level.

  • Cost per hire

    What does each hire cost?

    What the data needs

    Recruiting spend by source over the same period, divided by hires from that source.

  • Offer acceptance

    How many offers are accepted?

    What the data needs

    Offers made and accepted. A low rate usually points at pay or at the process taking too long.

  • Interview to offer

    Are we interviewing the right people?

    What the data needs

    Final interviews and offers by role. A low rate means screening is letting the wrong people through.

  • Source of hire

    Where do our hires come from?

    What the data needs

    One source per candidate, recorded at application and kept consistent.

  • Early attrition

    Do new hires stay?

    What the data needs

    Leavers within the first year by source and department, from the HR system.

How to build one

How to build your own recruitment dashboard

From one of the examples above to a live dashboard on your own data.

  1. 1

    Pick a template

    Start from any of the four boards above.

  2. 2

    Add your data

    Upload a spreadsheet, or connect one of 100+ tested connectors.

  3. 3

    Clean it once

    Fix and combine your data once. Mammoth repeats those steps for you.

  4. 4

    Set it to refresh

    The dashboard updates on a schedule and flags data that fails a check.

  5. 5

    Share the link

    Public, password-protected or sign-in only, on every plan.

Start with a template

14-day Pro trial · No credit card

FAQ

Recruitment dashboard questions

Last reviewed against the template catalogue.

What should a recruitment dashboard show?
Whether hiring is on plan and what it costs. That means applicants, interviews, offers and hires, time to hire, cost per hire and offer acceptance, by department, level and source. The boards above cover those, with attrition and pay beside them.
What recruiting KPIs should we track?
Time to hire, cost per hire, offer acceptance rate, interview-to-offer rate and source of hire are the core, with hires against plan and early attrition underneath. The list below shows each one with the data it needs.
How do I build a recruitment dashboard?
Start with the hiring plan the leadership team already tracks. Then follow five steps.
  1. Export candidates from the applicant tracking system with stage, dates, department, level and source.
  2. Add the recruiting spend by source: agency fees, job boards and referral bonuses.
  3. Agree when the clock starts for time to hire: requisition opened or first application.
  4. Check one month's hires against the HR system before anyone relies on the board.
  5. Refresh weekly, with a view for each hiring manager.
How do you calculate cost per hire?
Add up what recruiting spent in a period, internal and external, and divide by the hires in that period. The useful version splits it by source: an agency hire and a referral hire are different costs, and the mix decides the budget.
Where does recruitment data come from?
Usually an applicant tracking system such as Greenhouse, Lever or Workable, the HR system for start dates and leavers, and the finance system for agency invoices. Mammoth has 100+ tested connectors, and can also connect to anything with a REST API. You combine the sources once, and Mammoth repeats the same steps on every refresh.
Can every hiring manager see it?
Yes. Dashboard viewers are unlimited and free on every Mammoth plan, including the free one, so every hiring manager and recruiter can open it at no per-viewer cost. Only the people building the dashboards count as platform users.

Build the recruitment dashboard you actually need.

Start from one of these templates or your own spreadsheet. Share it with as many people as you like, free.

  • ✓ 14-day Pro trial
  • ✓ No credit card
  • ✓ Viewers always free