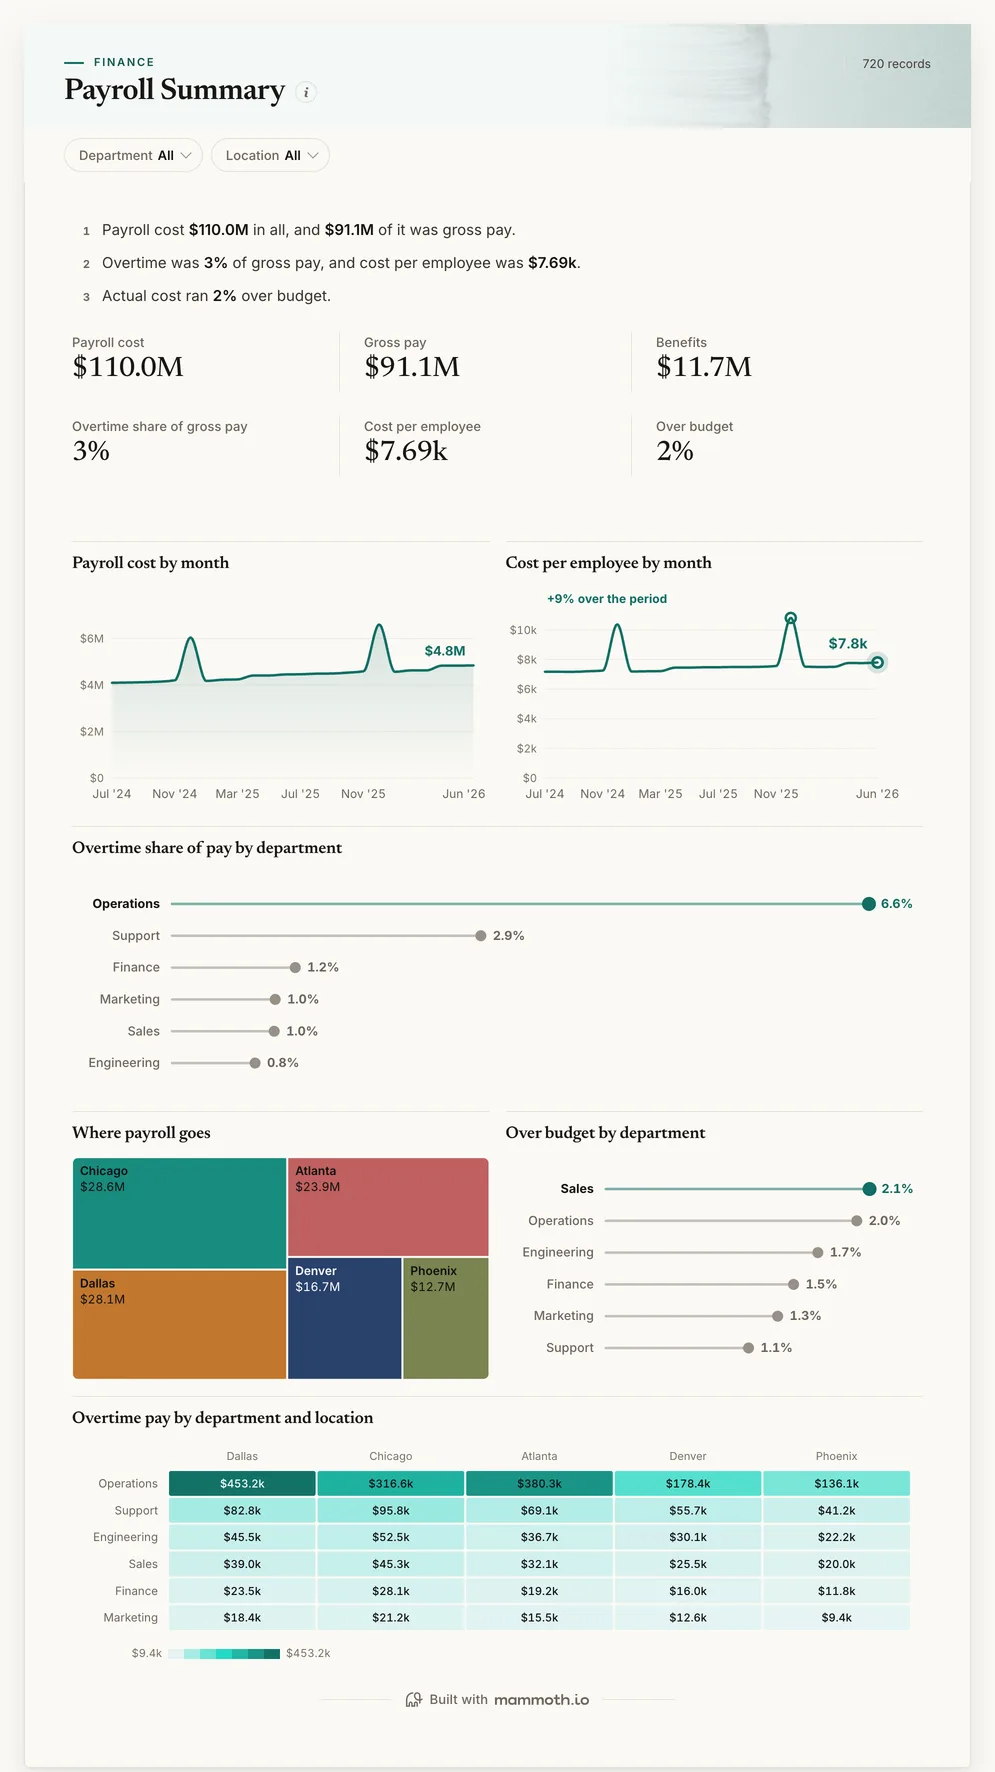
Payroll dashboard
What did payroll cost, and where is overtime building?
- Payroll cost
- Gross pay
- Benefits
- Overtime share of gross pay
Payroll dashboards
Four dashboards for payroll and finance: payroll cost, overtime and budget by department and location, pay by level and location, whether a growing payroll is headcount or pay, and labour cost against budget. Open any of them to see it in full, then use it as a template for your own data.
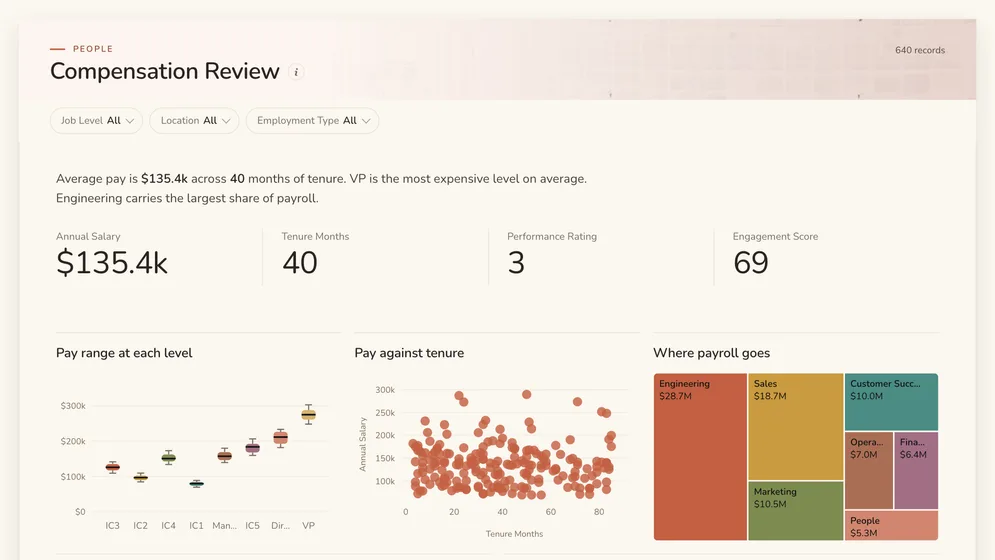
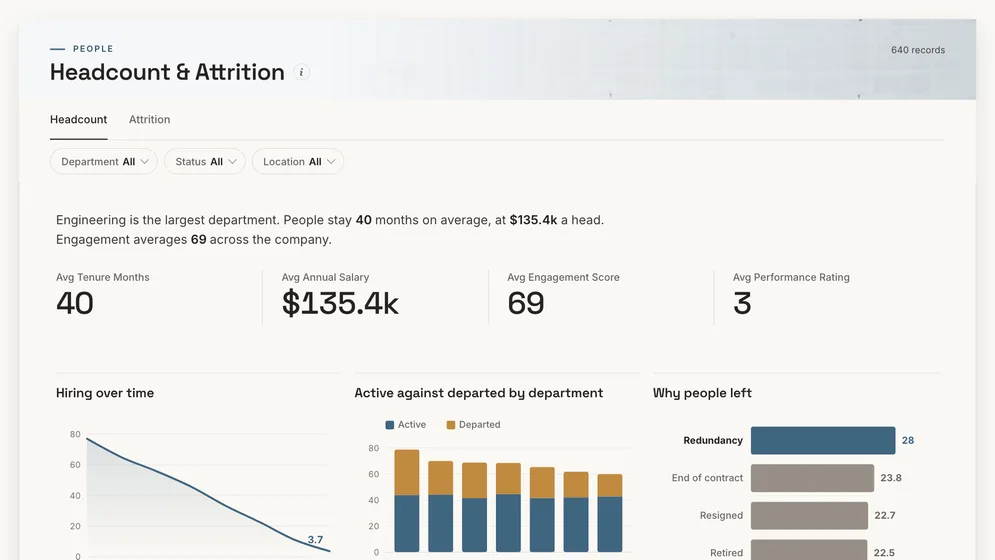
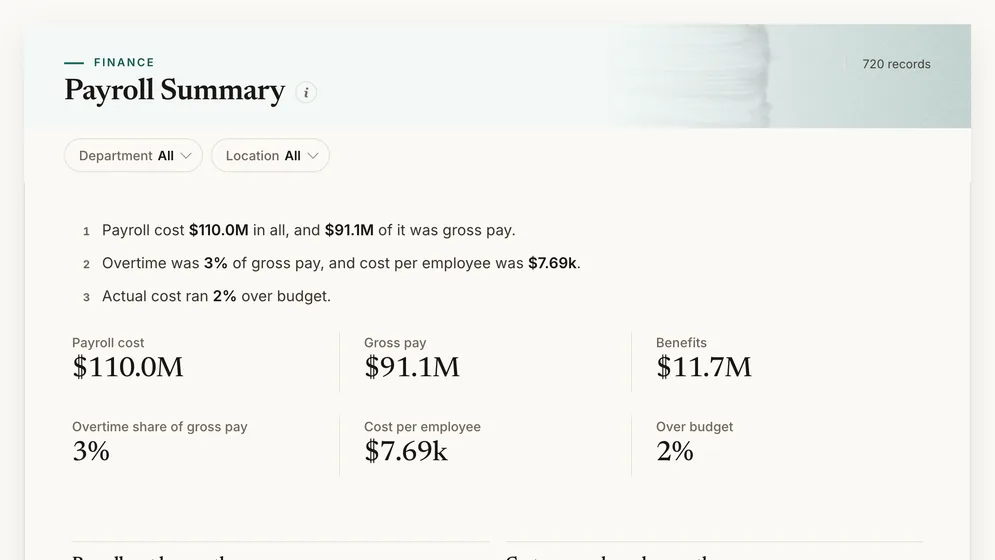
Three of the four examples. All figures are sample data.
The examples
Click a board to see all of it. Click Use template to start your own copy in Mammoth. All figures are sample data.
What did payroll cost, and where is overtime building?
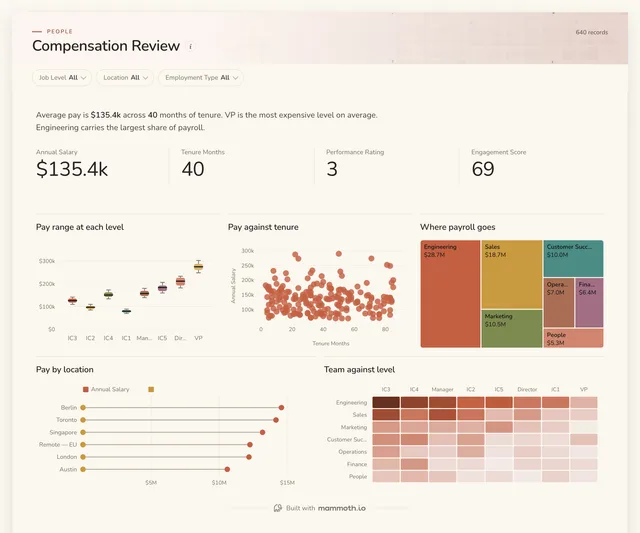
Is pay consistent across levels and locations?
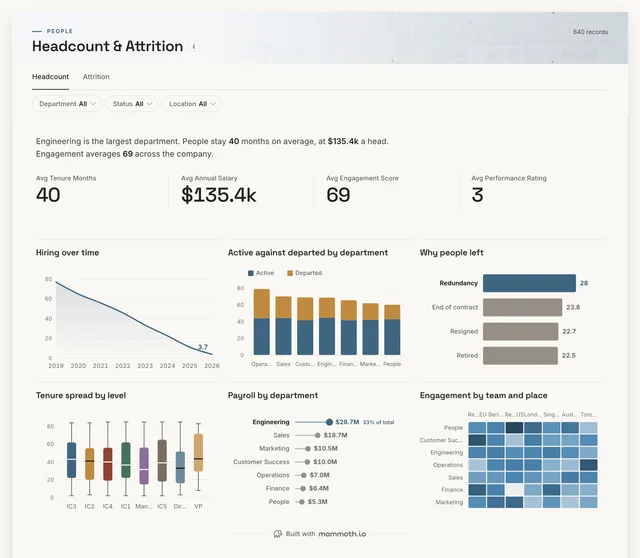
Is the payroll growing because headcount is?
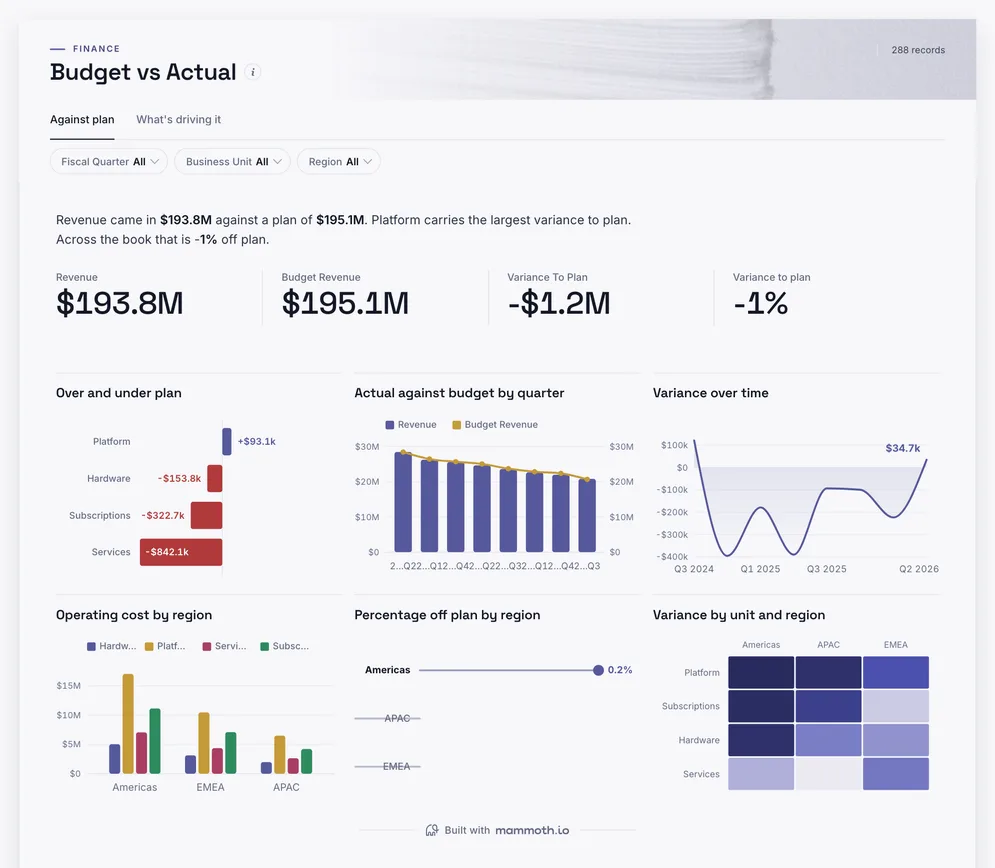
Is labour cost running to budget?
Definition
A payroll dashboard is one screen that shows what the workforce costs and where that cost is moving: gross pay, overtime, benefits and employer taxes, cost per employee, and payroll against budget, by department and location. The data usually comes from the payroll register, the HR system and the budget.
Which team and which site, every month.
Over and under by department.
The register export you already produce.
The metrics
Eight numbers. Most depend on a definition agreed first, such as which pay elements count as overtime.
What did the workforce cost?
Gross pay, benefits and employer taxes per pay period, by department and location.
What did we pay before deductions?
Base pay, overtime, bonus and allowances from the payroll register.
How much of pay is overtime?
Overtime pay against gross pay, by team and site.
What do benefits add?
Employer contributions to health, pension and other plans, per employee.
What does one person cost on average?
Payroll cost divided by average headcount for the same period.
Are we over or under the labour budget?
Actual payroll cost against the budget at the same department and month.
How much of revenue goes on people?
Payroll cost against revenue for the same period, from the ledger.
How often do we get a run wrong?
Corrections and off-cycle payments per run. Each one is someone paid late or wrongly.
How to build one
From one of the examples above to a live dashboard on your own data.
Start from any of the four boards above.
Upload a spreadsheet, or connect one of 100+ tested connectors.
Fix and combine your data once. Mammoth repeats those steps for you.
The dashboard updates on a schedule and flags data that fails a check.
Public, password-protected or sign-in only, on every plan.
14-day Pro trial · No credit card
FAQ
Last reviewed against the template catalogue.
Start from one of these templates or your own spreadsheet. Share it with as many people as you like, free.
More dashboard examples


