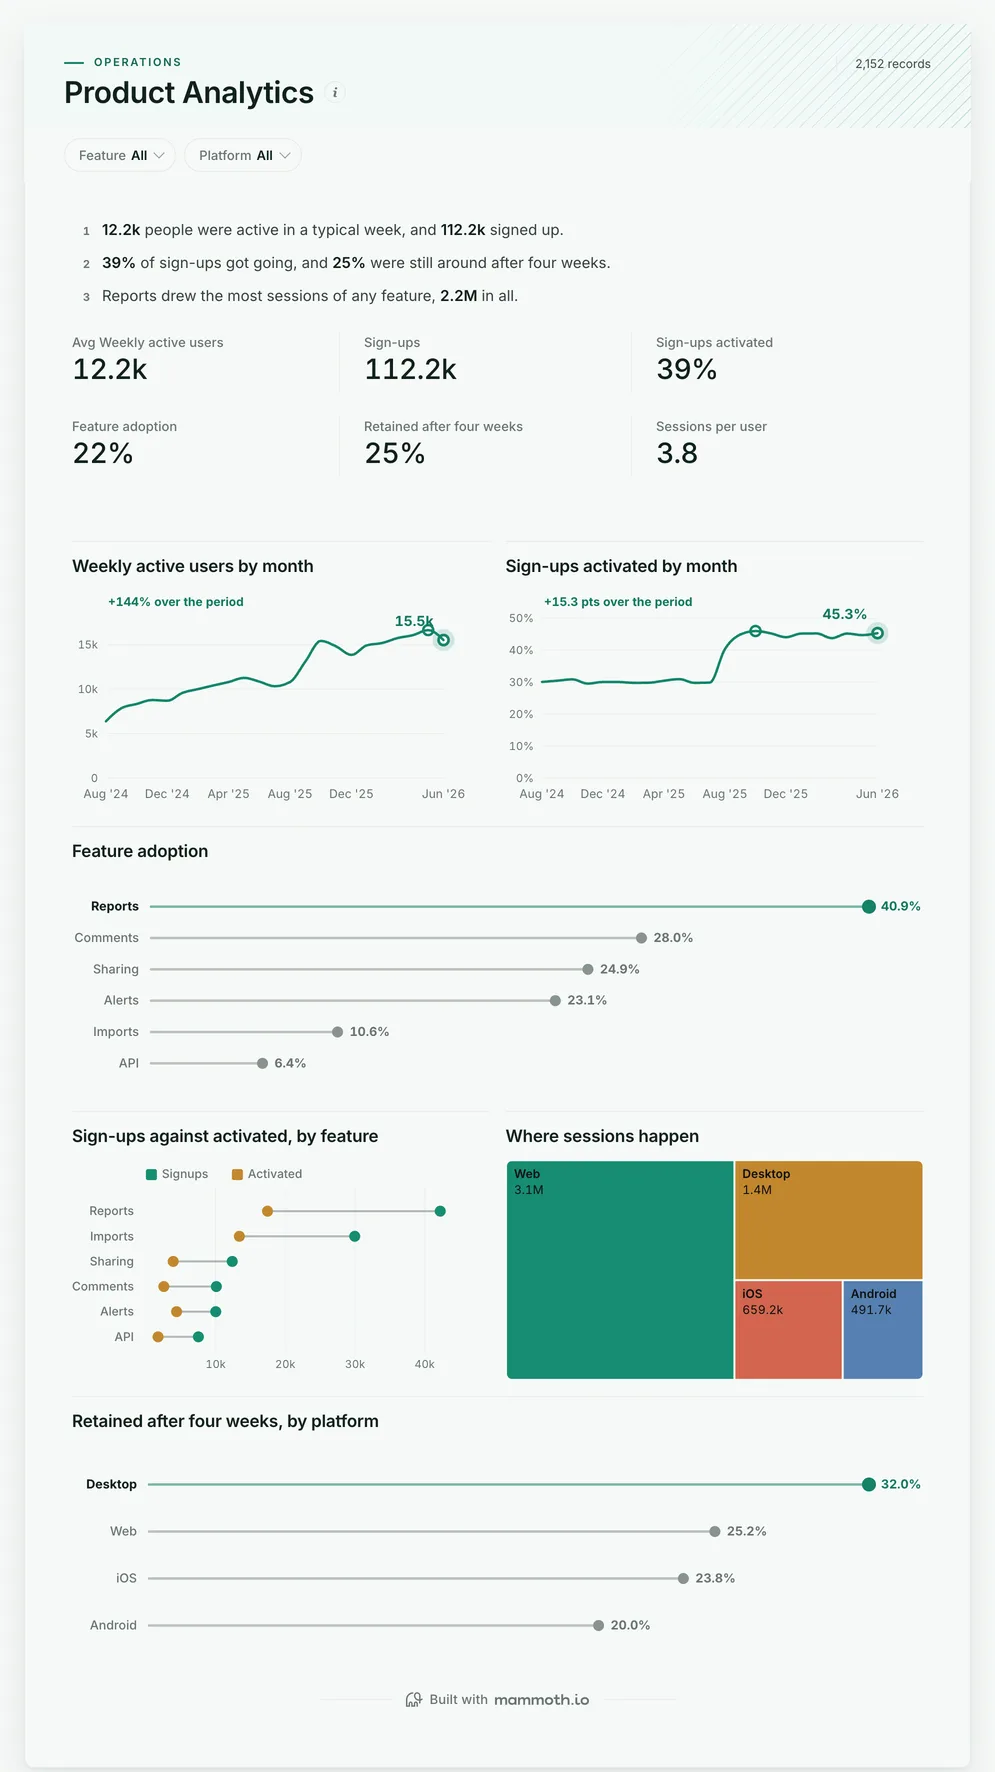
Product analytics dashboard
Are people using the product, and do new sign-ups stick?
- Avg weekly active users
- Sign-ups
- Sign-ups activated
- Feature adoption
Product analytics dashboards
Four dashboards for a product team: active users, activation, feature adoption and retention by feature and platform, whether usage turns into revenue, what users say, and how fast the team ships. Open any of them to see it in full, then use it as a template for your own data.
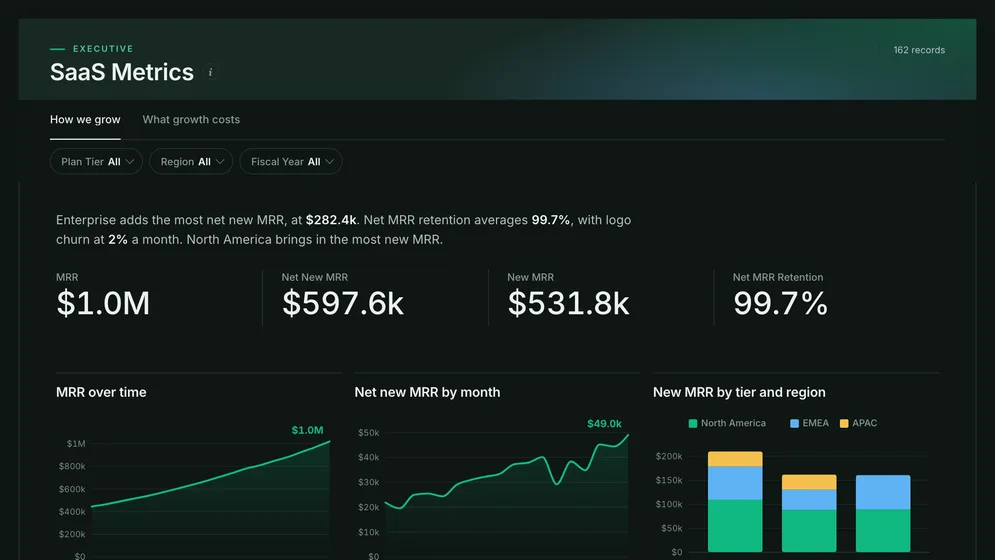
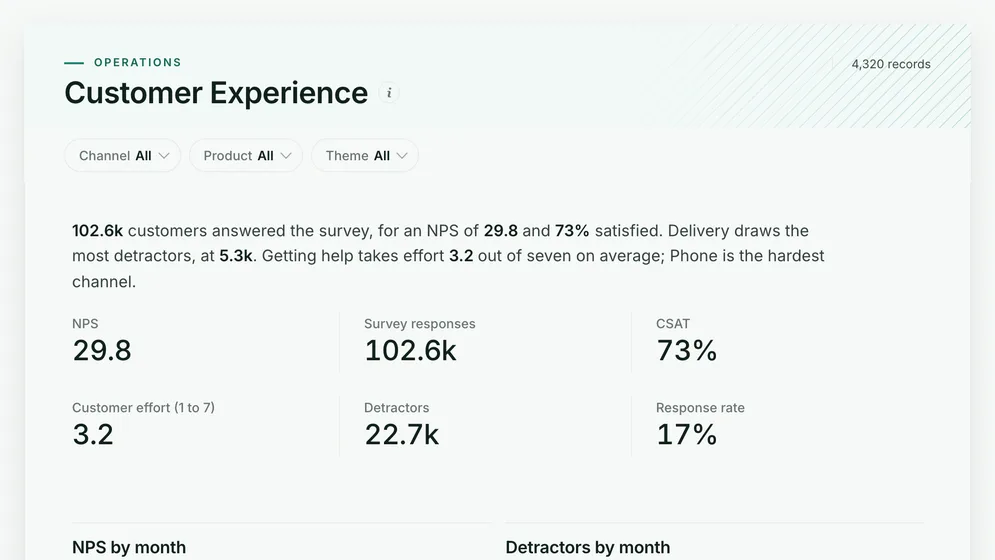
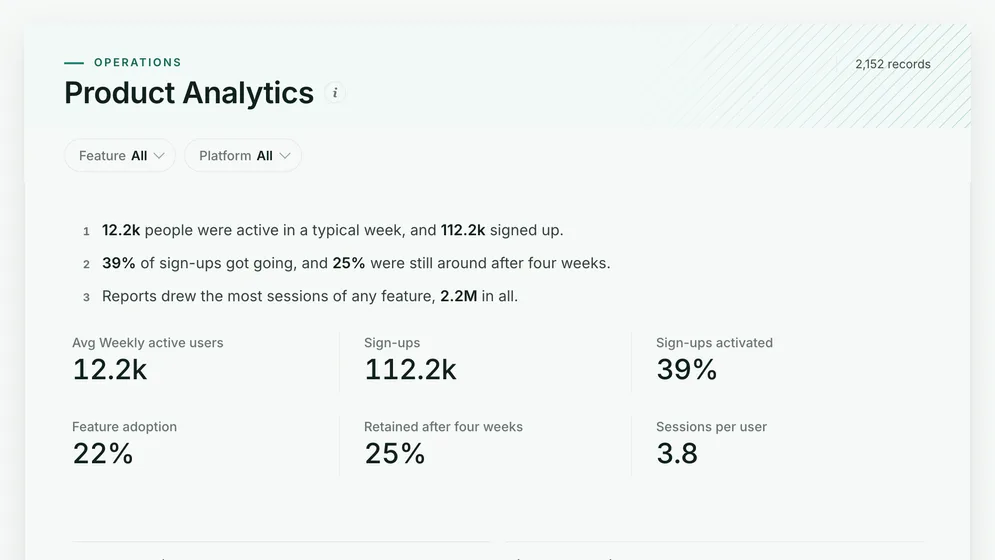
Three of the four examples. All figures are sample data.
The examples
Click a board to see all of it. Click Use template to start your own copy in Mammoth. All figures are sample data.
Are people using the product, and do new sign-ups stick?
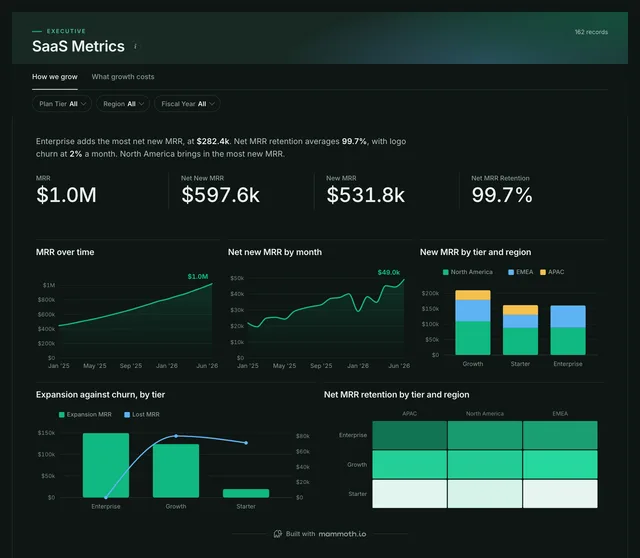
Does usage turn into revenue?
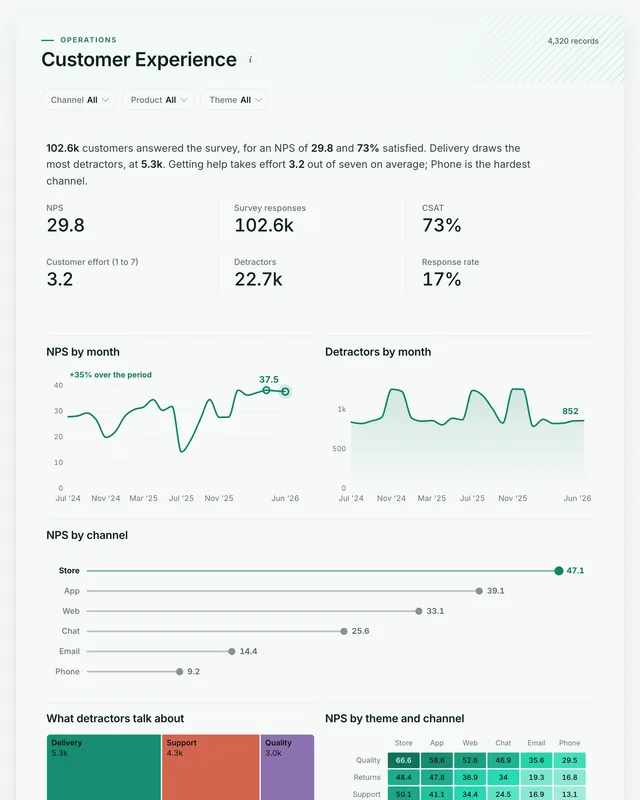
What do users say about the product?
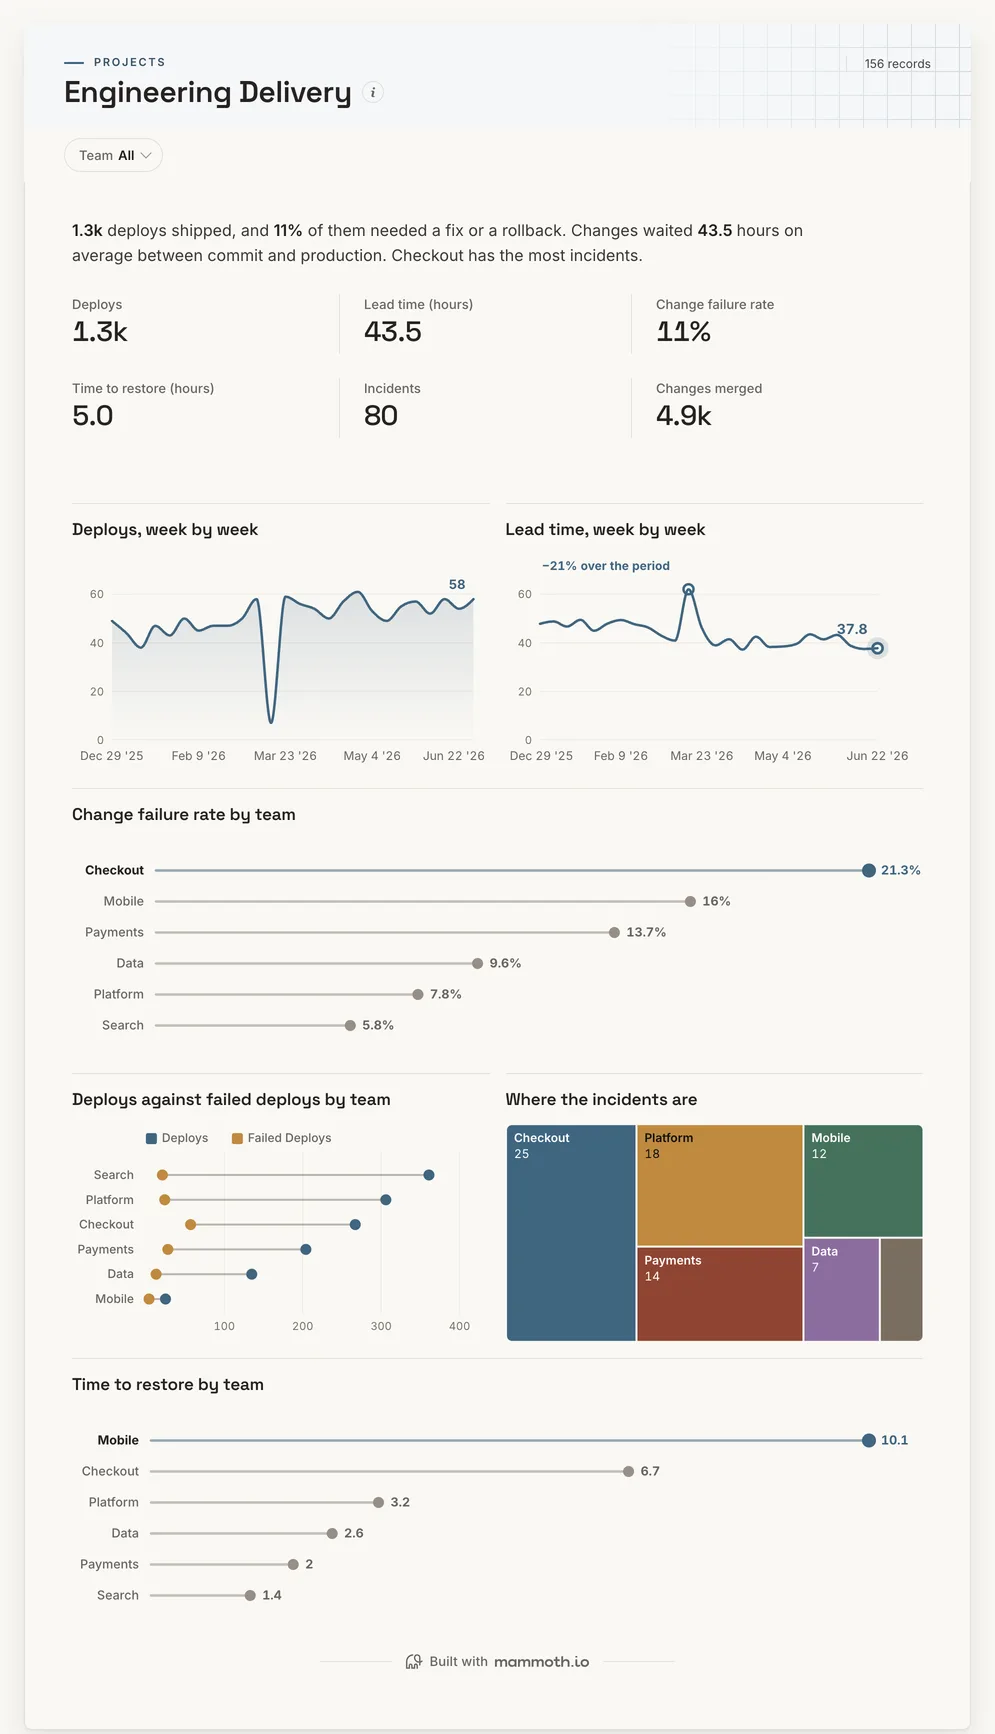
How fast does the team ship what the numbers ask for?
Definition
A product analytics dashboard is one screen that shows whether people use a product and keep using it: active users, sign-ups and how many activate, which features they adopt, how many are still active weeks later, and how that differs by platform and plan. The data usually comes from the event tracking tool, the product database and billing.
Which sign-ups reach the first useful moment.
What people use, ranked by reach.
Who is still here after four weeks.
The metrics
Eight numbers. Most depend on a definition agreed first, such as which events make a user active.
How many people use the product?
Distinct users with a qualifying event in the day, week or month.
How many new users joined?
New accounts by date, source and platform.
How many sign-ups reach the first useful moment?
Sign-ups who complete the agreed activation event within a set window.
Which features do people use?
Active users who used each feature, against all active users.
Do people come back?
Users from a signup cohort still active after one, four or twelve weeks.
How often do people come back in a week?
Sessions against active users for the same period.
Is it part of people's routine?
Daily active users against monthly active users.
How long until a new user gets something out of it?
Time from signup to the activation event, by source and platform.
How to build one
From one of the examples above to a live dashboard on your own data.
Start from any of the four boards above.
Upload a spreadsheet, or connect one of 100+ tested connectors.
Fix and combine your data once. Mammoth repeats those steps for you.
The dashboard updates on a schedule and flags data that fails a check.
Public, password-protected or sign-in only, on every plan.
14-day Pro trial · No credit card
FAQ
Last reviewed against the template catalogue.
Start from one of these templates or your own spreadsheet. Share it with as many people as you like, free.
More dashboard examples


