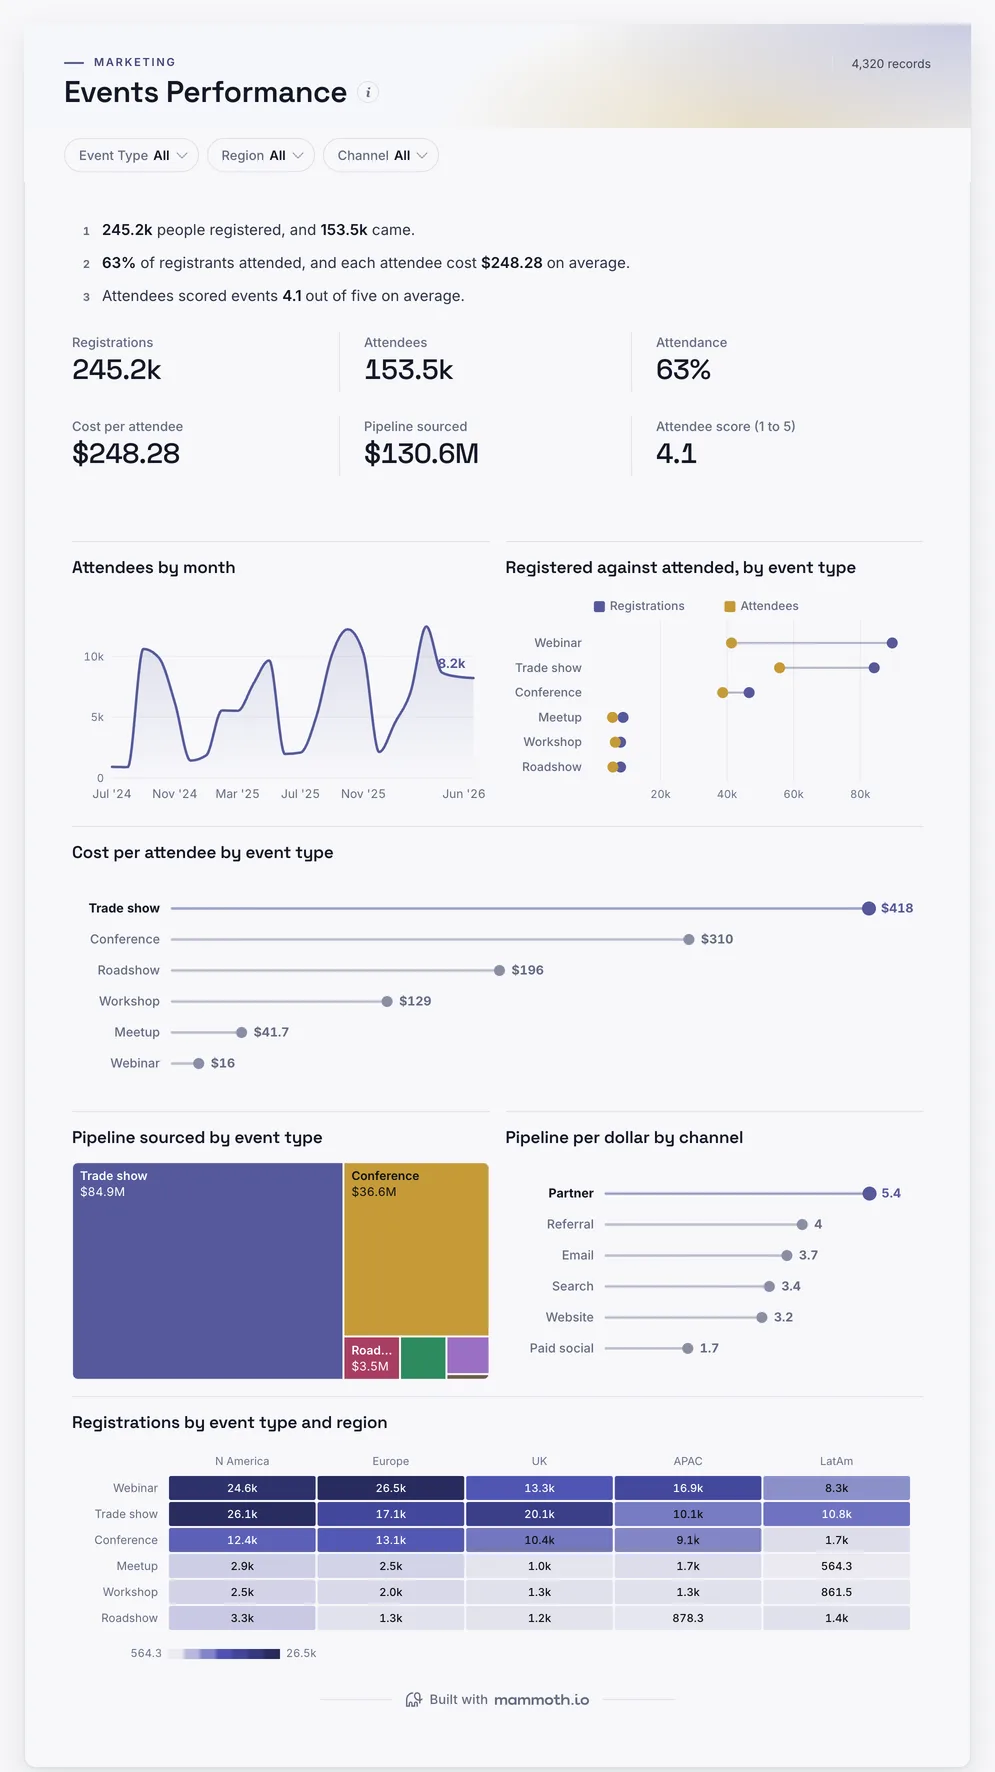
Event dashboard
Did people show up, and which events earn their budget?
- Registrations
- Attendees
- Attendance
- Cost per attendee
Events dashboards
Four dashboards for an events or field marketing team: registrations, attendance, cost and pipeline by event type and channel, the campaigns that filled the room, events against the other channels, and where events sit in the whole plan. Open any of them to see it in full, then use it as a template for your own data.
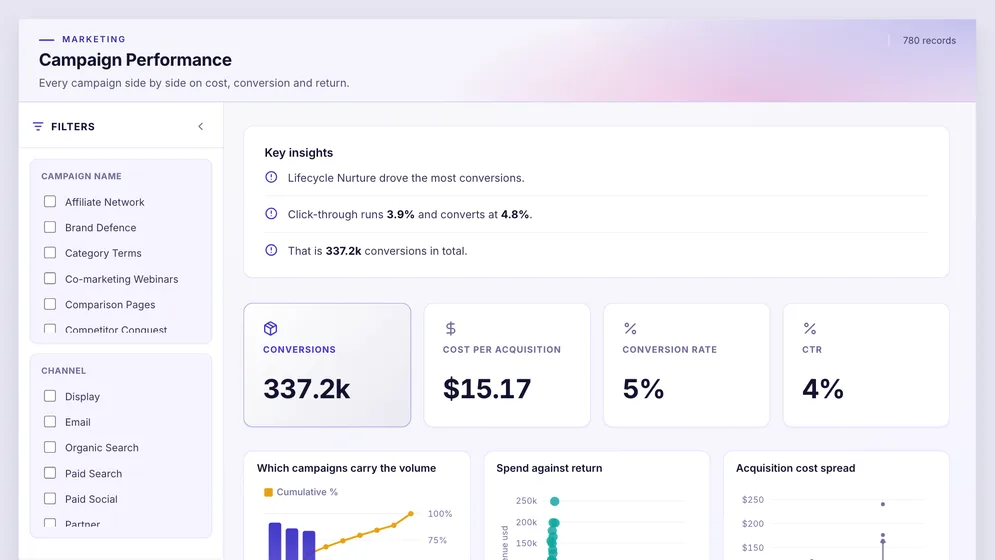
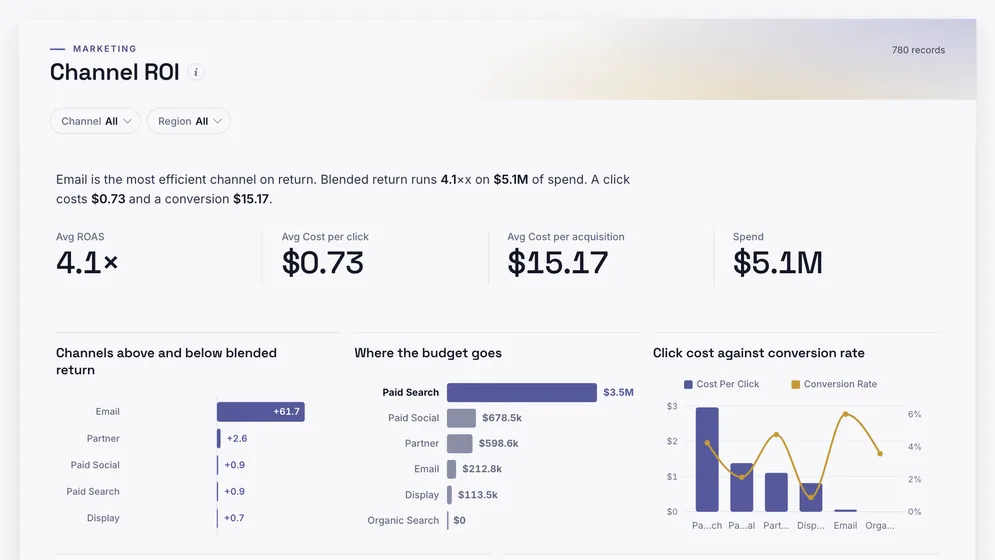
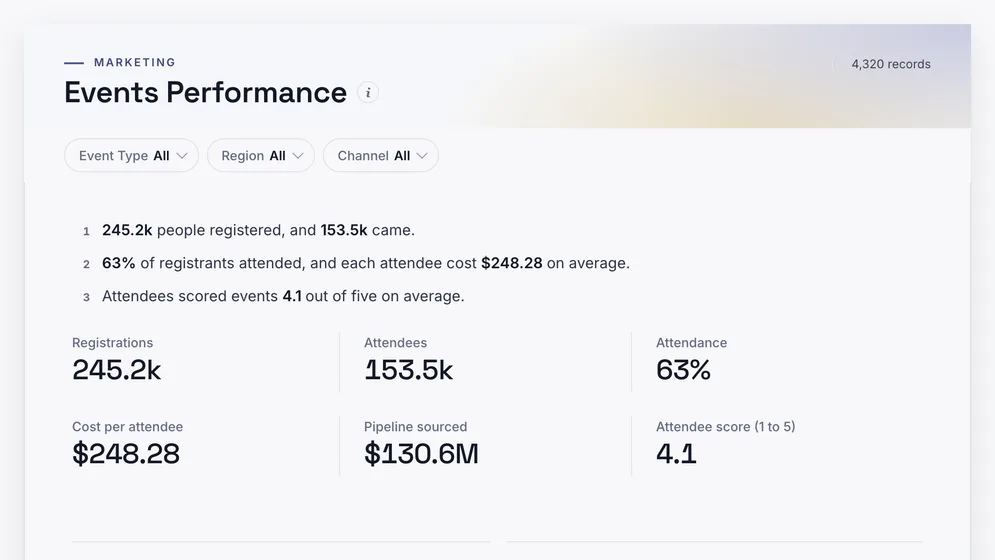
Three of the four examples. All figures are sample data.
The examples
Click a board to see all of it. Click Use template to start your own copy in Mammoth. All figures are sample data.
Did people show up, and which events earn their budget?
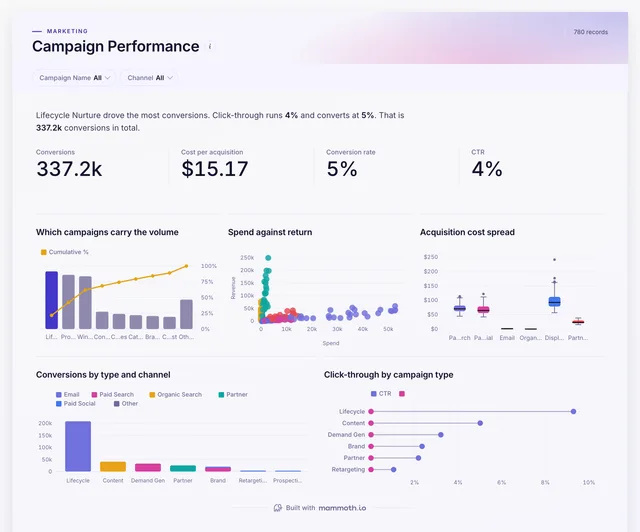
Which event promotions brought people in for what they cost?
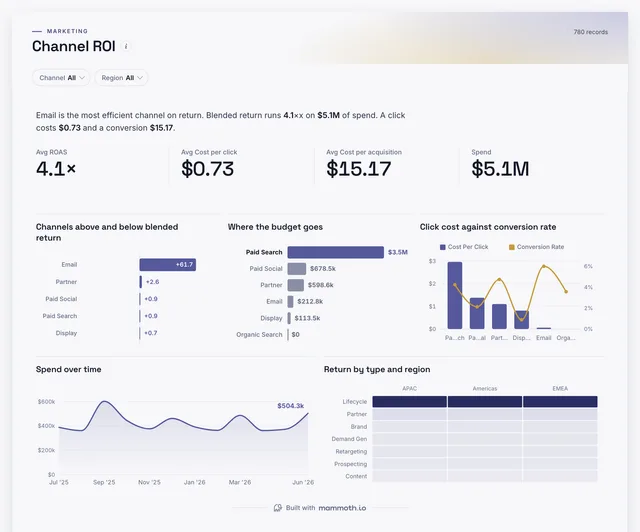
Do events pay back against the other channels?
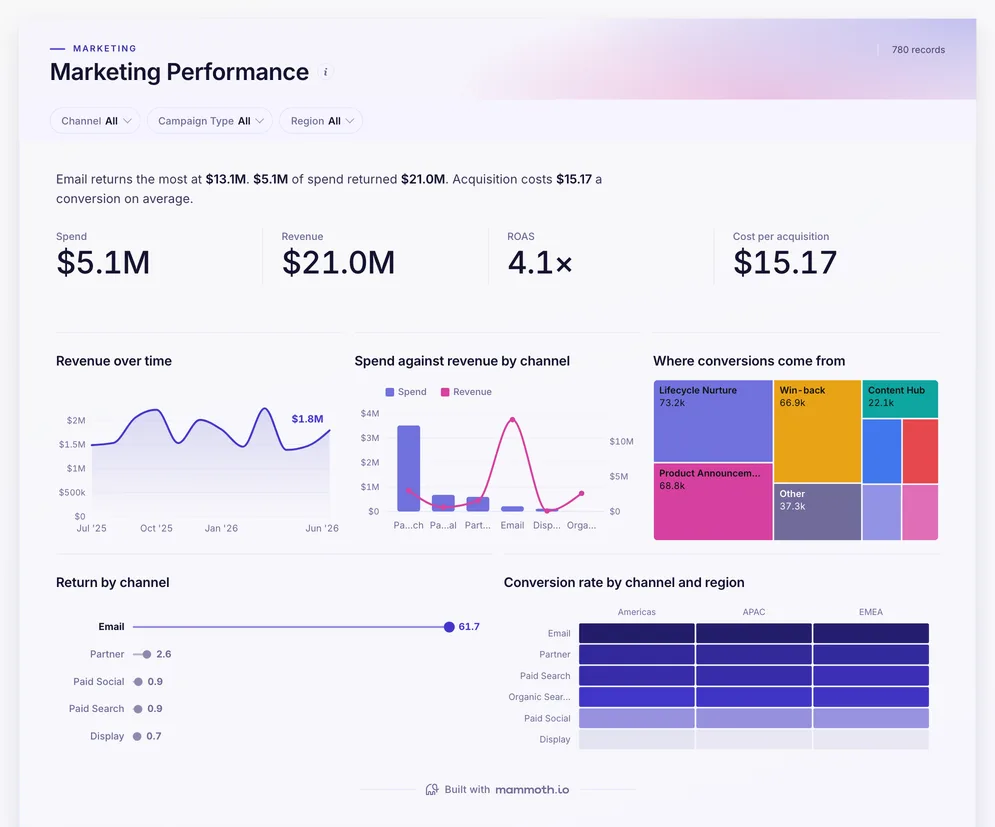
How do events sit in the whole marketing plan?
Definition
An event dashboard is one screen that shows whether events are worth what they cost: registrations, attendance, cost per attendee, attendee satisfaction, and the pipeline or revenue each event sourced, by event type, region and promotion channel. The data usually comes from the event or webinar platform, the marketing budget and the CRM.
The drop-off by event type.
Trade shows, webinars and dinners compared.
What each channel brought to sales.
The metrics
Eight numbers. Most depend on a definition agreed first, such as the attribution window.
How many people signed up?
Registrations by event, type, region and promotion channel.
How many registrants came?
Check-ins or webinar joins against registrations.
What did each attendee cost?
Total event cost, venue to promotion, divided by attendees.
What sales opportunity did the event create?
Opportunities from attendees in the CRM within the agreed window.
Which channel or event type pays back?
Pipeline sourced against cost, by channel and event type.
Did people find it worth their time?
Post-event survey ratings by event and session.
How many registrants never came?
Registrants with no check-in, by event type and how early they registered.
Did sales follow up?
Meetings logged in the CRM with attendees after the event.
How to build one
From one of the examples above to a live dashboard on your own data.
Start from any of the four boards above.
Upload a spreadsheet, or connect one of 100+ tested connectors.
Fix and combine your data once. Mammoth repeats those steps for you.
The dashboard updates on a schedule and flags data that fails a check.
Public, password-protected or sign-in only, on every plan.
14-day Pro trial · No credit card
FAQ
Last reviewed against the template catalogue.
Start from one of these templates or your own spreadsheet. Share it with as many people as you like, free.
More dashboard examples


