Skip to content

Insurance dashboards

Insurance dashboard examples

Four dashboards for an insurer or MGA: premium, loss ratio and combined ratio by line with claims and fraud, the claims phone line, what policyholders say after a claim, and expenses against plan. Open any of them to see it in full, then use it as a template for your own data.
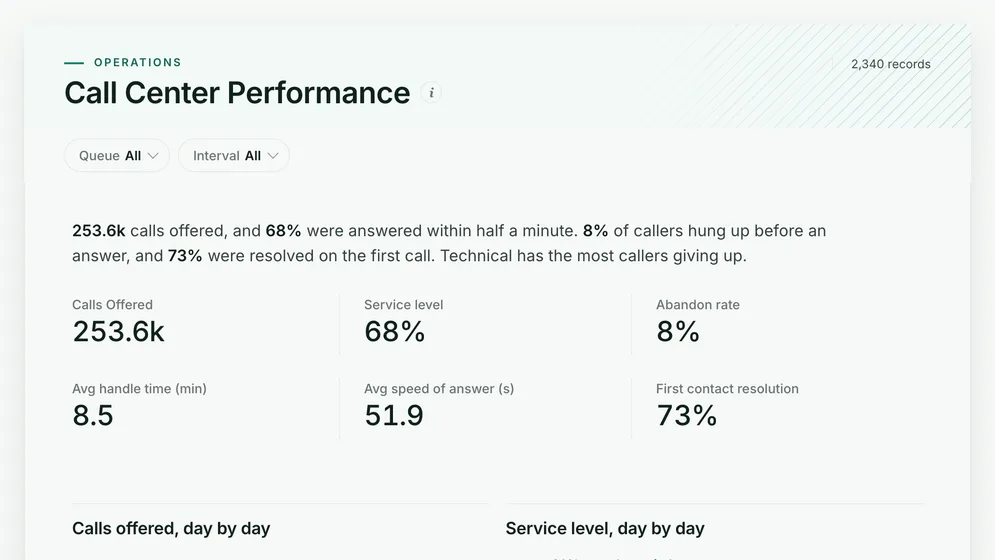
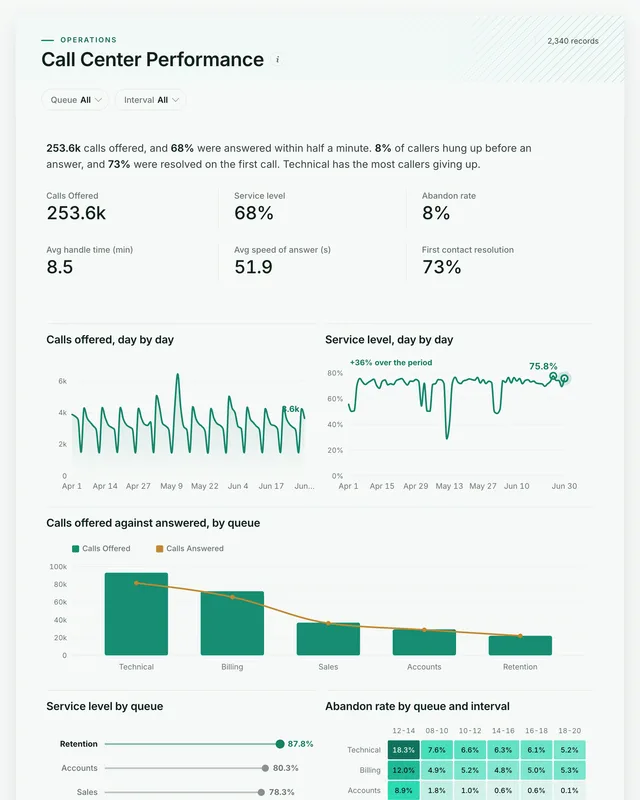
Call Center Performance dashboard: Calls Offered, Service level, Abandon rate and Avg handle time (min) tiles.
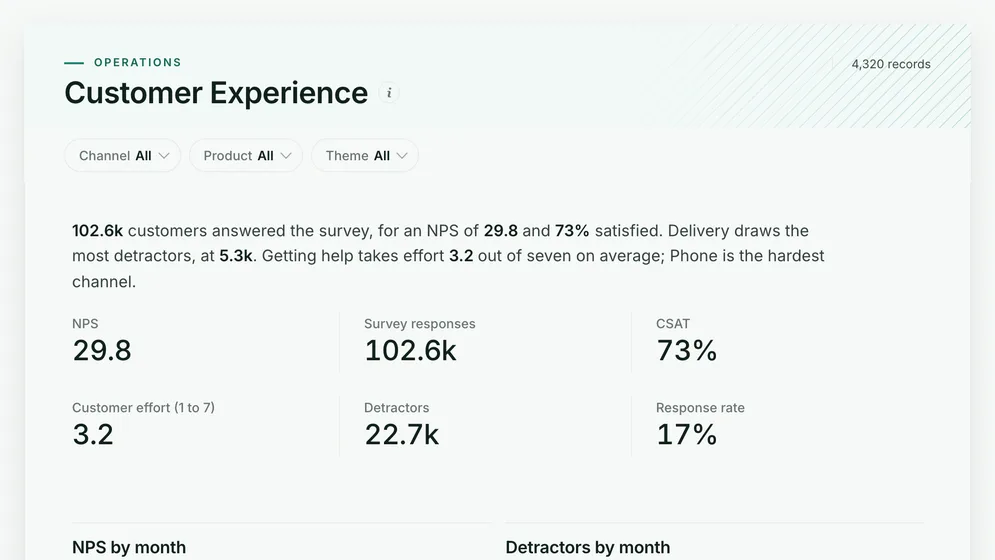
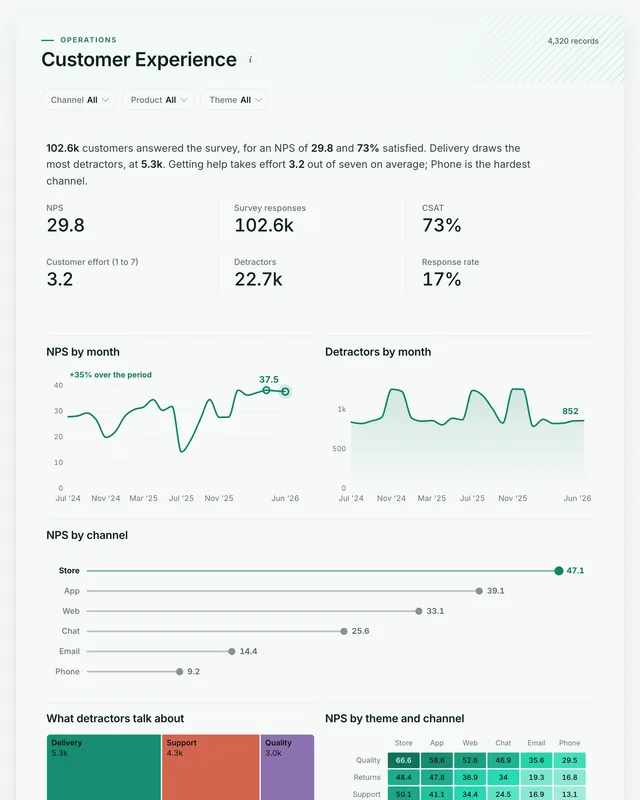
Customer Experience dashboard: NPS, Survey responses, CSAT, Customer effort (1 to 7), Detractors and Response rate tiles.
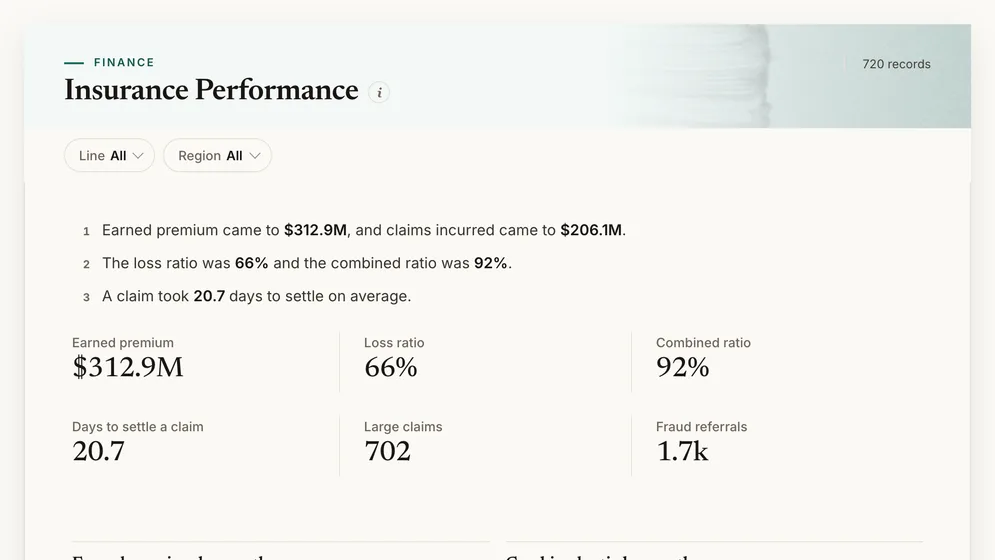
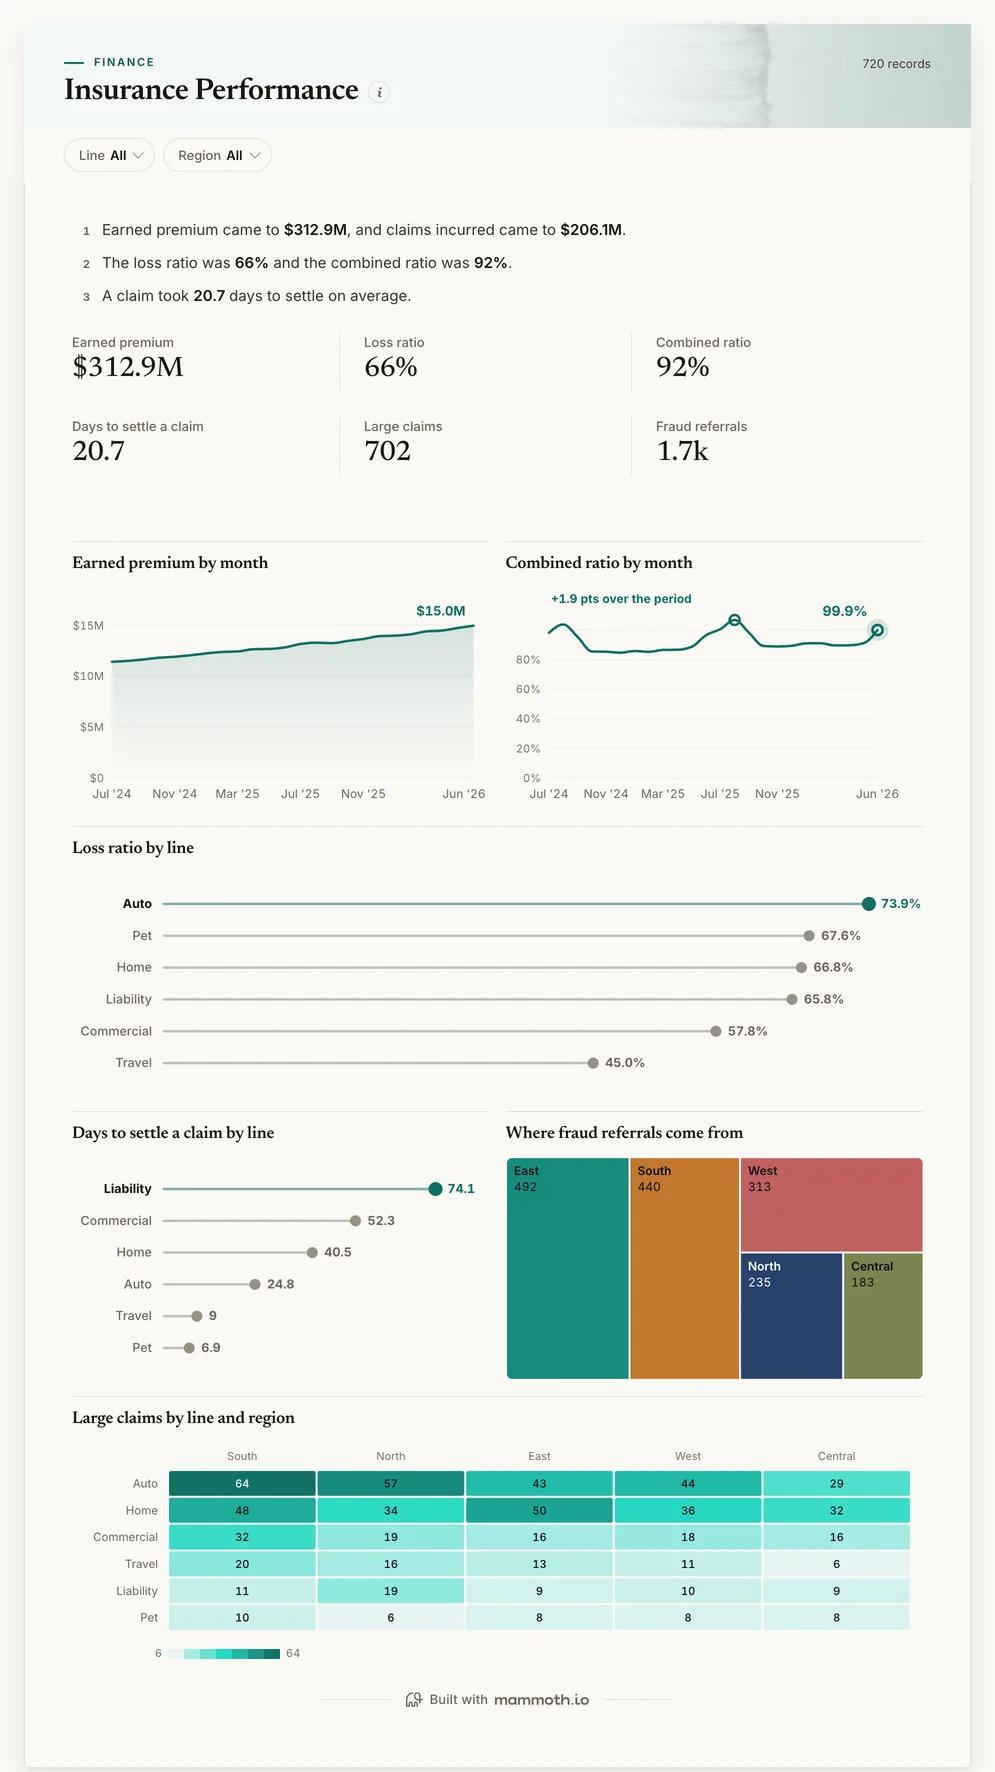
Insurance Performance dashboard: Earned premium, Loss ratio, Combined ratio, Days to settle a claim and Large claims tiles.

Three of the four examples. All figures are sample data.

The examples

Four insurance dashboard examples and templates

Click a board to see all of it. Click Use template to start your own copy in Mammoth. All figures are sample data.

  1. Insurance Performance dashboard: Earned premium, Loss ratio, Combined ratio, Days to settle a claim and Large claims tiles.
    Sample data

    Insurance dashboard

    Are we writing profitable business, and how fast are claims settled?
    • Earned premium
    • Loss ratio
    • Combined ratio
    • Days to settle a claim
    Use template
  2. Call Center Performance dashboard: Calls Offered, Service level, Abandon rate and Avg handle time (min) tiles.
    Sample data

    Insurance claims call center dashboard

    Are claimants getting through when they call?
    • Calls offered
    • Service level
    • Abandon rate
    • Avg handle time (min)
    Use template
  3. Customer Experience dashboard: NPS, Survey responses, CSAT, Customer effort (1 to 7), Detractors and Response rate tiles.
    Sample data

    Insurance customer experience dashboard

    Would policyholders recommend us after a claim?
    • NPS
    • Survey responses
    • CSAT
    • Customer effort (1 to 7)
    Use template
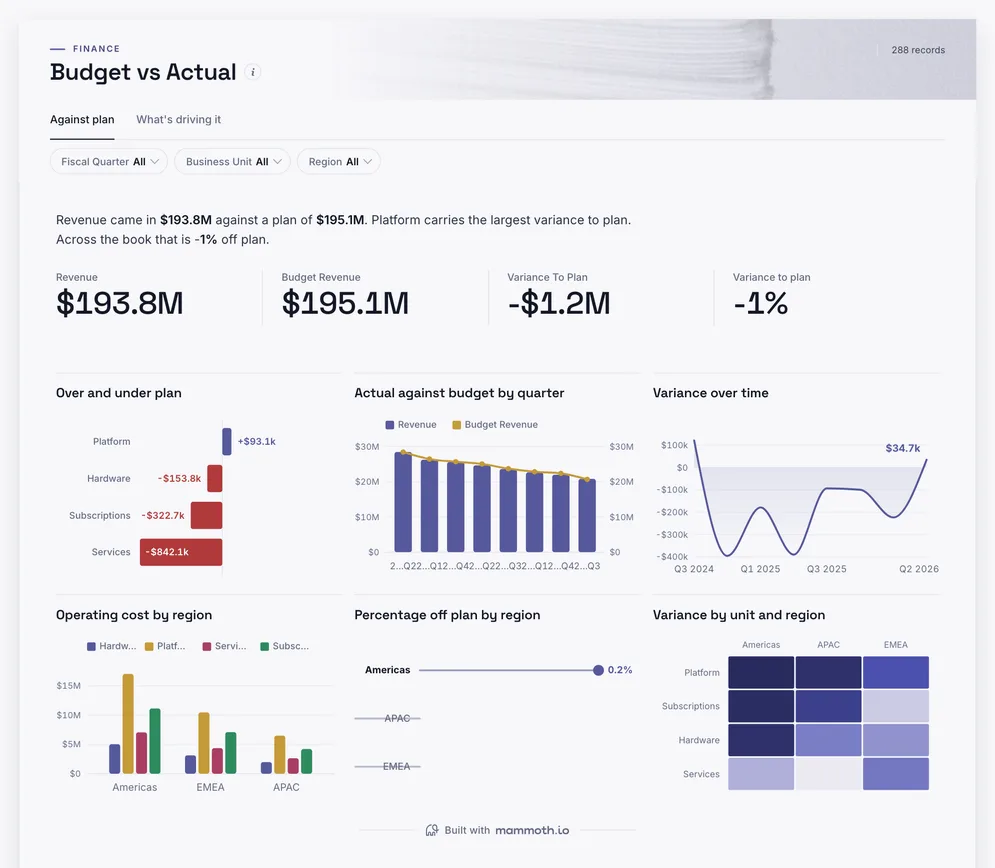
  4. Budget vs Actual dashboard: Revenue, Budget Revenue and Variance To Plan tiles, above Over and under plan.
    Sample data

    Insurance expense dashboard

    Are expenses running to plan by line and region?

    • Revenue
    • Budget revenue
    • Variance to plan
    Use template

Definition

What an insurance dashboard is

An insurance dashboard is one screen that shows whether the book is profitable and claims are handled well: earned premium, the loss ratio, the expense ratio and the combined ratio, by line of business and region, beside how long claims take to settle and how many are large or referred for fraud. The data usually comes from the policy administration system, the claims system and the general ledger.

  • Combined ratio

    Losses and expenses against premium, month by month.

  • By line of business

    The book that is pulling the ratio up.

  • Claims in view

    Settlement time, large claims and fraud referrals.

The metrics

The metrics an insurance dashboard is built from

Eight numbers. Most depend on a definition agreed first, such as whether premium is written or earned.

  • Earned premium

    How much premium have we earned?

    What the data needs

    Written premium spread over each policy's term, by line, region and month.

  • Loss ratio

    How much of the premium goes on claims?

    What the data needs

    Claims incurred, paid plus the change in reserves, against earned premium for the same period.

  • Expense ratio

    How much goes on running the business?

    What the data needs

    Acquisition and operating expenses from the ledger against premium.

  • Combined ratio

    Does underwriting make money?

    What the data needs

    Loss ratio plus expense ratio. Under 100 percent is an underwriting profit.

  • Days to settle

    How fast are claims paid?

    What the data needs

    Days from first notice of loss to settlement, by line and claim size.

  • Large claims

    How many claims are over our threshold?

    What the data needs

    Claims above an agreed amount, by line and region. They move the loss ratio more than volume does.

  • Fraud referrals

    How many claims are sent for investigation?

    What the data needs

    Claims referred to the fraud team by source of the referral, and what was found.

  • Retention

    Do policyholders renew?

    What the data needs

    Policies renewed against policies due, by line and by whether the customer claimed.

How to build one

How to build your own insurance dashboard

From one of the examples above to a live dashboard on your own data.

  1. 1

    Pick a template

    Start from any of the four boards above.

  2. 2

    Add your data

    Upload a spreadsheet, or connect one of 100+ tested connectors.

  3. 3

    Clean it once

    Fix and combine your data once. Mammoth repeats those steps for you.

  4. 4

    Set it to refresh

    The dashboard updates on a schedule and flags data that fails a check.

  5. 5

    Share the link

    Public, password-protected or sign-in only, on every plan.

Start with a template

14-day Pro trial · No credit card

FAQ

Insurance dashboard questions

Last reviewed against the template catalogue.

What should an insurance dashboard show?
Whether underwriting makes money and claims are paid well. That means earned premium, loss ratio, expense ratio and combined ratio by line and region, with settlement time, large claims and fraud referrals beside them. The boards above cover those, with the claims call centre and customer feedback.
What KPIs should an insurer track?
Gross written and earned premium, loss ratio, expense ratio, combined ratio, claims frequency and severity, days to settle and retention at renewal are the core. The list below shows each one with the data it needs.
How do I build an insurance dashboard?
Start with the ratios the monthly underwriting review already reports. Then follow five steps.
  1. Export earned premium by line, region and month from the policy system.
  2. Export claims incurred, paid and reserved, with open and settle dates, from the claims system.
  3. Add expenses from the general ledger at the same line and month.
  4. Agree whether the loss ratio includes loss adjustment expense, and write it down.
  5. Refresh monthly, with a view for each line of business.
What is a good combined ratio?
Under 100 percent means the insurer makes an underwriting profit: it pays out less in claims and expenses than it earns in premium. Most property and casualty insurers aim for the mid-90s; the useful comparison is your own lines against each other.
Where does insurance data come from?
Usually a policy administration system such as Guidewire or Duck Creek, a claims system, the general ledger and the contact centre. Mammoth has 100+ tested connectors, and can also connect to anything with a REST API. You combine the sources once, and Mammoth repeats the same steps on every refresh.
Can underwriters and claims teams see it without a licence?
Yes. Dashboard viewers are unlimited and free on every Mammoth plan, including the free one, so underwriters, claims handlers and the board can open it at no per-viewer cost. Only the people building the dashboards count as platform users.

Build the insurance dashboard you actually need.

Start from one of these templates or your own spreadsheet. Share it with as many people as you like, free.

  • ✓ 14-day Pro trial
  • ✓ No credit card
  • ✓ Viewers always free