Dashboards
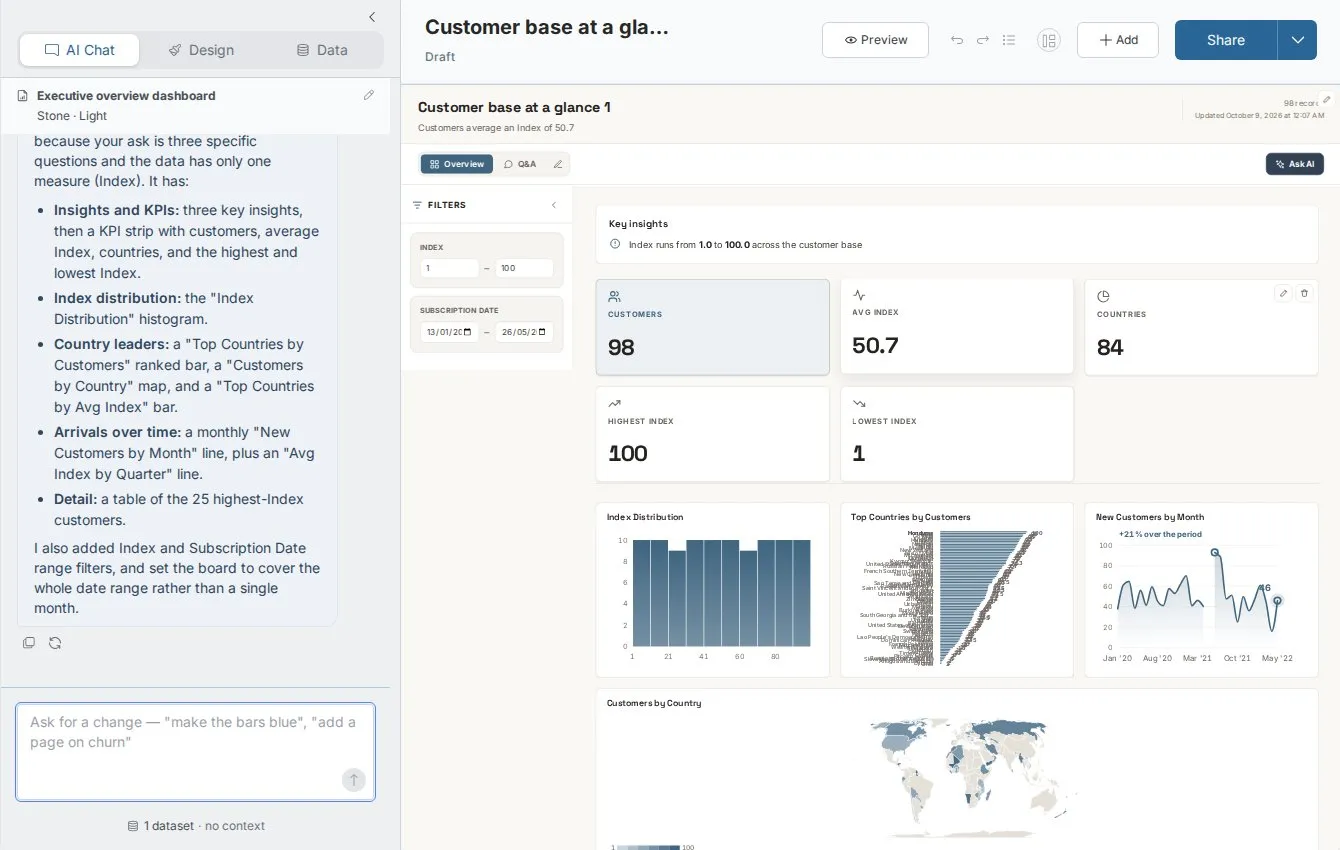
Dashboards turn the data in your Mammoth project into interactive, shareable visualizations, built through conversation with AI. Describe what you want to see, and the AI generates a styled dashboard. This section is for anyone who builds or shares reports; to start, read Creating dashboards.
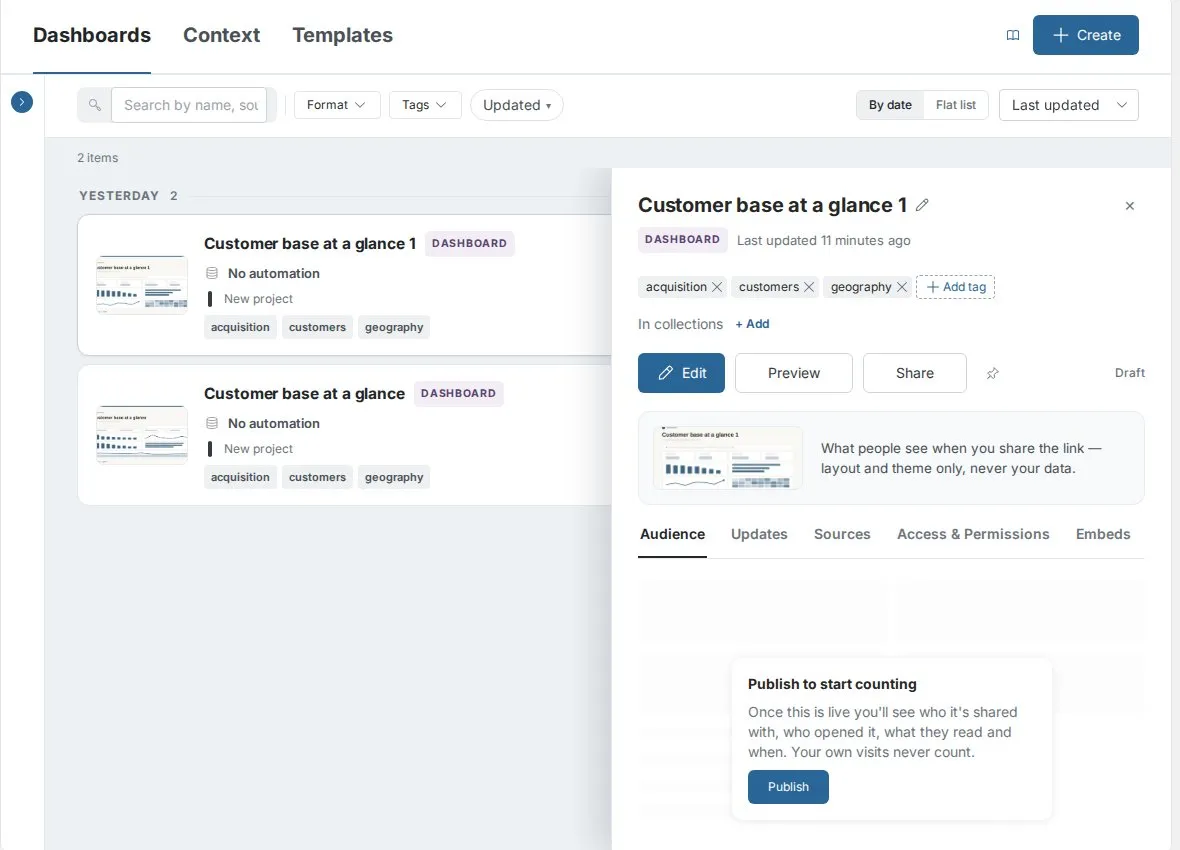
You open the library from Dashboards in the left sidebar. The page has three tabs: Dashboards, Context, and Templates. The Dashboards tab lists everything you can open, as a searchable library with a shelf of collections on the left. A details panel opens when you select a row.
What you can do
- Create with AI—Pick your data, choose a format, and describe what you want. The AI builds it from your columns
- Build four formats—Each item in the library is a Dashboard, Doc, Slides deck, or Q&A page
- Start from a template or an existing report—Use a template, copy one of your own, or bring a report over from a PDF, a screenshot, Power BI, or Tableau
- Filter and explore—Add dropdowns, chips, checklists, search boxes, range sliders, and a playable date timeline
- Organize across pages—Group related charts into pages, with top tabs or a left rail
- Choose a style—Pick a system style or build your own from your logo or website, in light or dark mode
- Publish and share—Share by link with signed-in users or anyone with the link, invite people by email, and see who views it in Audience
- Manage—Search, filter, tag, pin, archive, and group dashboards into collections
How it works
You pick the data a dashboard is built on, and the AI reads its column names, data types, and sample values. It then suggests the most relevant charts and filters for your data. You refine the result in the editor with the AI chat, the Design tab, and the Add menu.
Dashboards vs. other features
| Dashboards | Views | Published Views | |
|---|---|---|---|
| Purpose | Interactive visualization | Data preparation | Raw data sharing |
| AI-built | Yes | No | No |
| Shareable externally | Yes (2 modes) | No | Yes |
| Interactive filters | Yes | N/A | No |
| Best for | Executive reports, stakeholder updates | Data cleaning, transformation | Data exports |
Access
Everyone in a dashboard's project has access to it. You can also invite people outside the project by email, or publish it as Anyone with the link for clients and external stakeholders who don't have Mammoth accounts. Invited people are always viewers. See Publishing and sharing dashboards.
In this section
- Creating dashboards—How to start a dashboard with AI
- Dashboard filters—Filter controls and how they work
- Dashboard themes—Styles, modes, and branding
- Multi-page navigation—Organizing dashboards into pages
- Publishing and sharing dashboards—Sharing options and access control
- Managing dashboards—Finding, editing, syncing, and deleting