Date, Numeric & Text
The Date, Numeric & Text category handles transformations that work on the values inside your columns—converting and manipulating dates, building numeric calculations, and cleaning up text. Unlike display-level formatting, these are pipeline tasks: they modify your data and re-run every time the pipeline refreshes.
To open the function list, click the "Describe your transformation" bar (or a + button in the Pipeline panel) and select Date, Numeric & Text.
Date Tools
Add / Subtract Date Values
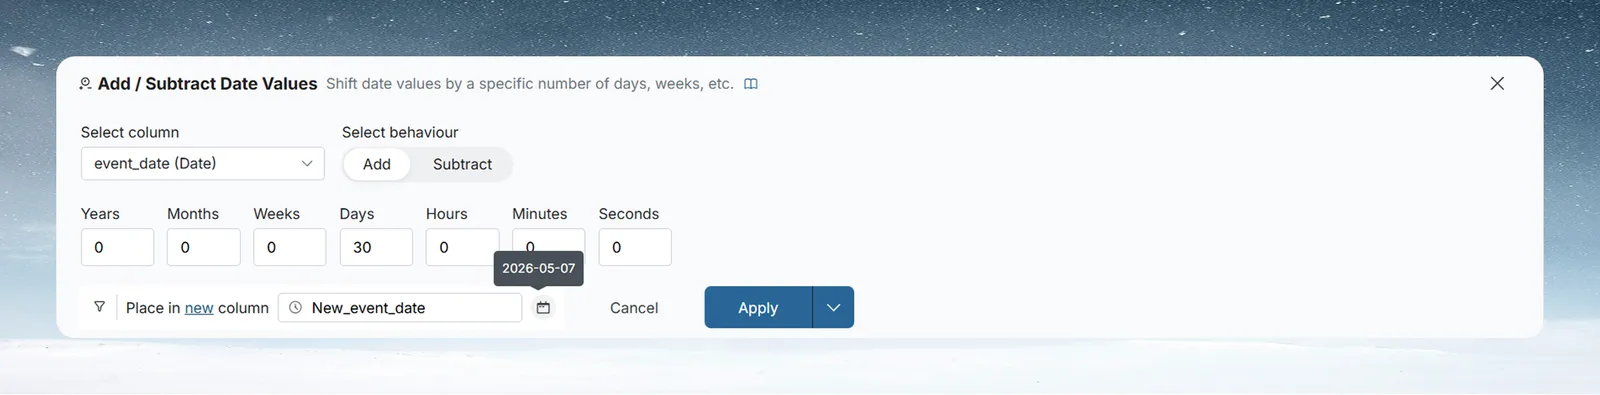
Add / Subtract Date Values shifts a date column forward or backward by a specified number of time units. Useful for calculating deadlines, expiry dates, or aligning dates across periods.
How to configure:
- Select column—choose the date column to shift.
- Select behaviour—choose Add or Subtract.
- Duration fields—enter a value in one or more of the time fields: Years, Months, Weeks, Days, Hours, Minutes, Seconds. Fields left at 0 are ignored.
- Date format—click the calendar icon next to the result column options to choose how the resulting date displays, with Universal, US, and UK format groups.
- Add Condition—optionally restrict the shift to rows that meet a condition.
- Place in—choose New Column and enter a name, or choose Existing Column and select the column to overwrite from the dropdown.
Example: To calculate a review date 30 days after a contract start, select contract_start, choose Add, enter 30 in the Days field, and name the new column review_due.
Extract Date Part
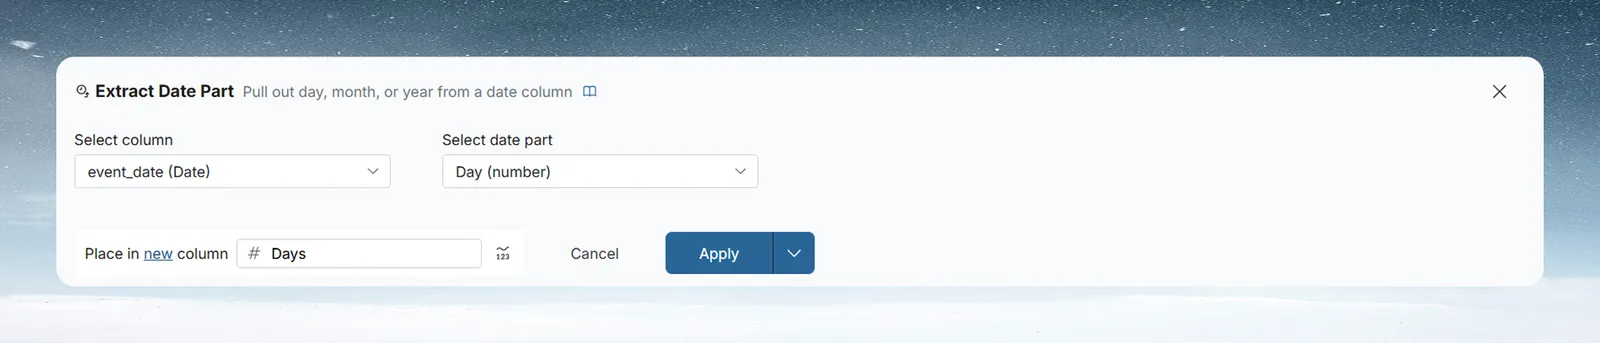
Extract Date Part pulls a single component out of a date column—year, month name, week number, weekday, hour, and more—and writes it as a new column.
How to configure:
- Select column—choose the date column to extract from.
- Select date part—choose the component to extract. The following parts are available:
| Date part | Returns |
|---|---|
| Year (number) | e.g. 2024 |
| Quarter (number) | e.g. 1, 2, 3, 4 |
| Month (number) | e.g. 1–12 |
| Month name (text) | e.g. "March" |
| Week of the year (number) | e.g. 1–52 |
| Weekday (text) | e.g. "Monday" |
| Day (number) | e.g. 1–31 |
| Day of year (number) | e.g. 1–365 |
| Hour (number) | e.g. 0–23 |
| Minutes (number) | e.g. 0–59 |
| Seconds (number) | e.g. 0–59 |
| Millisecond (number) | e.g. 0–999 |
| Time without milliseconds (text) | e.g. "14:40:45" |
| Time with milliseconds (text) | e.g. "14:40:45.123" |
| Year & Month (text) | e.g. "2024 March" |
| Year & Month Number (text) | e.g. "2024-03" |
| Date part without time (date) | Date value with time stripped |
| Date part without time (text) | Same, returned as text |
Example: To group sales by month, extract Month name from your order_date column. The new column will contain values like "January", "February"—ready to use as a group-by dimension in a pivot.
Calculate Date Difference
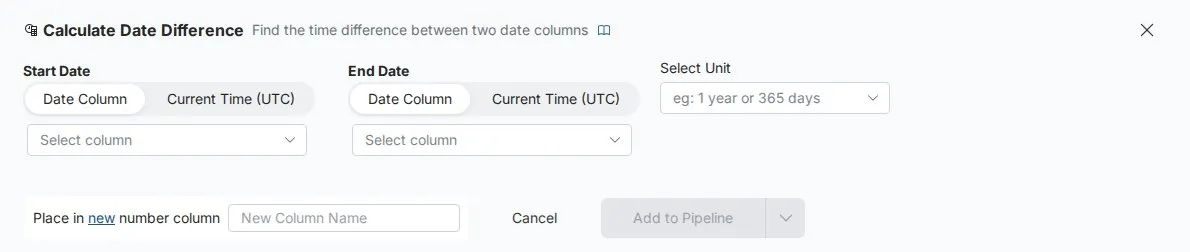
Calculate Date Difference finds the time between two dates and returns the result as a number. Either end of the calculation can be a date column or the current time (UTC).
How to configure:
- Start Date—select Date Column and choose a column, or select Current Time (UTC). When Current Time (UTC) is selected, the column dropdown disappears.
- End Date—same options as Start Date.
- Select Unit—choose the unit for the result, such as years or days.
- Place in—choose New Column and enter a name, or choose Existing Column and select the column to overwrite.
Only date-type columns appear in the dropdowns. If your dates are stored as text, use Convert Column Type in Column Management first.
Example: To measure how long orders take to ship, set Start Date to order_date, End Date to ship_date, unit to Days, and name the output days_to_ship. To show how many days have passed since each customer signed up, set Start Date to signup_date and End Date to Current Time (UTC).
Numeric Tools
Math Function
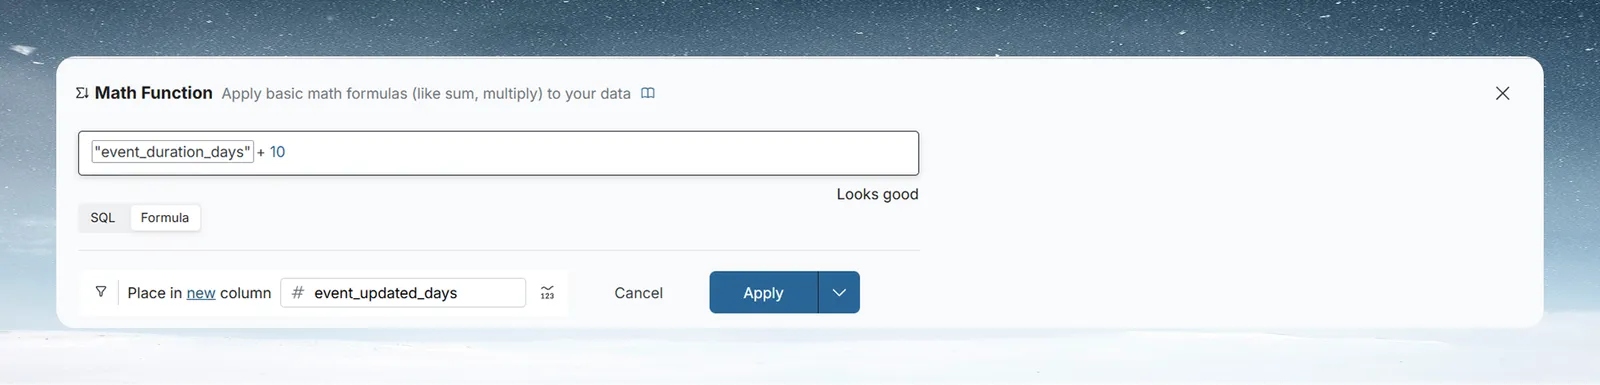
Math Function creates a calculated column by evaluating a formula across your data row by row. As you type in the expression field, Mammoth suggests available functions and column names—select any suggestion to insert it.
How to configure:
- Expression field—type your formula using column names in double quotes, arithmetic operators (+, −, *, /), and parentheses. An autocomplete list appears as you type—select a column name or function to insert it.
- Place in—choose New Column and enter a name, or choose Existing Column to overwrite one. Use the format controls on the right to set the number format.
Built-in functions: COUNT() · SUM("Column") · AVG("Column") · MIN("Column") · MAX("Column") · STDDEV("Column") · INT(expression) · ABS(expression)
Examples:
"unit_price" * "quantity_sold"—calculates line revenue per row("actual" - "target") / "target" * 100—percentage variance against targetINT("total_revenue" / 12)—monthly average rounded to a whole number
Window Function
Window Function runs a calculation across your data while keeping every row intact. Where Group & Pivot produces one summary row per group, a window function adds the result as a new column alongside the original rows—the right choice for rankings, running totals, and row-to-row comparisons.

How to configure:
- Select function—choose the function to apply. Available functions: Sum, Average, Min, Max, Standard Deviation, Variance, Count, Row number, Rank, Dense rank, Percent rank, Cumulative percent rank, N tile, First Value, Last value, Nth value, Lead, Lag.
- Select column—choose the column to run the function on. It is shown for Sum, Average, Min, Max, Standard Deviation, Variance, First Value, Last value, Nth value, Lead and Lag. Count, Row number, Rank, Dense rank, Percent rank, Cumulative percent rank and N tile need no source column.
- Value of N—shown for N tile and Nth value. N tile needs a whole number of 2 or more; Nth value needs a whole number of 1 or more.
- Type—shown for Sum, Average, Min, Max, Standard Deviation, Variance, Count, First Value, Last value, Nth value and N tile. The default is Accumulate:
- Accumulate—builds the result row by row. For example, running a Sum on values 5, 10, and 15 produces 5, 15, and 30.
- Aggregate—calculates a single summary for a group and stamps it on every row in that group. For instance, if a group's total is 30, every row in that group shows 30.
- Offset—shown for Lead and Lag: a whole number of 1 or more.
- Limit ranking result—for Row number, Rank and Dense rank, turn on this toggle to enter Limit to following no. of rows and keep only the top ranks.
- Group by—partitions the calculation within groups—for example, ranking rows within each region separately rather than across the whole dataset.
- Add Sort—defines the order rows are processed. It appears for Row number, Rank, Dense rank, Percent rank, Cumulative percent rank, Lead and Lag, and for the other functions when Type is Accumulate.
- Place in—give the new column a name, or choose an existing column to overwrite.
Example: To rank customers by revenue within each region, select Rank, click Group by and select region, then click Add Sort, choose revenue and sort descending. Every customer row gets a rank relative to their region, not the whole dataset.
Obtain Large or Small Values
Obtain Large or Small Values compares a set of numeric columns row by row and returns the Nth largest or smallest value. You can include a fixed number in the comparison alongside the column values.
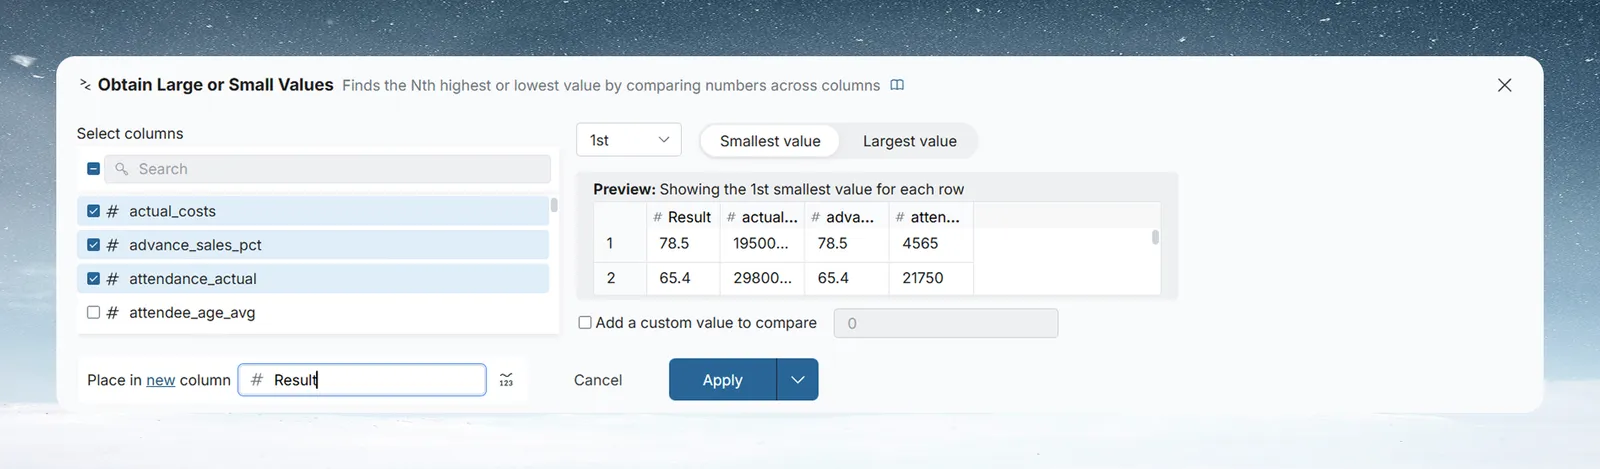
How to configure:
- Select columns—check the numeric columns to compare (at least two). Use the search box to find columns quickly.
- Select Nth—set the rank to return: 1st, 2nd, 3rd, and so on.
- Largest value / Smallest value—choose the direction of the comparison.
- Add a custom value to compare—optionally include a fixed number in the comparison. It is treated as an additional column and appears in the Preview as its own column.
- Preview—updates in real time to show the result for each row as you configure.
- Place in—give the output column a name, or choose an existing column to overwrite.
Example: If you have three supplier price columns—supplier_a_price, supplier_b_price, supplier_c_price—select all three, set ordinal to 1st, and choose Smallest value. The result column shows the cheapest quote for each row, making it easy to identify the best supplier per product.
Text Tools
Extract Text
Extract Text pulls a specific pattern of text out of a column. You can describe what you want in plain language and let Mammoth build the pattern, or select a method and configure it directly.
How to configure:
- Select column—choose the text column to extract from.
- Select extraction method—choose how to define the pattern. The default is Custom Prompt.
- Add Condition—optionally restrict the extraction to rows that meet a condition.
- Place in—choose New Column and enter a name, or choose Existing Column.
Extraction methods
Custom Prompt—Describe what you want to extract in plain language and click Generate. Mammoth builds a regex pattern automatically and shows a live example using real values from your column—for example, "Cotton T-Shirt will result in Shirt." To adjust the generated pattern, click the edit icon next to the regex to open the Edit Regex modal, modify the Regex Formula field, and click Save changes.
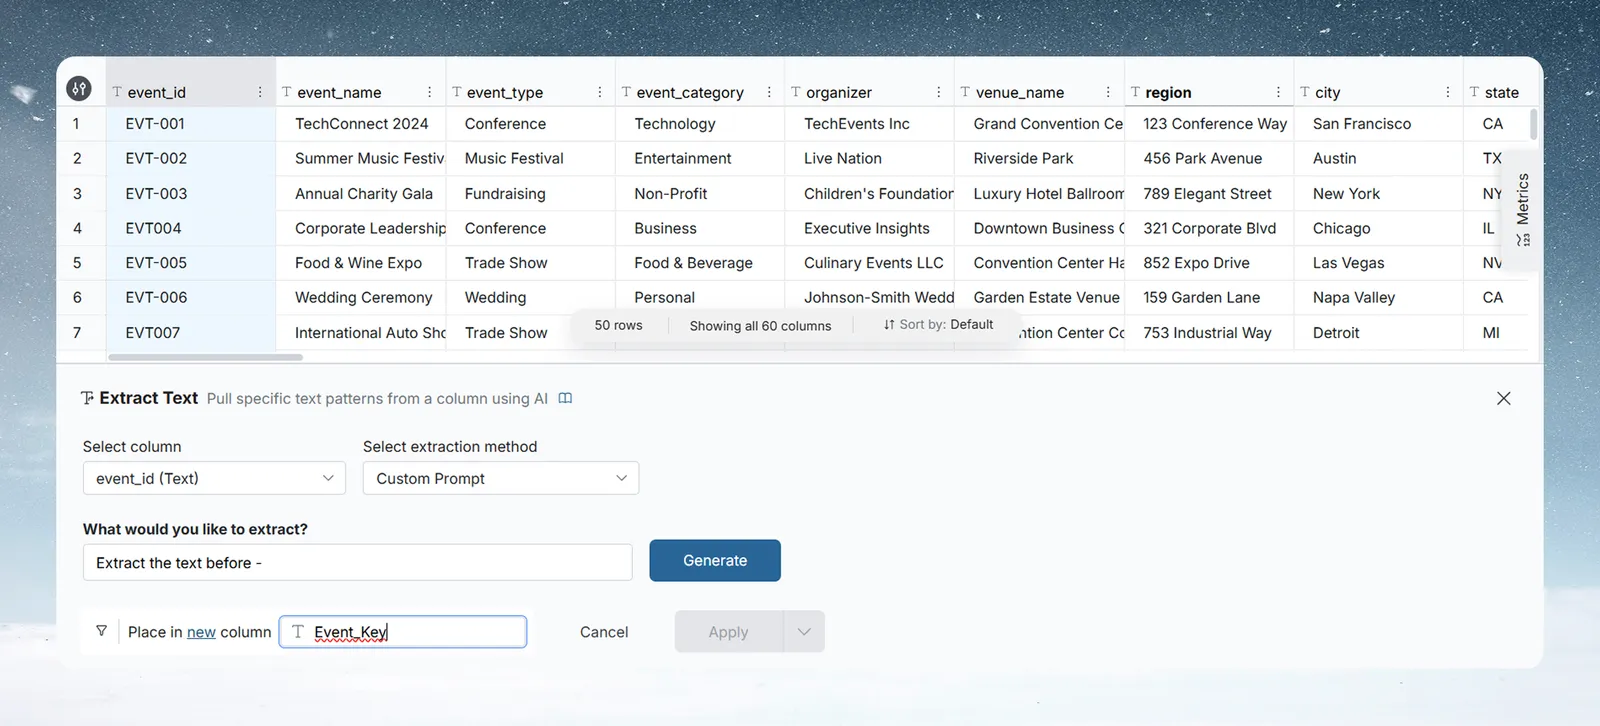
Pattern-based methods—Choose a method such as Characters from beginning or to end, Characters in a certain position, Starts with, Ends with, Contains a number, or similar. The panel shows a small set of inputs specific to that method—a direction, a character count, or a match value. An inline example updates in real time using actual data from your column.
The full list of pattern-based methods: Characters around a letter / word, Characters from beginning or to end, Characters in a certain position, Contains a number, Does not contain a number, Does not end with, Does not end with a number, Does not start with, Does not start with a number, Ends with, Ends with a number, Starts with, Starts with a number.
Regular expression / All except regular expression—Enter a regex pattern directly in the text field. Regular expression extracts text that matches the pattern. All except regular expression extracts everything that does not match. An inline example updates as you type.
Example: On a product_code column containing values like "REF-2045 Blue Widget", use Custom Prompt with the description "extract the code before the first space" to get "REF-2045" in a new column. For a more structured case—extracting the first 3 characters of every value—use Characters from beginning or to end, set direction to Beginning, and enter 3.
Text Formatting
Text Formatting standardizes the capitalization or spacing of one or more text columns. You can apply it to several columns at once and restrict it to specific rows using a condition.
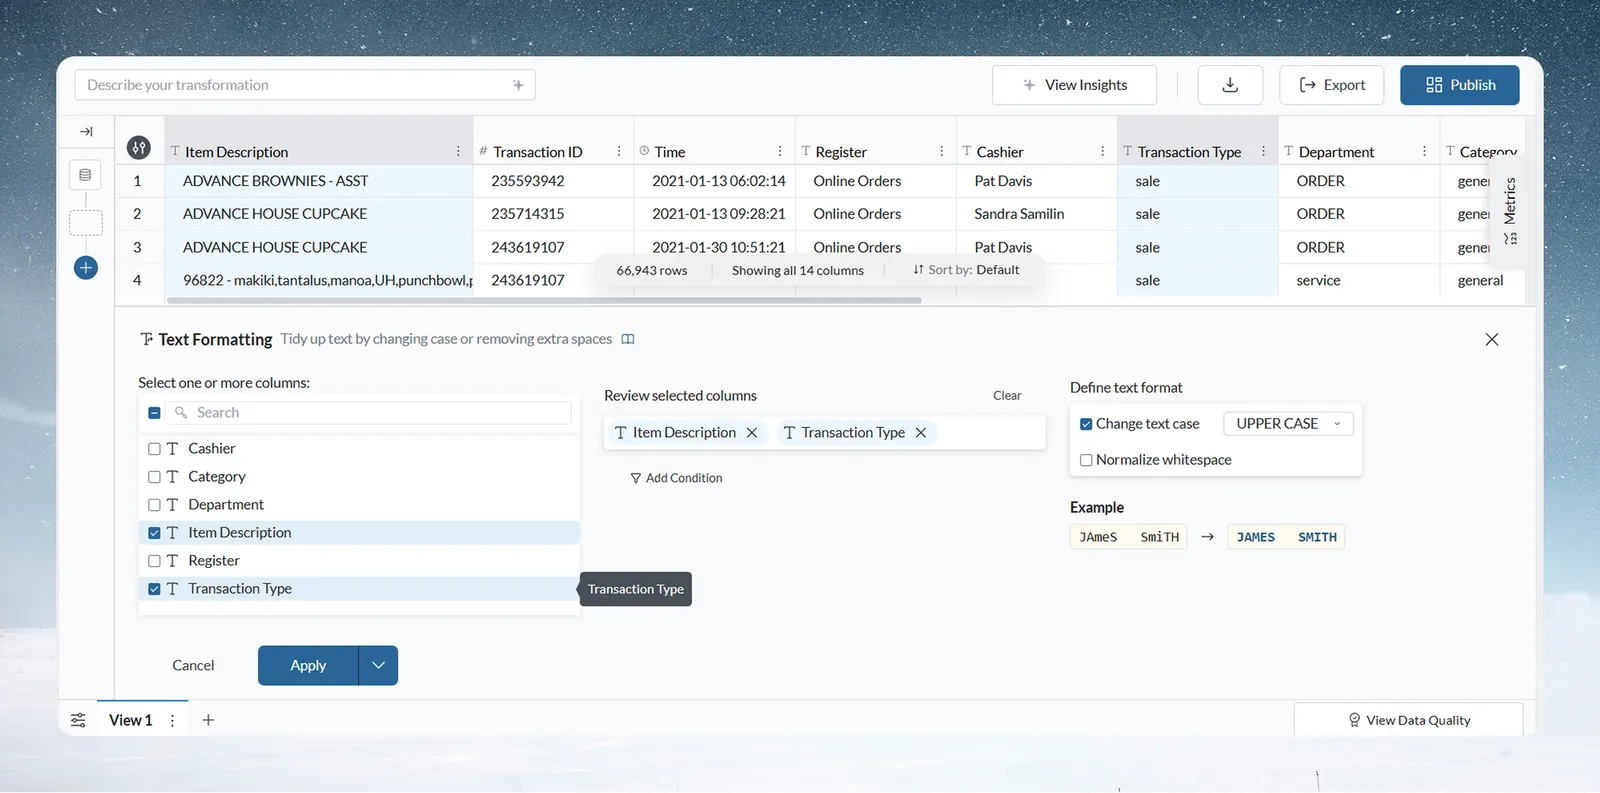
How to configure:
- Select columns—check one or more text columns from the list. Selected columns appear as chips in the Review selected columns area. Click the X on a chip to remove it, or click Clear to deselect all.
- Add Condition—optionally restrict the formatting to rows that meet a condition.
- Change text case—tick the checkbox and choose UPPER CASE, lower case, or Capital Case from the dropdown.
- Normalize whitespace—tick the checkbox to strip leading, trailing, and extra spaces between words.
- The preview on the right updates as you configure. Check it before applying.
Example: A category column imported from an external system contains "shirts", "Shirts", and "SHIRTS" for the same product type. Applying UPPER CASE standardizes all values to "SHIRTS"—preventing mismatches when joining this dataset with another source.
Extract JSON
Extract JSON expands JSON-formatted data stored in a column into structured columns or individual rows. The panel adapts based on the structure of your JSON and how you want to extract it.
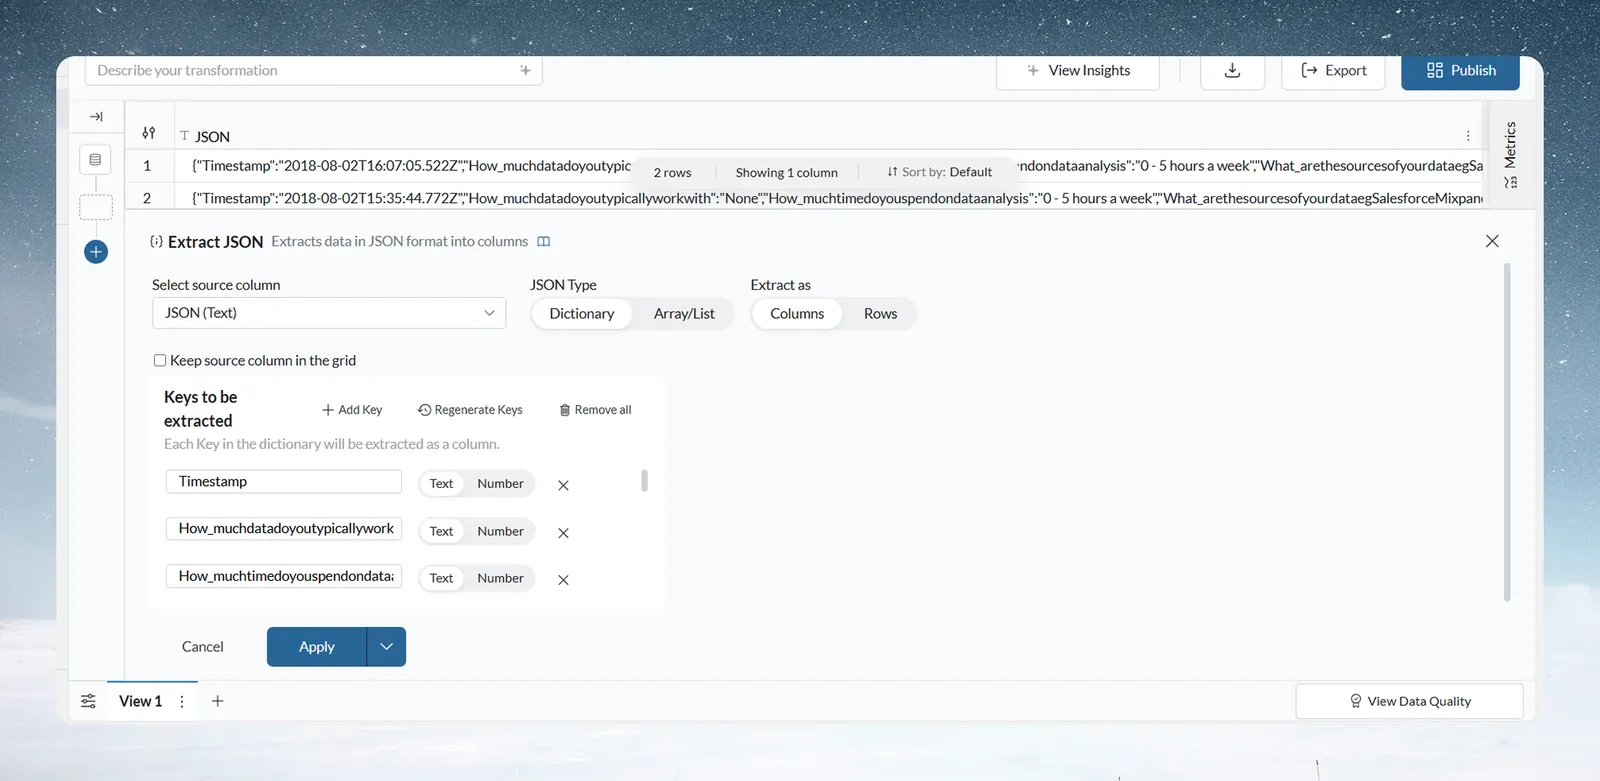
How to configure:
- Select source column—choose the column containing your JSON data.
- JSON Type—choose the structure:
- Dictionary—named key-value pairs, for example
{"city": "London", "country": "UK"} - Array/List—an ordered list, for example
["London", "UK", "Europe"]
- Dictionary—named key-value pairs, for example
- Extract as—choose Columns to create one column per value, or Rows to expand each value into a separate row.
- Keep source column in the grid—tick to retain the original JSON column alongside the extracted output.
- Keys to be extracted—this section changes based on your selections:
- Dictionary → Columns: Click Add Key, type the key name, and set its output type to Text or Number. Repeat for each key. Use Regenerate Keys to detect keys automatically, or Remove all to clear the list.
- Array/List → Columns: Enter the number of columns to create (up to 20) and choose a single output type—Text or Number—for all of them.
- → Rows: Choose the output column type—Text or Number. No key configuration is needed.
Example: A shipping_address column contains {"city": "London", "postcode": "EC1A", "country": "UK"} for each row. Select Dictionary → Columns, add three keys—city (Text), postcode (Text), country (Text)—and apply. Each key becomes its own column, making address data immediately usable for filtering and grouping.