Explore Cards
Explore Cards are interactive cards that show what is inside a column: the distinct values of a text column, the distribution of a numeric column, or the timeline of a date column. You choose the columns to explore, then click values on a card to filter the grid.
Use them to see what is in your data and spot problems before you build any transformation.
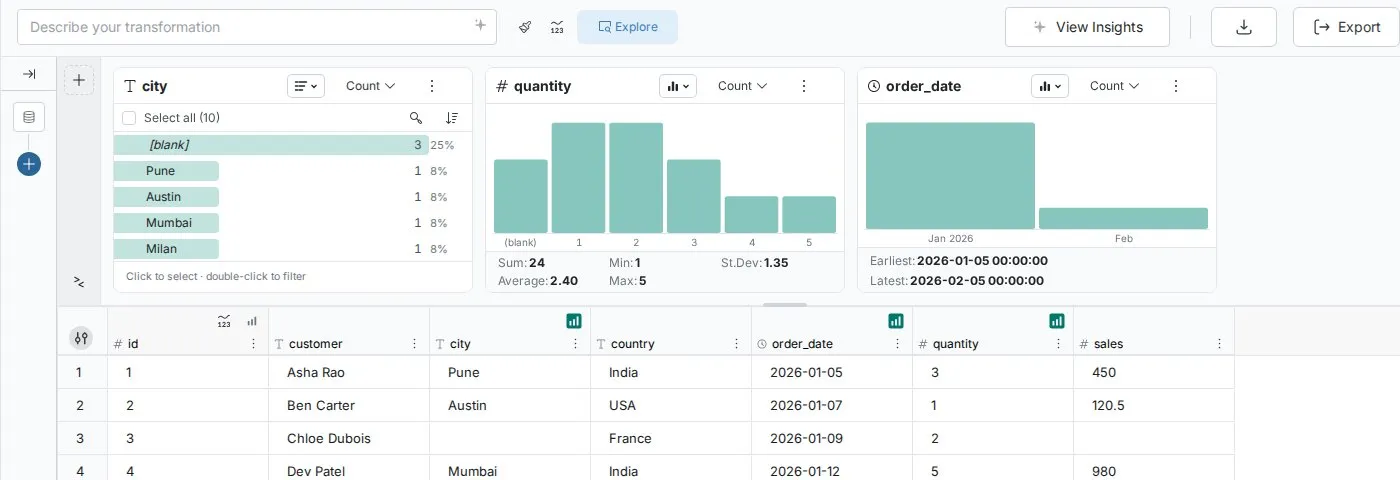
Open the Explore panel
The Explore panel sits above the data grid. Use the Explore toggle in the action bar to show or hide it. When explore filters are active, a filter badge with a count appears beside the toggle, and each filtered card shows its filter as a pill in the card header.
A View with no cards yet shows No cards yet and the hint "See what's in any column, then click values to filter the grid." Mammoth may offer a few Suggested columns to start from.
Add cards
You add the cards you want, and Mammoth remembers them for the View. Use the Add card button on the left of the panel to open the Explore a column list, find a column with Search columns, and select it.
The same menu also adds three other kinds of card, each with its own menu entry (Describe a filter in plain words, Search all columns and Compare two number columns):
- Ask—describe the rows you want in plain words, for example "channel is Amazon and quantity over 2", and Mammoth turns it into a filter
- Search—search every column for a word, with matches highlighted in the grid
- Compare—plot one number column against another in a scatter chart. It needs at least two number columns in the View
Drag a card by its header to reorder it, drag its edge to change its width, and close it with Close card. To resize the panel, drag its edge or choose a panel height (small, medium, or large).
Card types
Each column card matches the data type of its column.
Text columns show a ranked list of distinct values sorted by frequency, each with a horizontal frequency bar and percentage share. You can also switch to a donut or treemap view. These are ideal for spotting category inconsistencies, missing data, and standardization opportunities.
Numeric columns show a bar chart of value ranges (the Columns view) with a five-statistic summary, or a list of the same ranges. These reveal distribution shape, outliers, and data quality issues.
Date columns show a bar chart of time periods (the Columns view), a timeline, or a list, with the earliest and latest values below. These expose seasonality, missing periods, and business cycle patterns.
Switch between views with the chart type dropdown in the card header.
For details on each card type, see:
How Explore Cards work
Each card queries the View, so cards describe the View's data after its pipeline. Cards react to your selections: when you filter on one card, the cards to its right recalculate on the filtered rows. See Explore Cards—Interactions.
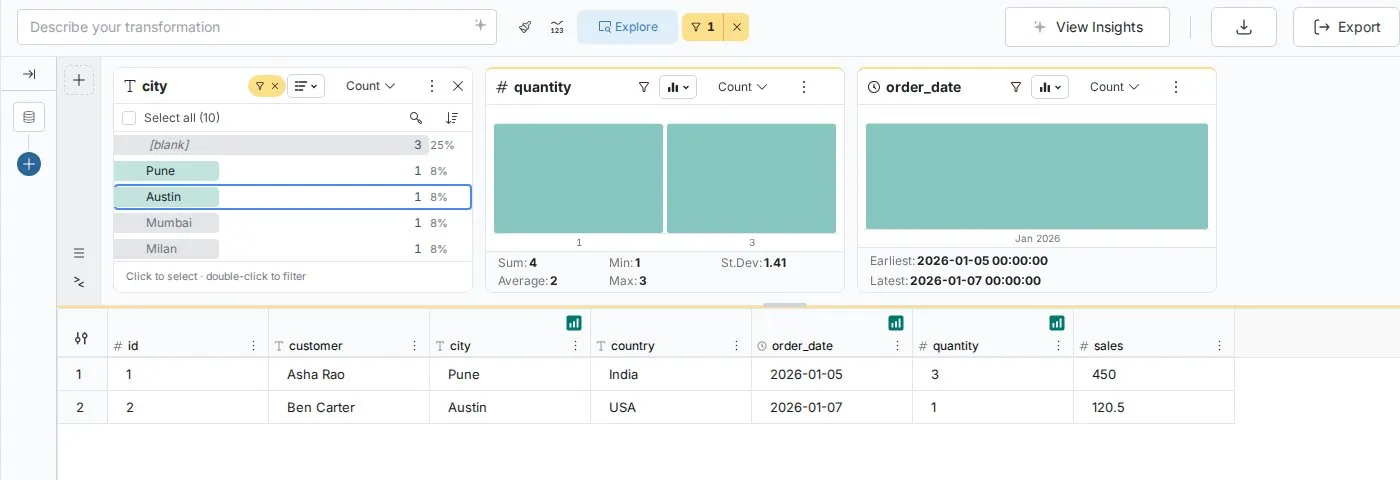
Data quality detection
Explore Cards surface quality issues. Blank values appear at the top of text cards so completeness gaps are immediately visible. Outliers stand out at the extremes of numeric bar charts. Missing time periods show as gaps in date charts.
After you load new data, scan the Explore Cards for your key columns as a quick quality check.
Interacting with Explore Cards
Clicking values in Explore Cards filters your data so you can investigate patterns across columns. For the full details, see Explore Cards—Interactions.
Next steps
- Text column cards—Understand categorical distributions and fix text quality issues
- Numeric column cards—Analyze distributions, statistics, and numeric outliers
- Date column cards—Discover temporal patterns and validate date data
- Explore Cards—Interactions—Filter, investigate, and convert discoveries into pipeline tasks