Conditional Highlights
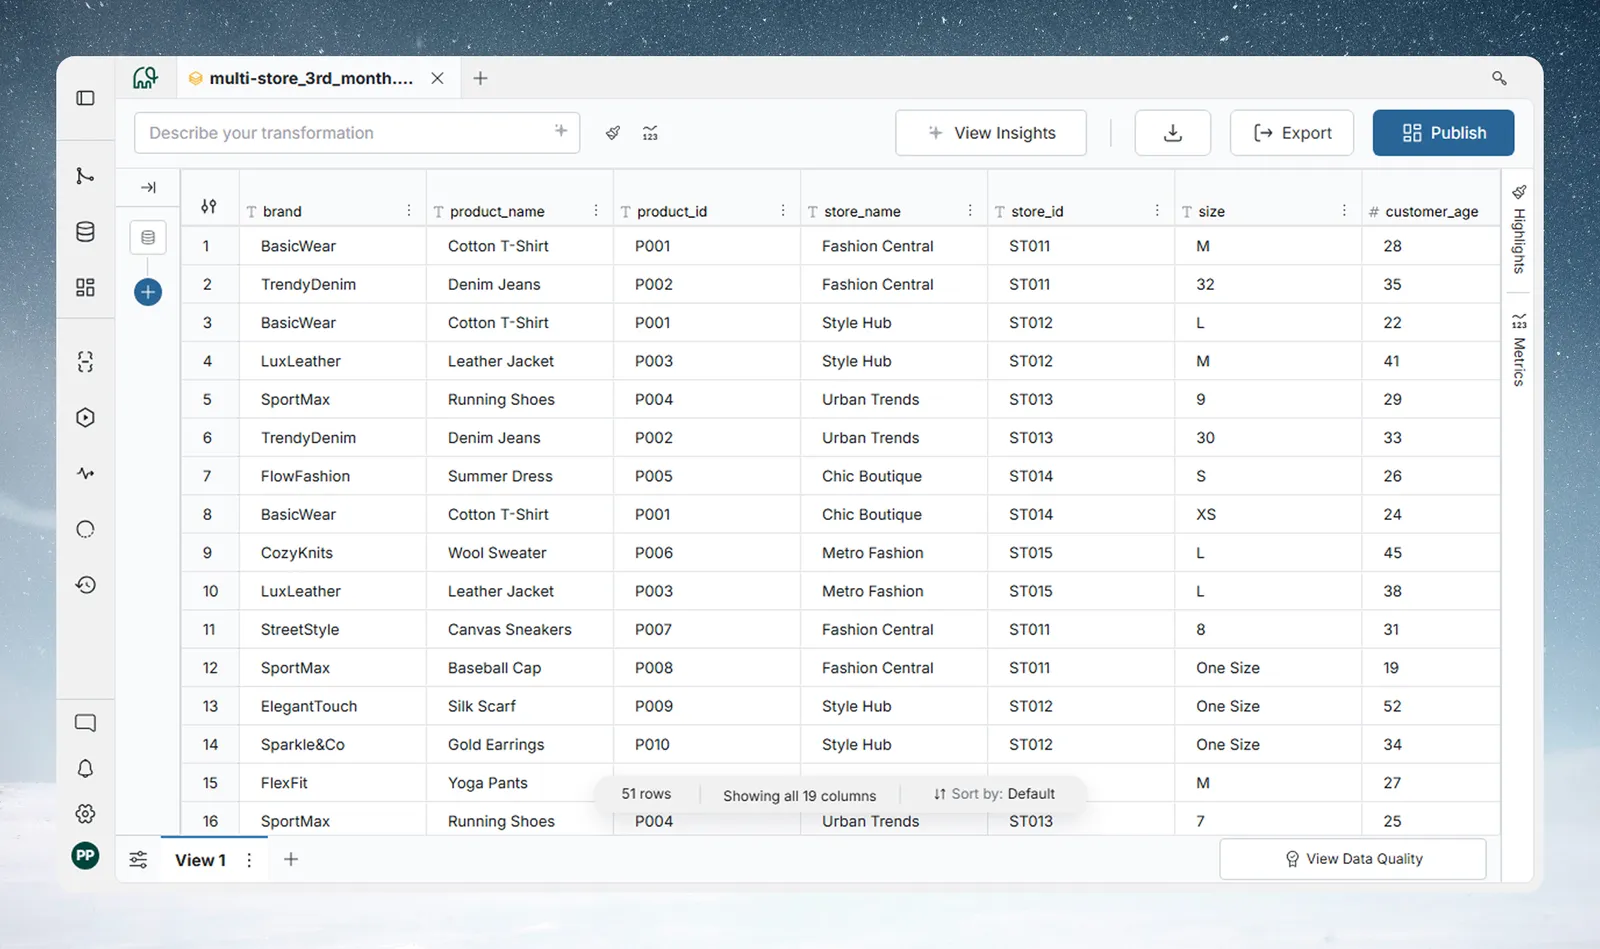
Conditional Highlights lets you apply color-based formatting rules to rows or cells in a View. Rules are evaluated in real time as you interact with the grid, and they don't add a pipeline task.
Use them to flag outliers, track KPIs, compare performance against thresholds, or make any pattern in your data visible at a glance.
There are two rule types:
| Rule type | What it does | Best for |
|---|---|---|
| Condition Rule | Applies a solid color to rows or cells that match a logical condition | Flagging specific values, thresholds, categories |
| Color Scale | Applies a gradient across a numeric or date column based on its value range | Visualizing performance distributions, rankings |
Rules are saved to the View and are visible to everyone who accesses it. They are not personal or session-scoped.
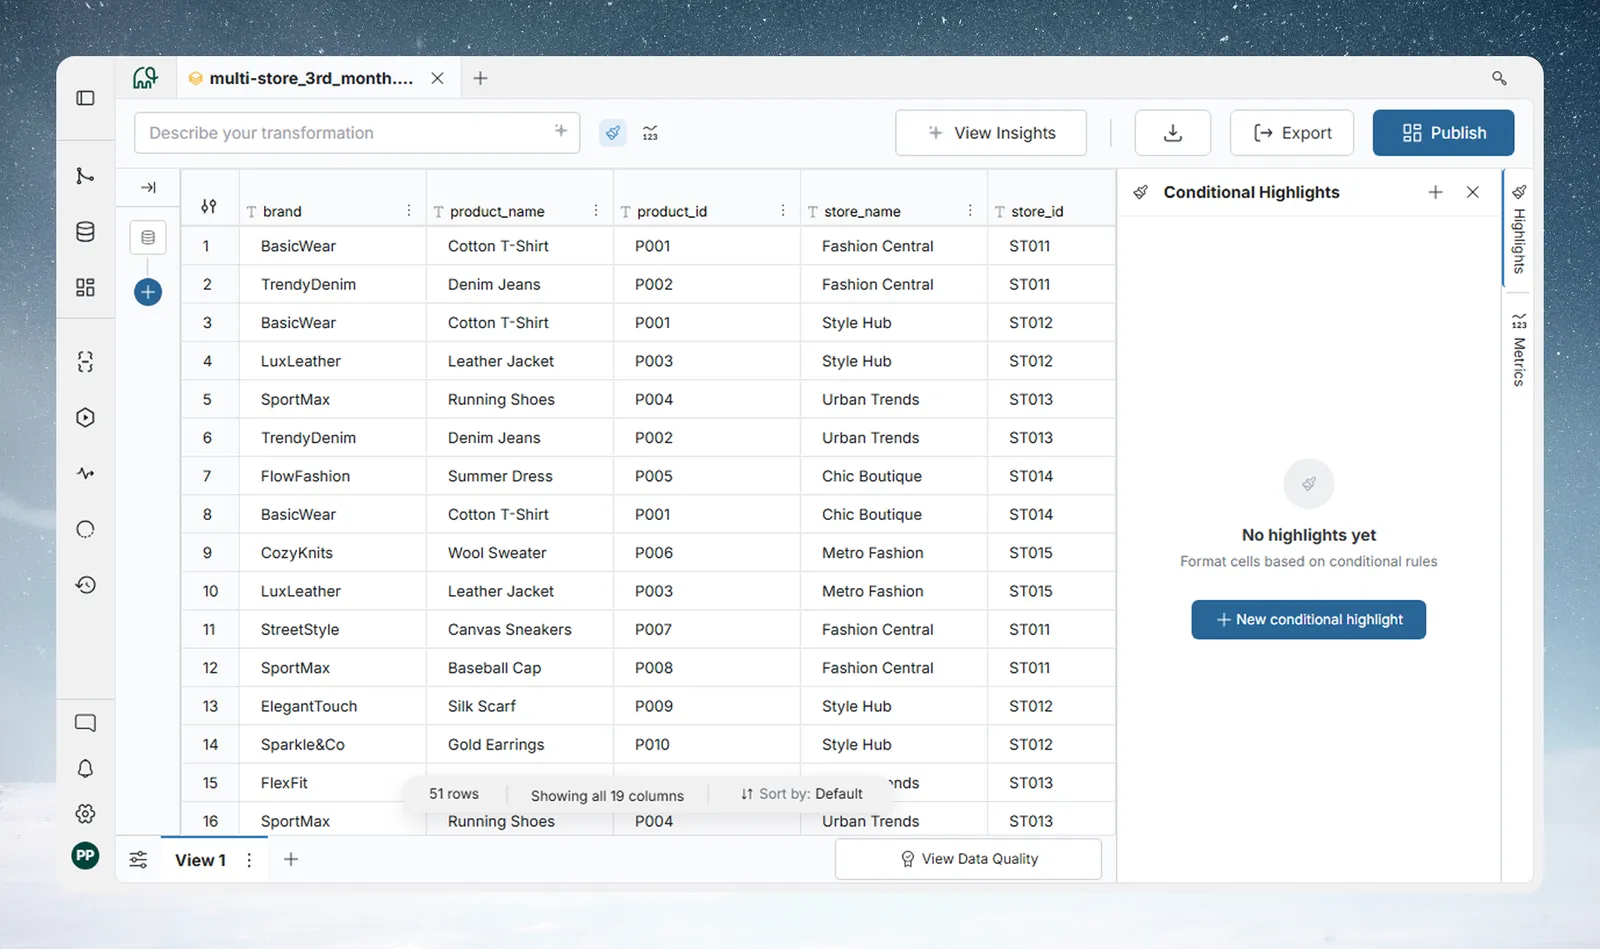
Open the Conditional Highlights panel
The panel opens beside the data grid. Two ways to open it:
- Action bar: Click the brush icon (tooltip Conditional Highlights) in the action bar at the top of the View. The Highlights tab on the right edge of the View also opens it.
- Column menu: Open a column's 3-dot menu and select Conditional Highlights. This also pre-selects that column in the rule builder.
Create a Condition Rule
A Condition Rule applies a solid color when a row matches a logical condition you define.
To create a Condition Rule:
- Click New conditional highlight in the panel.
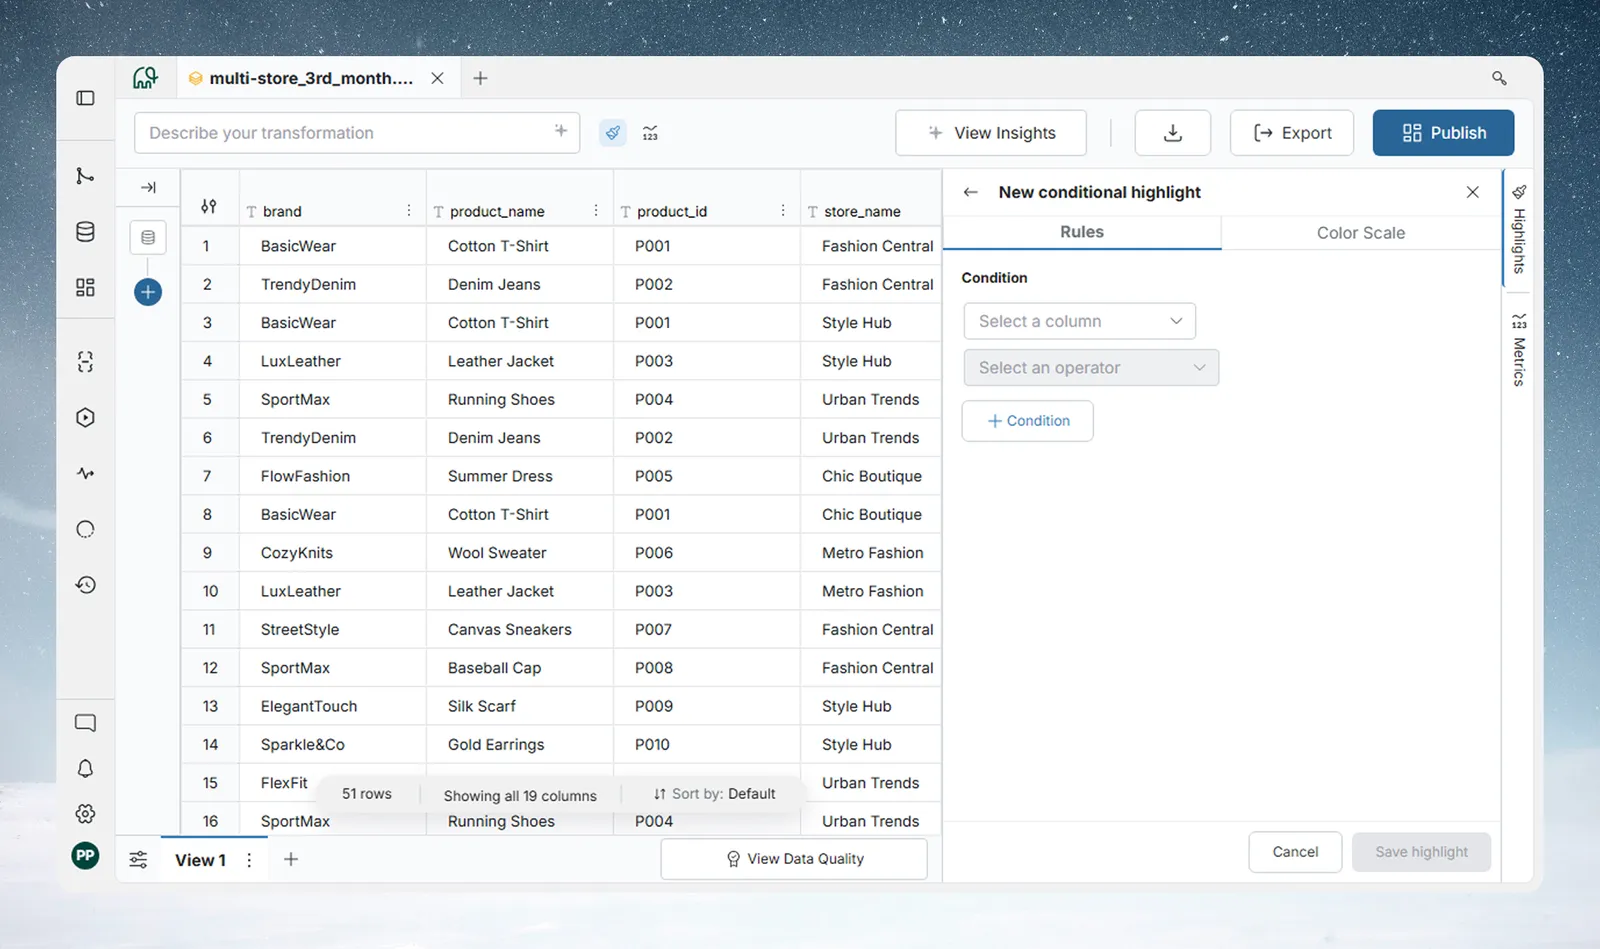
- The rule builder opens on the Rules tab.
- Build your condition: select a column, choose an operator, and enter a value.
- Choose what gets highlighted: Cells or Entire row.
- Select a color swatch.
- Click Save highlight.
Build the condition
Each condition has at least one row: a column, an operator, and a value.
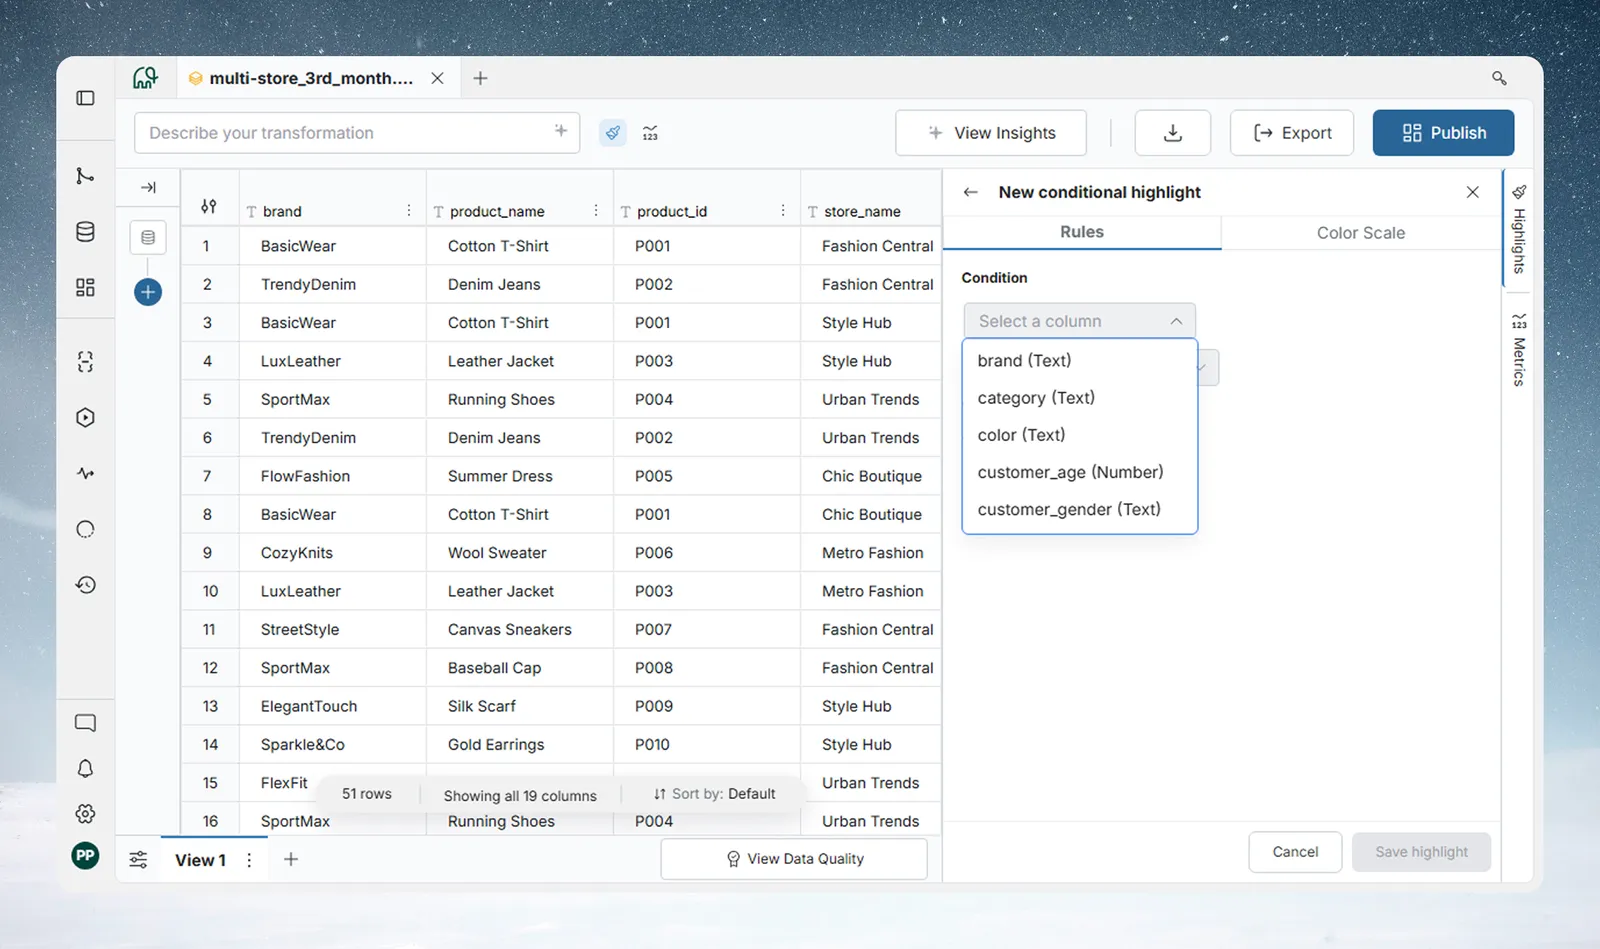
You can combine multiple conditions using And (all conditions must match) or the Or operator (any condition can match). Click Condition to append another condition. Click Group to create nested groups—for example, (Region = "West" OR Region = "East") AND Sales > 5,000.
The condition builder is the same one used by Conditional Filter, so the same operators are available for Text, Number, and Date columns. For the full operator tables, see Conditional Filter in Filter, Label & Replace. The AI generation bar is not available in the highlight builder.
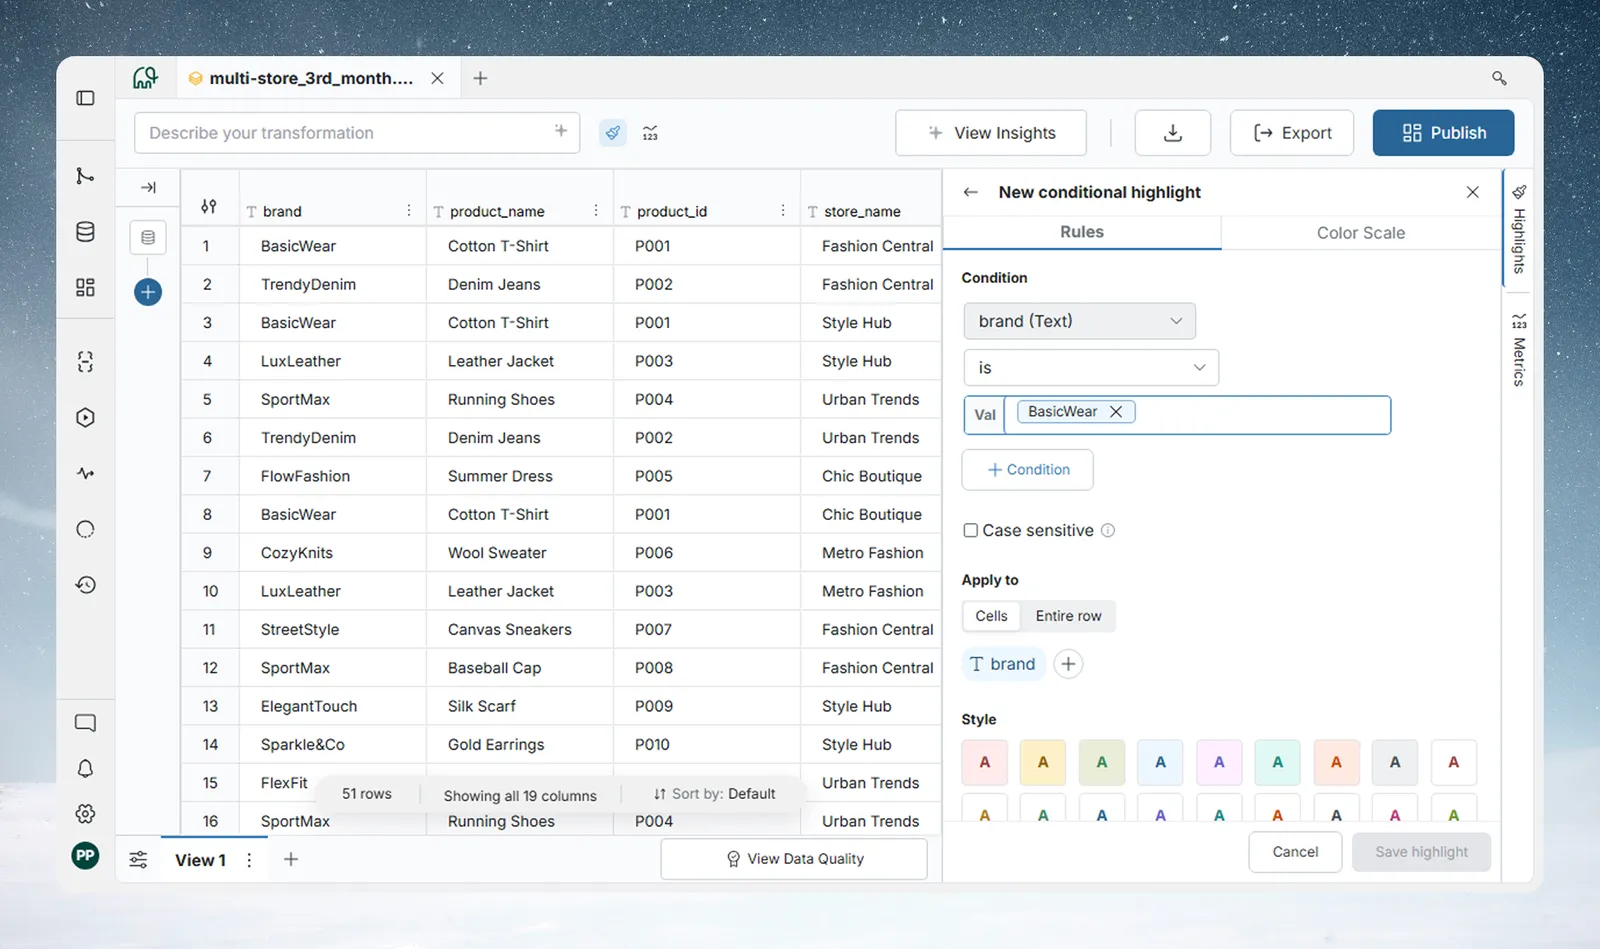
Live preview: While the builder is open, the grid reflects your in-progress rule in real time—but only when the condition is valid and a color has been selected. An incomplete rule does not flash on the grid.
Choose what to highlight: Cells or entire row
The Apply to selector in the builder controls the scope of the color:
| Setting | What gets colored |
|---|---|
| Cells (default) | Only the cells in the columns you select |
| Entire row | Every cell in the matching row receives the color |
When Cells is chosen, the builder pre-selects the first column referenced in your condition. Use the column picker below the selector to add or remove columns from the highlight—this is independent of the condition columns. You can highlight a different set of columns than the ones the condition tests against.
Pick a color
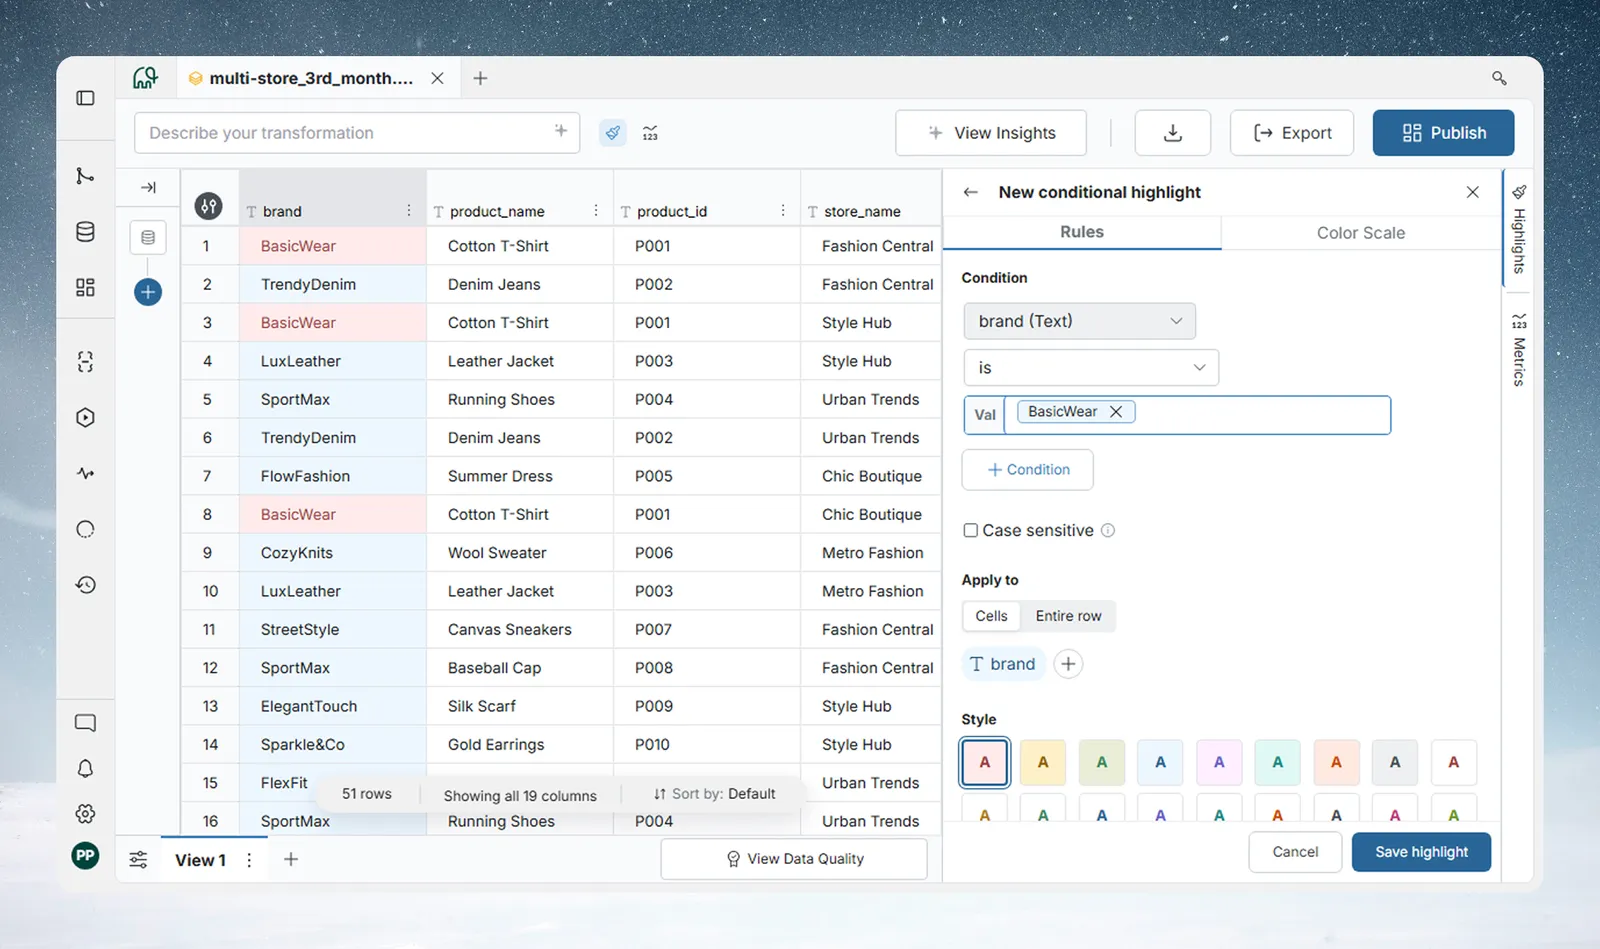
Choose from 18 preset swatches. Colors are divided into two groups:
- Background colors (8): apply a background fill to matching cells.
- Text-only colors (10): change only the font color; no background fill is applied.
Rule titles
Rules are not named. Each rule card shows an auto-generated summary of the condition (for example, brand is 'BasicWear').
If you close the builder without saving, any in-progress rule is discarded. A confirmation prompt appears if you have made changes.
Create a Color Scale
A Color Scale applies a gradient to cells in a numeric or date column, blending the color smoothly across the column's value range.
Availability: The Color Scale tab may not be visible in your workspace. If you do not see it, contact your workspace admin.
To create a Color Scale:
- Click New conditional highlight in the panel.
- In the rule builder, click the Color Scale tab.
- Select a column—only visible Numeric and Date columns appear in the dropdown.
- Choose a scale preset.
- For 3-stop scales, optionally set a Colors change at value to shift the midpoint.
- Optionally, enter custom Min and Max values to override the auto-detected range.
- Click Save highlight.
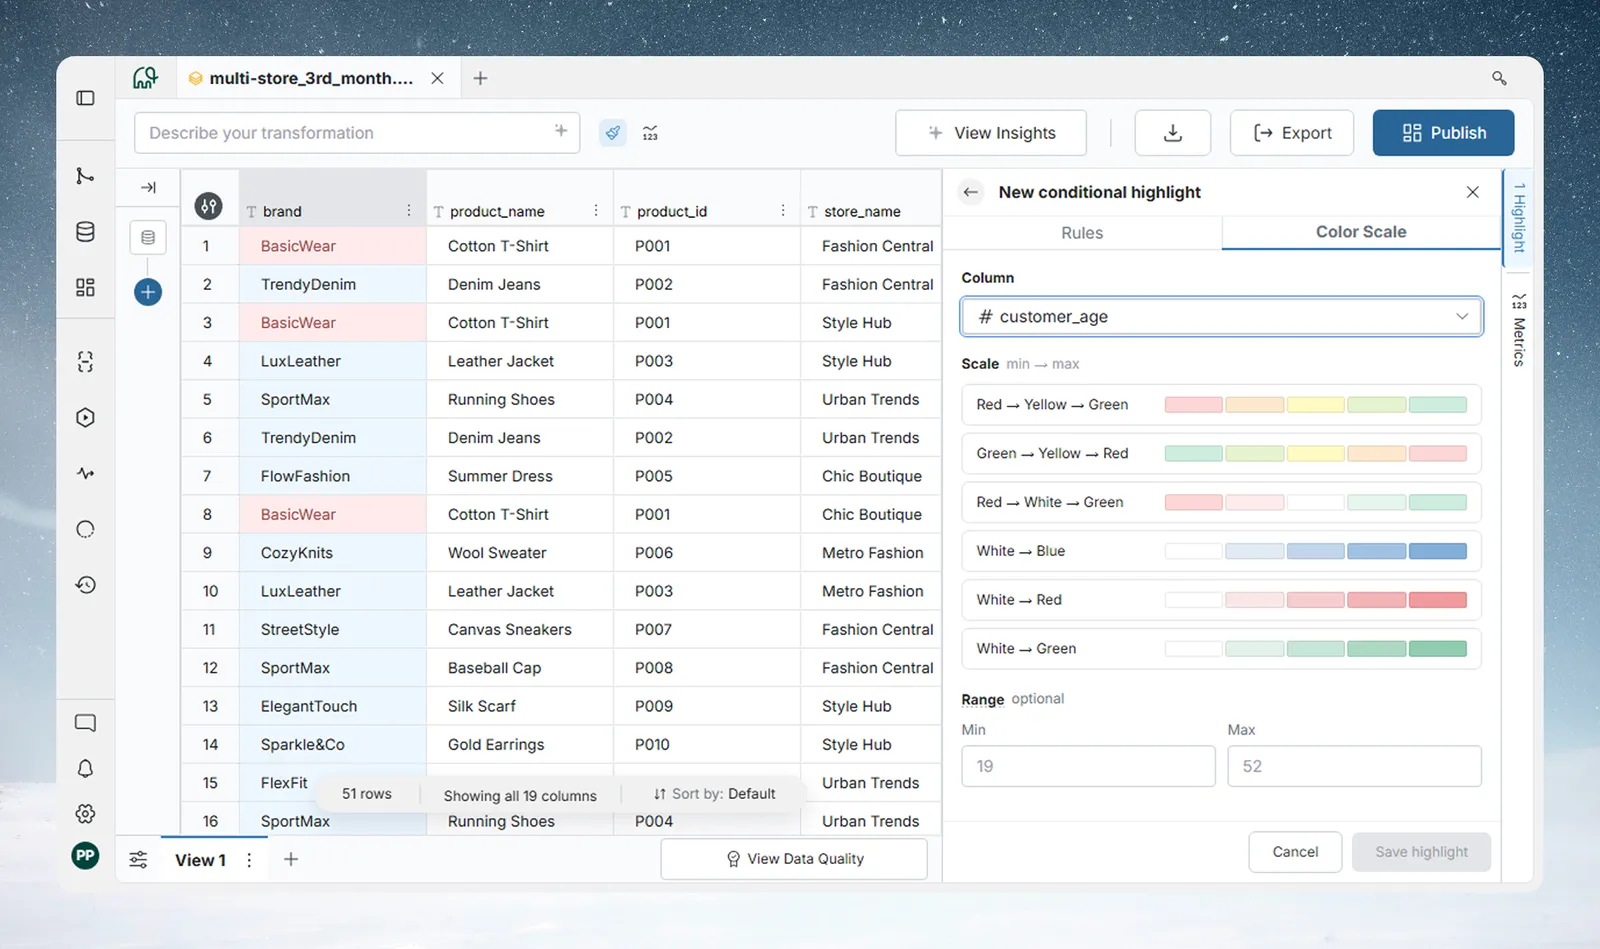
Scale presets
| Preset | Colors | Stops | Colors change at |
|---|---|---|---|
| Red → Yellow → Green | Low = red, mid = yellow, high = green | 3 | Yes |
| Green → Yellow → Red | Low = green, mid = yellow, high = red | 3 | Yes |
| Red → White → Green | Low = red, mid = white, high = green | 3 | Yes |
| White → Blue | Low = white, high = blue | 2 | No |
| White → Red | Low = white, high = red | 2 | No |
| White → Green | Low = white, high = green | 2 | No |
Colors change at
For 3-stop presets (Red → Yellow → Green, Green → Yellow → Red, Red → White → Green), the Colors change at field controls where the middle color sits on the gradient. For Numeric columns it accepts a number; for Date columns it shows a date picker.
Leave it blank to split the gradient evenly across the range.
Custom range
By default, Color Scale auto-detects the column's minimum and maximum values from the data. The placeholder in the Min/Max fields shows the auto-detected values.
Enter custom values to pin the scale to a fixed range—useful when you want consistent coloring across Views or over time, regardless of the current data distribution.
Manage your rules
Rule cards
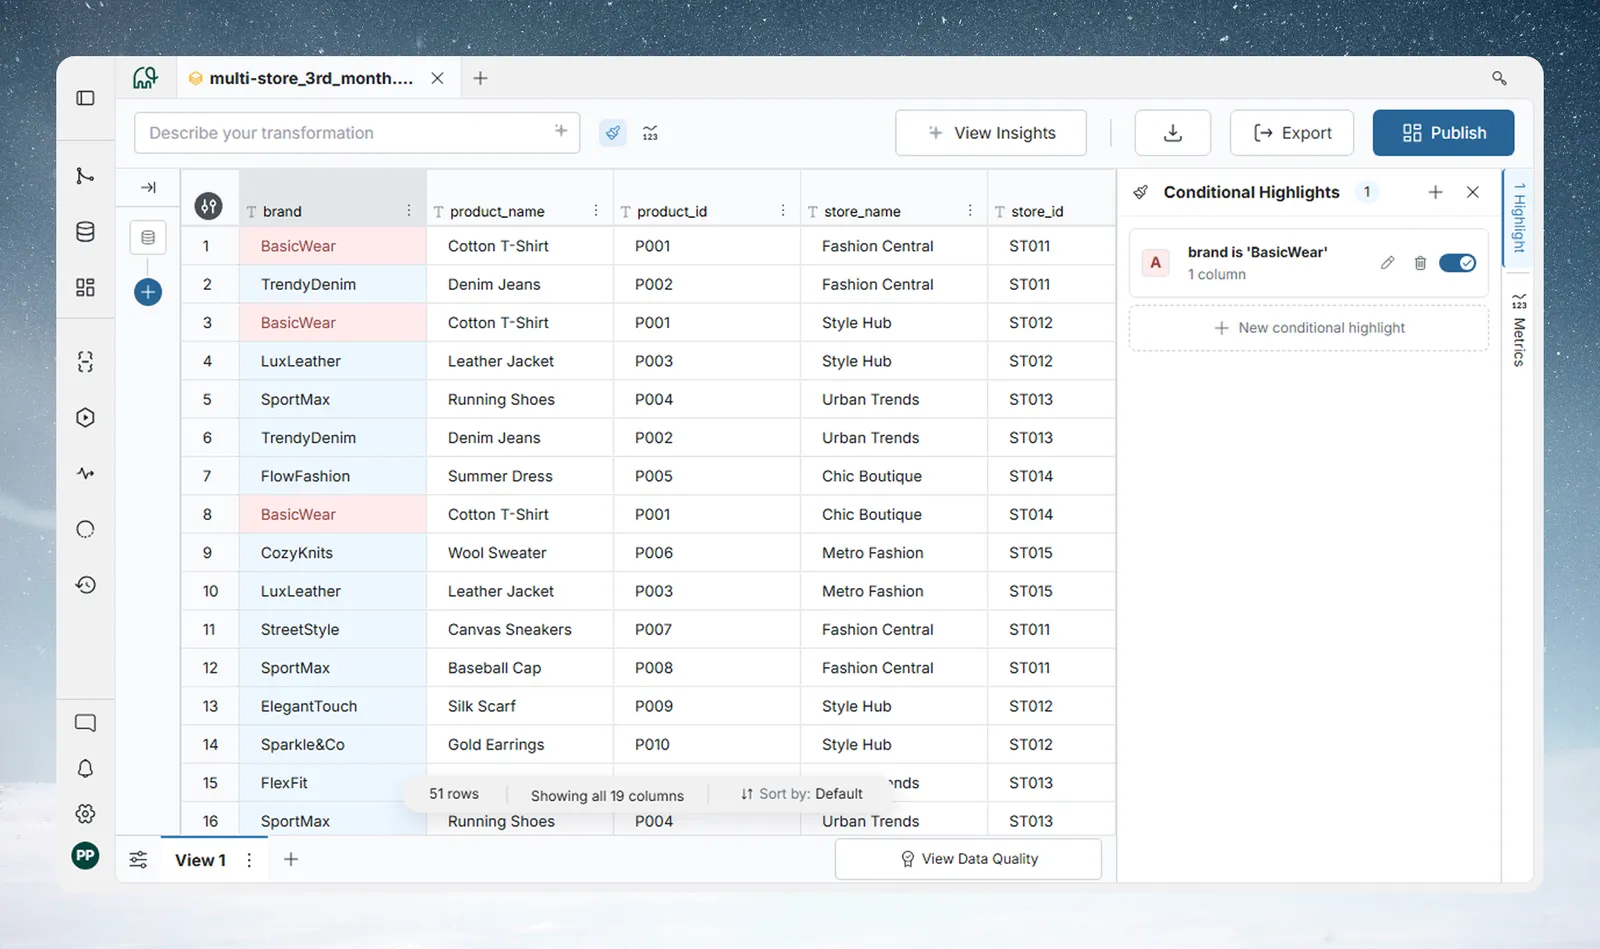
Each rule appears as a card in the panel. The card shows:
- Color swatch—a solid color square for Condition Rules; a gradient bar for Color Scales.
- Title—the rule's name, or an auto-generated condition summary.
- Subtitle—the number of highlighted columns for Condition Rules (e.g., 2 columns), Entire row, or the preset name for Color Scales (e.g., Red → Yellow → Green).
- Drag handle—reorder the rule (hidden when there is only one rule).
- Warning icon—appears when a column referenced by the rule no longer exists in the View or has changed type. See Troubleshooting below.
- Toggle—enable or disable the rule without deleting it. Disabled rules appear dimmed.
- Edit—opens the rule builder pre-populated with the rule's current settings.
- Delete—opens a confirmation modal before removing the rule.
Enabling and disabling rules
Use the toggle on any rule card to turn a rule on or off. Disabled rules remain saved but have no visual effect on the grid. This is useful for temporarily pausing a rule without losing its configuration.
Reordering rules
Drag rule cards by their handle to change their order. Order matters—see How rules are evaluated below. The new order is saved automatically.
Editing a rule
Click Edit on any rule card to reopen the builder with the rule's current values. Changes take effect after you click Save highlight. To abandon edits, close the builder—a confirmation prompt appears if you have made unsaved changes.
Deleting a rule
Click Delete on a rule card, then confirm in the modal. Deletion is permanent—there is no undo.
How rules are evaluated
Rules are evaluated in the order they appear in the panel (top = highest priority). For each row:
- Rules are checked from top to bottom.
- First match wins—for each cell, the first rule (from the top) that matches the row and applies to that cell colors it, and no further rules are checked for that cell. A rule in Cells mode only colors the columns you chose, so lower rules can still color the other cells in the same row.
- If no rule matches, no highlight is applied.
Rules (top to bottom):
  1. Sales > 10,000  →  Red background
  2. Sales > 5,000   →  Yellow background
  3. Region = "West" →  Blue background
Row: Sales = 12,000, Region = "West"
→ Rule 1 matches → Red applied
→ Rules 2 and 3 are skipped (first match wins)
Row: Sales = 7,500, Region = "North"
→ Rule 1: no match
→ Rule 2: matches → Yellow applied
→ Rule 3 is skipped
Row: Sales = 2,000, Region = "West"
→ Rule 1: no match
→ Rule 2: no match
→ Rule 3: matches → Blue applied
This means rule order controls which rule "wins" when a row qualifies for multiple conditions. Place your most specific or highest-priority rules at the top.
Tip: To reorder, drag the rule cards in the panel. The order is saved immediately.
Color Scales and evaluation order
Color Scales participate in the same sequence as Condition Rules. A Color Scale rule that sits above a Condition Rule colors every value in its column, effectively preventing lower Condition Rules from coloring cells in that column. If you want Condition Rules to take precedence over a Color Scale, place the Condition Rules above the Color Scale in the list.
Focus mode
Click any rule card to activate focus mode for that rule.
In focus mode:
- Rows matching the focused rule are displayed normally with the rule's highlight.
- Non-matching rows are dimmed.
- A banner appears above the grid showing how many rows match: "Highlighting 14 of 200 rows for brand is 'BasicWear'".
To exit focus mode: click the same rule card again.
For Color Scales, the banner reads Color scale on followed by the column name.
Click the X at the right end of the banner to leave focus mode.
Filter to the matching rows
For Condition Rules, the banner also has a filter button (tooltip Filter to matching rows). It is not shown for Color Scales. Click it to show only the matching rows. The banner then reads Showing 14 of 200 rows · Filtered by followed by the rule, with a 3-dot menu and a close button that removes the filter. The filter is a temporary view of the grid and does not add a pipeline task.
The 3-dot menu has these actions:
- Convert this filter into a Pipeline Task: opens the Conditional Filter panel pre-filled with the rule's condition. The task is added only when you apply it.
- Create new view with this filter applied: creates a new View that contains a Conditional Filter task with the rule's condition.
- Copy values to clipboard: copies the visible columns of the matching rows, tab-separated with a header row.
- Export list as CSV: downloads the matching rows as a CSV file.
The first two actions are hidden in preview mode.
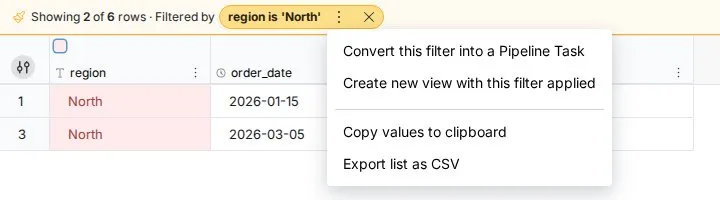
Focus mode shows you exactly which rows a rule affects—useful for verifying conditions before sharing a View.
Color reference
Solid colors—condition rules
18 swatches are available across two groups:
Background colors (8): apply a background fill to matching cells.
Text-only colors (10): change only the font color; no background fill is applied.
Gradient presets—color scales
| Preset | Low value | Mid value | High value | Colors change at |
|---|---|---|---|---|
| Red → Yellow → Green | Red | Yellow | Green | Yes |
| Green → Yellow → Red | Green | Yellow | Red | Yes |
| Red → White → Green | Red | White | Green | Yes |
| White → Blue | White | — | Blue | No |
| White → Red | White | — | Red | No |
| White → Green | White | — | Green | No |
Example: Budget performance monitoring
Your monthly sales report has a Monthly Sales column. Your team target is $10,000. You want to immediately see who is on target, who is close, and who has missed significantly—without sorting or filtering.
Rule setup:
| Rule | Condition | Color | Position |
|---|---|---|---|
| 1 | Monthly Sales >= 10,000 | Green background | Top (highest priority) |
| 2 | Monthly Sales >= 9,000 | Yellow background | Second |
| 3 | Monthly Sales < 9,000 | Red background | Third |
With this stack, any rep at or above target turns green immediately. Reps between $9,000 and $9,999—within 10% of the target—turn yellow. Everyone else turns red. Because rule 1 is evaluated first, a rep who hits $15,000 is correctly shown as green and rules 2 and 3 are never checked for that row.
To adjust for a different target: edit rule 1 and rule 2 with the updated threshold values. Rule 3 (< 9,000) automatically colors everything the first two rules do not match.
Rows with empty sales values are not matched by any of these three rules (an empty cell does not equal a number) and will appear unhighlighted. Use an Is empty condition in a fourth rule if you want to flag missing data separately.
Troubleshooting reference errors
A warning icon on a rule card means that one or more columns referenced in the rule can no longer be found in the View, or their type has changed.
This can happen when:
- A column was removed from the dataset.
- A column's data type was converted (for example, from Text to Numeric) and the rule referenced it as a different type.
What to do:
- Click Edit on the rule card.
- A warning banner at the top of the builder identifies the affected columns.
- Remove the errored column from the condition or replace it with a valid column.
- Click Save highlight.
Note: The Save highlight button is disabled while any column in the builder has a reference error. You must remove or replace the errored column before you can save changes.
A saved rule that references a column that no longer exists is skipped when the grid is colored, so it has no visual effect until you fix it. You cannot save any changes to the rule—including changes to still-valid conditions—until the errored column is removed or replaced. Open the builder, remove the errored column, then click Save highlight.
Quick reference
| Task | How |
|---|---|
| Open the Conditional Highlights panel | Action bar → Conditional Highlights |
| Open the panel with a column pre-selected | Column 3-dot menu → Conditional Highlights |
| Add a rule | New conditional highlight in the panel |
| Reorder rules | Drag rule cards in the panel |
| Enable or disable a rule | Toggle on the rule card |
| Edit a rule | Edit on the rule card |
| Delete a rule | Delete on the rule card → confirm |
| Activate focus mode | Click a rule card |
| Exit focus mode | Click the same rule card again |
| See how many rows match a rule | Activate focus mode—the banner shows the count |