Date column cards
Date column cards are Explore Cards that show temporal patterns as a bar chart, a timeline, or a list. Seasonality, missing periods, growth trends, and operational rhythms become visible without writing date functions or building pivot tables.
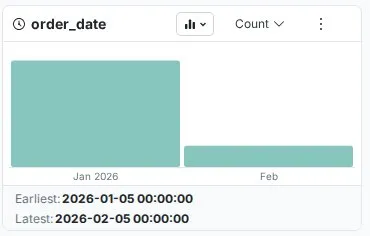
Mammoth automatically selects the time granularity from the earliest and latest values in the column: if they fall in different calendar years the card groups by Year, if they fall in different months of the same year it groups by Month, and otherwise it groups by Day. Automatic selection only ever chooses Day, Month, or Year—for genuinely intraday patterns, switch to Hour, Minute, or Second manually using the aggregation menu described in Show values by and granularity.
What date Explore Cards show
Vertical bar chart layout
Date columns display as vertical bar charts where each bar represents a time period and its height shows how many records fall within that period.
- Bars extend upward, height proportional to frequency
- Period labels sit on the X axis below each bar (e.g., "Jan-2024", "Feb-2024" at Month granularity)
- Hover any bar to see a tooltip showing the exact period and its value
- Chronological order—oldest period on the left, newest on the right
- Summary statistics below the chart: Earliest and Latest datetime values
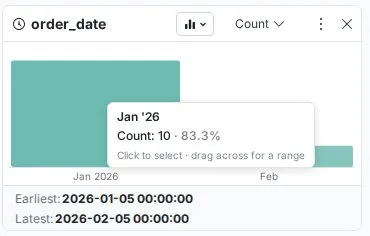
Earliest and latest statistics
Below the chart, two statistics are displayed:
- Earliest—the oldest datetime value in the column, shown with full date and time (e.g.,
2024-01-02 12:00:00) - Latest—the most recent datetime value, also shown with full date and time (e.g.,
2024-12-23 12:00:00)
These immediately flag data range issues—future dates in historical data or a Latest value far older than expected both stand out here.

Columns, timeline, and list views
Date Explore Cards have three views, which you switch with the chart type dropdown in the card header:
- Columns—the default vertical bar chart, best for seeing trends and seasonality
- Timeline—the same periods drawn as a line over time
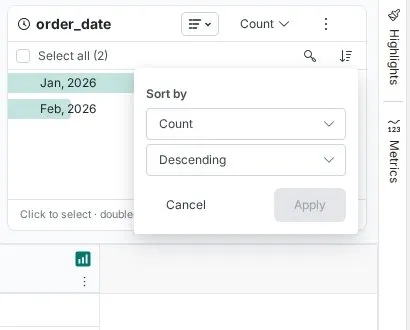
- List—shows the periods as a list, useful for reading exact counts per period
Card controls
Date Explore Cards have these controls: the aggregation menu in the card header (it reads Count by default), the chart type dropdown, the More options menu (⋮), and, in list view, Search values and Sort by above the list.
Show values by and granularity
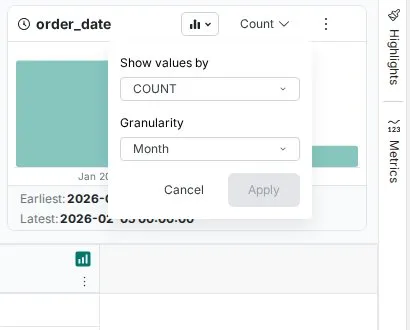
Clicking the aggregation menu opens a panel with two settings applied together:
Show values by—controls what the card measures for each time period. By default it shows COUNT (number of rows), but you can switch to the aggregation of any numeric column—for example Sum of revenue per month or Average order value per day. Supported functions:
| Function | What it shows |
|---|---|
| COUNT | Number of rows per time period (default) |
| SUM | Total of the selected numeric column per time period |
| AVG | Average of the selected numeric column per time period |
| MIN | Smallest value of the selected numeric column per time period |
| MAX | Largest value of the selected numeric column per time period |
| STDDEV | Standard deviation of the selected numeric column per time period |
| DISTINCT_COUNT | Number of distinct values of the selected column per time period |
Granularity—controls the time period used for grouping. Available options:
| Granularity | Example labels | Best for |
|---|---|---|
| Day | 01-Aug-2024, 02-Aug-2024 | Daily operations, short-term trends |
| Month | Jan '24, Feb '24 (list) or Jan-2024 (chart) | Seasonal patterns, monthly performance |
| Year | 2022, 2023, 2024 | Long-term trends, year-over-year analysis |
| Hour | 01-Aug-2024 08:00, 01-Aug-2024 09:00 | Intraday patterns, shift analysis |
| Minute | 01-Aug-2024 08:15, 01-Aug-2024 08:30 | Process timing, high-frequency data |
| Second | 01-Aug-2024 08:15:00, 01-Aug-2024 08:15:01 | Real-time monitoring, precise event logging |
Mammoth automatically selects a granularity when the card first loads—but automatic selection only ever chooses Day, Month, or Year. If you need Hour, Minute, or Second (for intraday analysis), you must set it manually here—it is never chosen automatically, even for data that spans only a few hours. Once you've set both options, click Apply to update the card or Cancel to discard changes.
More options menu (⋮)
The More options button opens a menu. The options available depend on whether a value is currently selected:
When no value is selected:
- Copy values to clipboard
- Export list as CSV
- Export Image as PNG (chart and timeline views only)
When a value is selected (and you can edit the workspace):
- Replace all values like this—opens Label & Insert Values with the selection filled in as the condition
- Remove all values like this—opens Conditional Filter set to remove records in that period
- Keep all values like this—opens Conditional Filter set to keep only records in that period
- Copy values to clipboard
- Export list as CSV
- Export Image as PNG (chart and timeline views only)
Search values
Available above the list in list view—lets you search for a specific time period within the card. Most useful when the date range spans many periods and scrolling isn't practical.
Sort
The Sort by menu is available above the list in list view only. Choose what to sort by, then Ascending or Descending, and click Apply:
- The card's measure (Sum, Count, etc.)
- The period value—chronological order
Temporal patterns you'll see
Seasonality: Recurring cycles become immediately obvious. Retail data shows holiday spikes, subscription services show new-year bumps, B2B data shows summer slowdowns.
Trends: Gradual change appears as a rising or falling pattern across periods. Ascending bars indicate growth; descending bars indicate decline.
Operational rhythms: Business cycles emerge clearly—weekday vs weekend activity, month-end processing spikes, shift-based patterns in manufacturing.
Data quality issues detected
Missing time periods: Gaps in otherwise continuous data show as absent bars in the timeline. If daily production logs should appear every day but specific dates are empty, you've found a data collection issue.
Future date errors: Immediately visible in the Latest statistic—if it shows a date beyond today in a historical dataset, future dates exist in your data.
Batch processing artifacts: Data that should be continuous but shows heavy clustering on specific dates—such as 90% of records on the last day of each month—reveals system processing patterns that may affect analysis.
Real-world examples
Retail seasonality planning
A retail analyst opens an annual orders dataset. The Date Explore Card immediately shows a monthly pattern:
- Baseline months (Jan–Oct): 500–700 orders each
- Holiday spike (Nov): 2,400 orders
- Peak month (Dec): 3,100 orders
- Post-holiday drop (Jan): 400 orders
Filtering to November and cross-referencing the product category card reveals that "Gifts" dominates—enabling data-driven inventory planning for the following year.
Operations data completeness
A production manager expecting daily logs opens the production_date column. The date card reveals three dates in August with no bars. Cross-referencing with maintenance records confirms two were planned downtime; one was an undetected data collection failure—caught before it affected any downstream reports.
Intraday traffic patterns
A marketing analyst reviewing a week of website visit data switches granularity to Hour, revealing:
- Peak traffic: 12:00–14:00 and 20:00–22:00
- Low activity: 02:00–06:00
Promotional campaigns are rescheduled to align with these peaks.
Troubleshooting
Date column appears as text, not a chart
- Check that date values are consistently formatted in the source data
- Use the Convert Column Type function to correct date parsing
- Inconsistent formats within the same column (e.g., mixing MM/DD/YYYY and DD-MM-YYYY) will prevent correct detection
Automatic granularity isn't right for your analysis
- Use the aggregation menu to override—select your preferred granularity and click Apply
- This does not affect the underlying data
Chart jumps to a coarser granularity than expected
- Automatic granularity depends on the range of the dates currently counted, so it can change when a filter is applied
- Use the aggregation menu to set your preferred granularity and click Apply
Expected seasonal patterns not visible
- Ensure the date range covers at least one full cycle (a full year is needed to see annual seasonality)
- Try a different granularity—a monthly view can obscure weekly patterns
- Check the Earliest and Latest stats to confirm the date range covers the period you expect
Earliest or Latest value looks wrong
- Note that these show the full datetime including time component—a date that looks correct may have an unexpected time value
- Check for future dates in historical data, or dates predating when the business or system existed