Text column cards
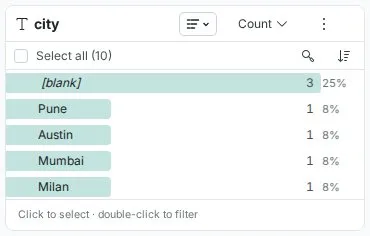
Text column cards are Explore Cards that show the distinct values in a text column as a list sorted by frequency, with a horizontal bar behind each value indicating its relative count and percentage share of the total. They make categorical data quality issues immediately visible—inconsistent spellings, case variations, extra spaces, and missing values all appear as separate rows rather than hiding in thousands of records.
What text Explore Cards show
Visual layout
When you add a text column to the Explore panel, its card displays:
- Card header—shows the column name and the number of unique values, e.g.
product_name 9 unique values - Values listed as rows, by default from most to least frequent
- Horizontal frequency bar behind each value, sized relative to the largest share in the list
- Count and percentage shown on each row, e.g.
20and20%. The percentage is rounded to a whole number, and shows<1%for very small shares. It appears only while the card shows Count - Blank values shown as a
(blank)row - Select all and Invert controls, Search values, and Sort by above the list
- Aggregation menu in the card header—the Show values by control (Count by default)
- Chart type dropdown in the card header—List (default), Donut, and Treemap
Card options
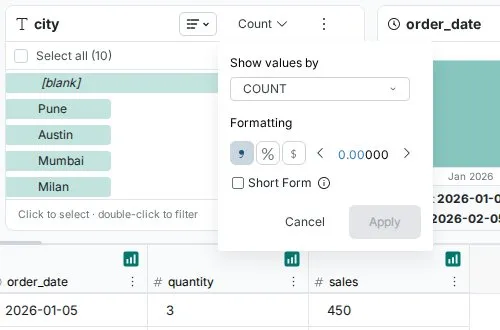
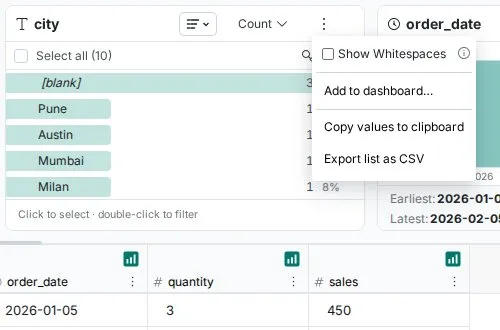
Each Text Explore Card has these controls: the aggregation menu in the card header for changing what the card measures, the search and sort buttons above the list, and the More options menu (three-dot button in the card header) for whitespace display, copy, and export.
Change aggregation
The aggregation menu in the card header controls what the card measures for each value—this is the Show values by setting. By default it shows the count of rows for each unique value, but you can switch it to an aggregation (COUNT, DISTINCT_COUNT, SUM, AVG, MIN, MAX, or STDDEV) of a numeric column in your dataset.
Example: On a supplier_name text card, switching from Count to Sum of invoice_amount changes the card from showing how many records exist per supplier to showing total spend per supplier—without writing any formula or query.
SUM, AVG, MIN, MAX, and STDDEV need a numeric column in your View to measure.
Donut and Treemap views show each value's share of the total, so they are available only when the value is set to Count or Sum.
Search values
The Search values button above the list lets you filter the value list to find a specific entry. Useful when a column has many distinct values and scrolling isn't practical.
Sort
The Sort by menu above the list lets you change the order of values. Choose what to sort by—the card's measure (such as Count) or the column's values—then choose Ascending or Descending and click Apply.
Show whitespaces
Available in list view as the Show Whitespaces checkbox at the top of the More options menu—it visualizes whitespace characters in values, with extra spaces emphasized. This makes leading and trailing space issues immediately visible—values that look identical like "Company" and " Company" are clearly distinguished when whitespace is shown.
Use this whenever you suspect extra spaces are causing values to appear as duplicates in your analysis.
Copy values to clipboard
Available from the More options menu—Copy values to clipboard copies the list of values to your clipboard. Useful for pasting into other tools or documenting what values exist in a column.
Export list as CSV
Available from the More options menu—Export list as CSV exports the list of values and their counts as a CSV file for offline review or sharing.
Export image as PNG
In the Donut and Treemap views, Export Image as PNG in the More options menu exports the chart as a PNG image. It is not offered in list view.
Select values
Text Explore Cards are interactive. Click a value to select it—a checkbox marks each selected value, and a bar appears with the number of selected values and the Filter and Exclude buttons.
Multi-select: a plain click toggles a value, so you can select several one by one. Hold Shift while clicking to select a run of values from the last one you clicked. Select all selects every value, and Invert flips the selection.
Filter one value: double-click a value to filter to it right away.
Deselect: click Clear selection, or press Esc.
Blank values
Blank values appear as a (blank) row with their own count, so data completeness gaps are visible alongside every other value.
Resize cards
Drag the edge of a card to widen it when value names are being cut off. Hover a truncated value to see it in full.
What you discover immediately
Data quality issues:
- Spelling variations: "Service" vs "Services" vs "service"—each appears as a separate row
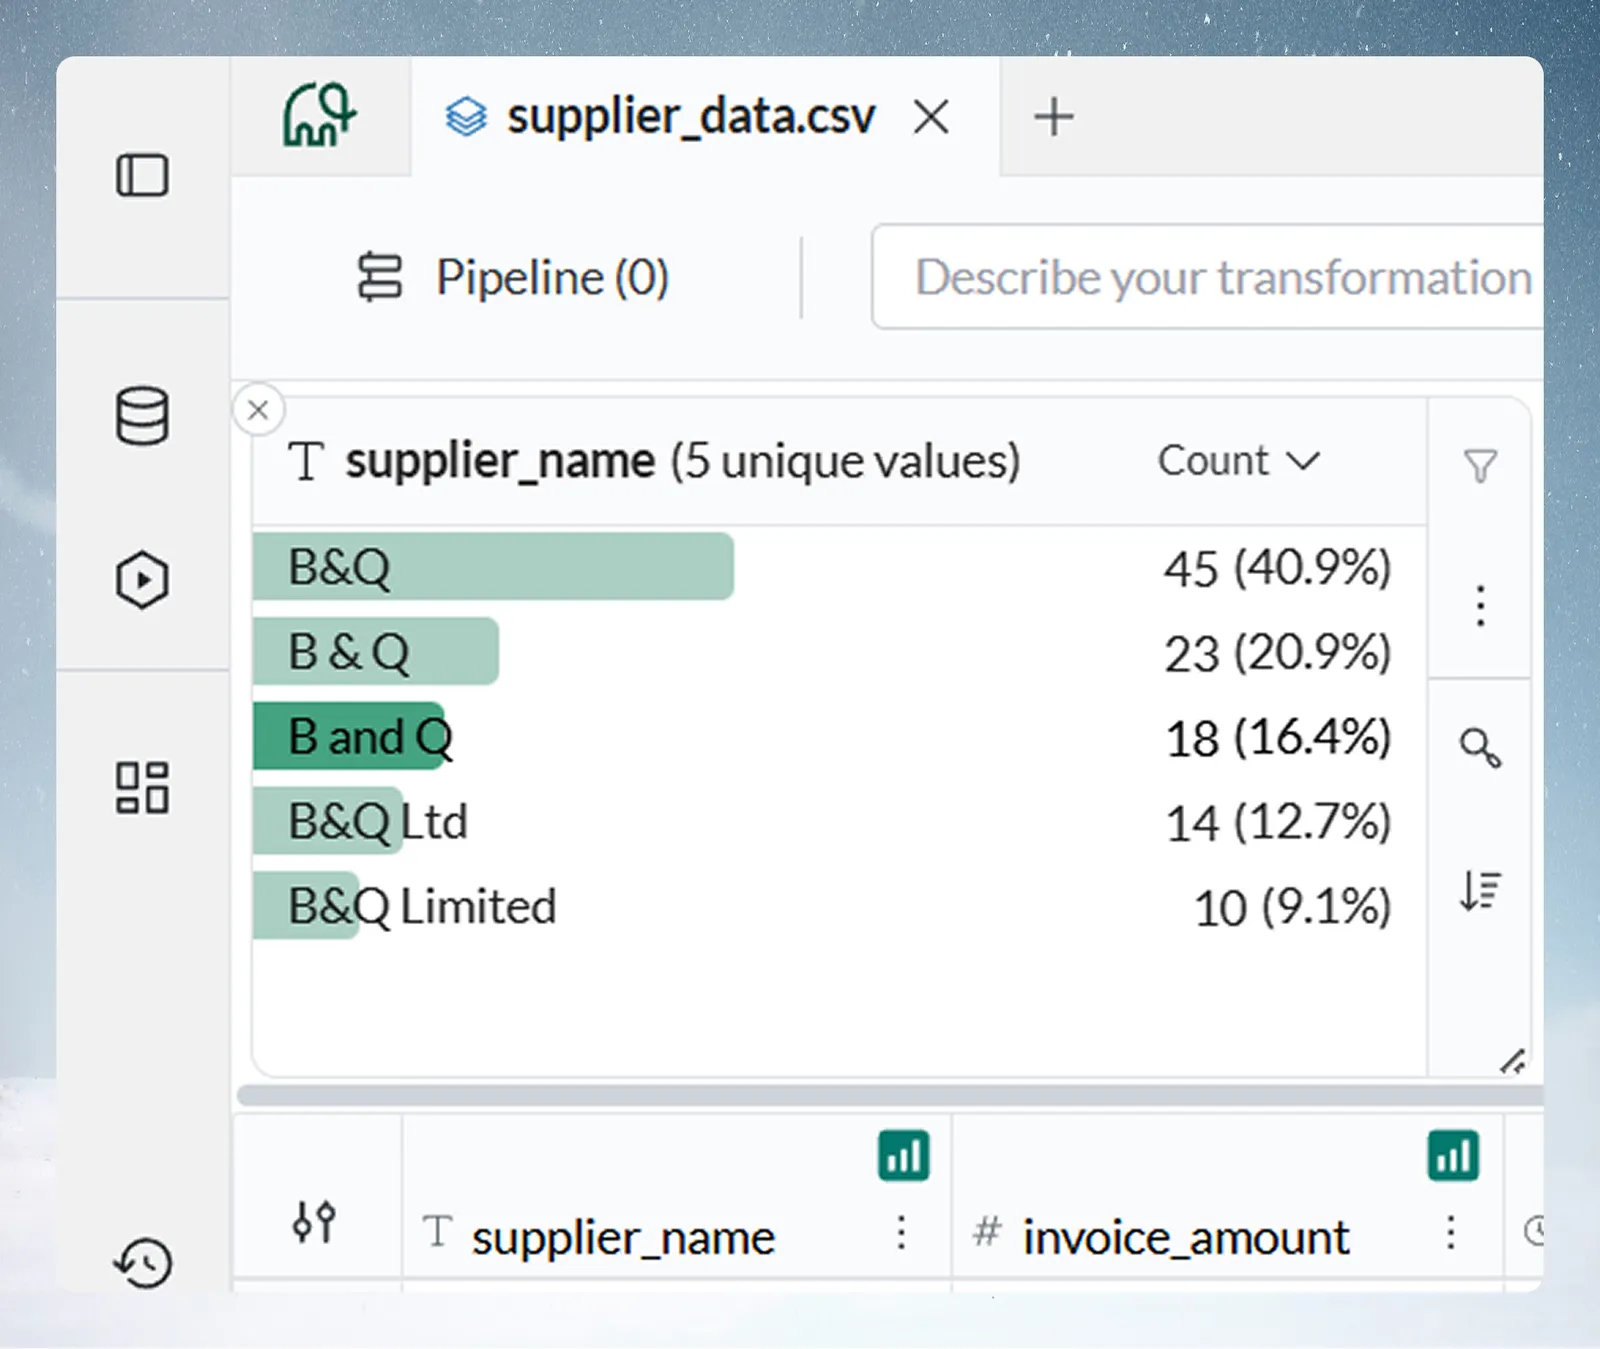
- Formatting inconsistencies: "B&Q" vs "B & Q" vs "B and Q"
- Case sensitivity: "Travel" vs "travel" vs "TRAVEL"—each with its own count and percentage
- Extra whitespace: " Company" appearing separately from "Company"
- Missing data: a
(blank)row with its count and percentage share
Business patterns:
- Most common categories and their exact percentage of total records
- Rare or unexpected values and how much of your data they represent
- At-a-glance completeness—the percentage on each row tells you the data share instantly
Real example: Supplier name variations
A retail customer used Text Explore Cards to resolve a supplier reporting problem.
What the Explore Card revealed for their supplier name column:
- "B&Q"—45 (41%)
- "B & Q"—23 (21%)
- "B and Q"—18 (16%)
- "B&Q Ltd"—14 (13%)
- "B&Q Limited"—10 (9%)
"You can imagine B and Q. There's lots of opportunities: B and Q, B space and Q... they have like 5 different spellings."
A single Bulk Replace transformation standardized all 863 records, enabling accurate supplier spend reporting.
Common quality patterns
Pattern 1: Inconsistent formatting
What you see:
- "Electronic Widget A"—20 (20%)
- "Electronic Widget-A"—15 (15%)
- "Elect Widget A"—8 (8%)
Same product, entered differently. The percentages immediately show how widespread each variation is. Use Bulk Replace to map all variations to a single standard value.
Pattern 2: Case sensitivity
What you see:
- "Travel"—18 (18%)
- "ad-hoc"—17 (17%)
- "Business Travel"—15 (15%)
- "travel"—14 (14%)
- "TRAVEL EXPENSES"—9 (9%)
Expense categories inconsistently entered. The percentage column makes it easy to see which variation is dominant and should become the standard.
Pattern 3: Abbreviation variations
What you see:
- "Ad hoc"—89 (52%)
- "ad-hoc"—45 (26%)
- "adhoc"—23 (13%)
- "Ad Hoc"—12 (7%)
"I can see that there are some spelling issues like, you know, ad hoc versus ad hoc, and different spellings and things like that."
Consolidate to one standard format using Bulk Replace.
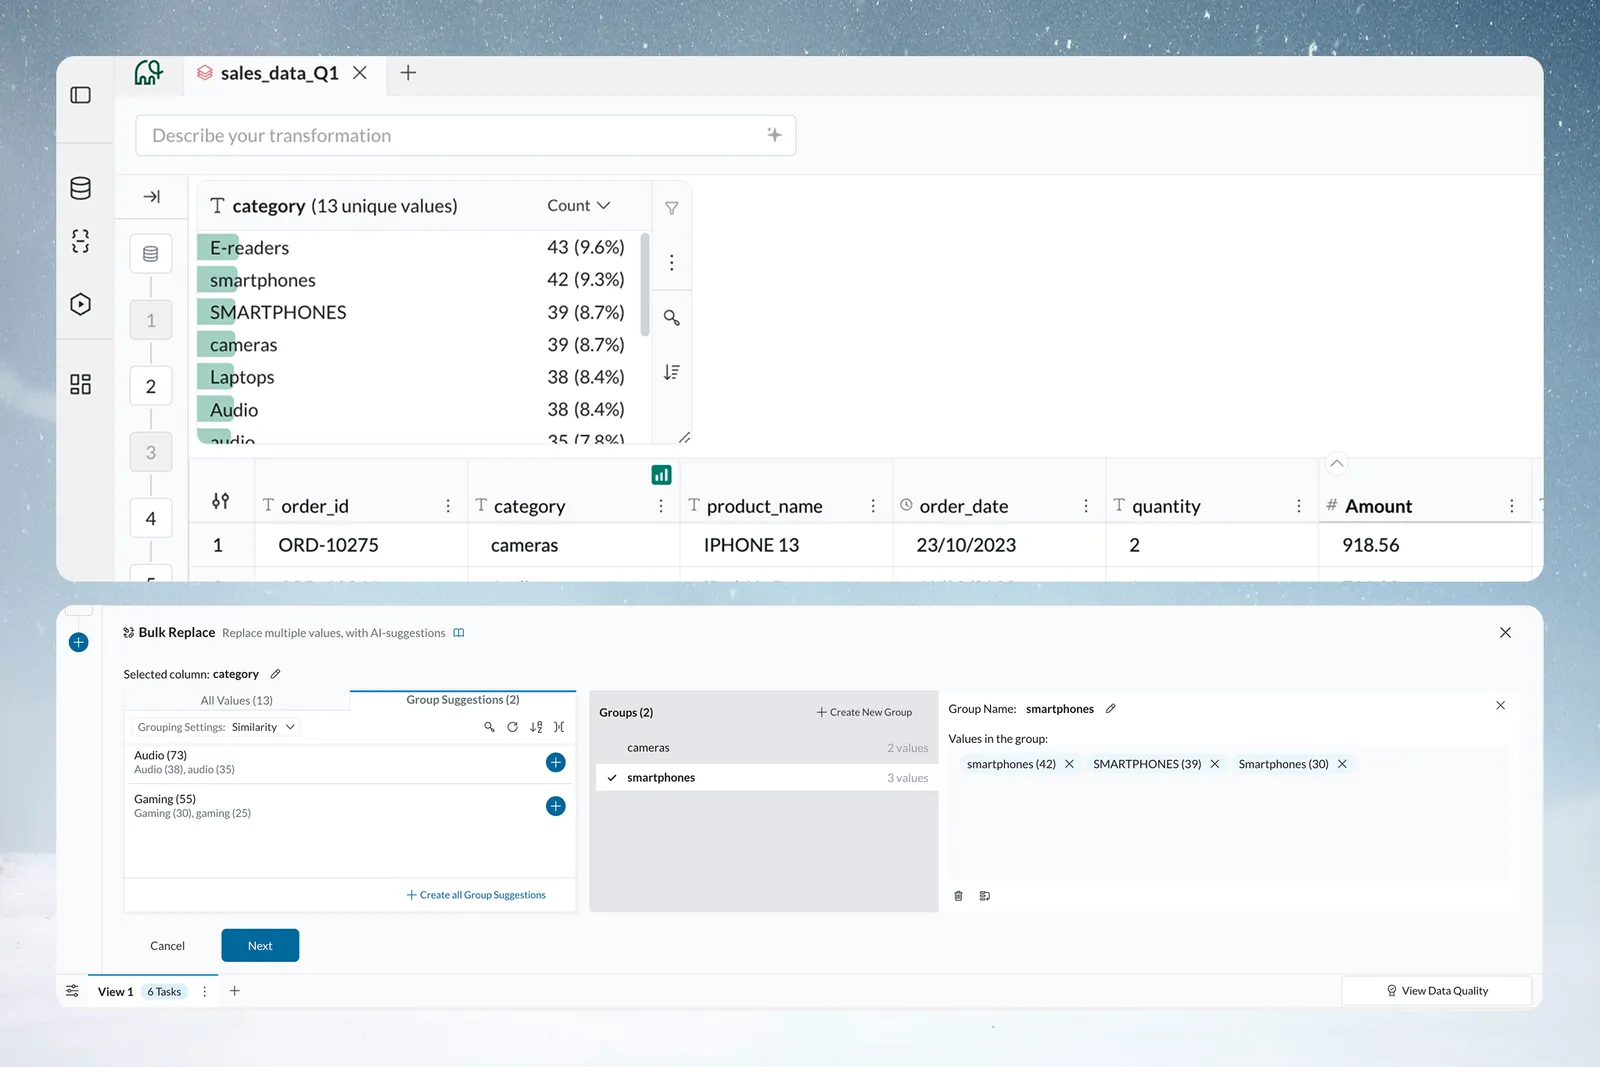
Transformations available from text cards
When you identify a quality issue in a Text Explore Card, you can launch a transformation directly from the card without leaving the View. Select one or more values, then open the More options menu, which includes:
- Replace all values like this—opens Bulk Replace with the selected values filled in, so you can map them to a single standard value
- Remove all values like this—opens Conditional Filter set to remove the selected values
- Keep all values like this—opens Conditional Filter set to keep only the selected values
For how clicking and filtering works in detail, see Explore Cards—Interactions.
Troubleshooting
Card shows unexpected or empty results
- Verify the column contains text data and is not entirely null
- Check that the column data type is correctly identified as text
- Refresh the View if data was recently updated
Too many values to read easily
- Cards load values in frequency order and fetch more automatically as you scroll—you don't need to load the whole list up front
- Use Search values to jump straight to a specific value instead of scrolling
- Consider whether the column needs a categorization transformation to reduce cardinality
Percentages don't add up to 100%
- Percentages are rounded to whole numbers, so the visible rows may not add up to exactly 100%
- Percentages are relative to the rows the card is counting—if this doesn't match what you expect, check whether a filter on an earlier card is applied (the card header shows a filter icon)
- Scroll down within the card to load and check lower-frequency values