When to use each discovery tool
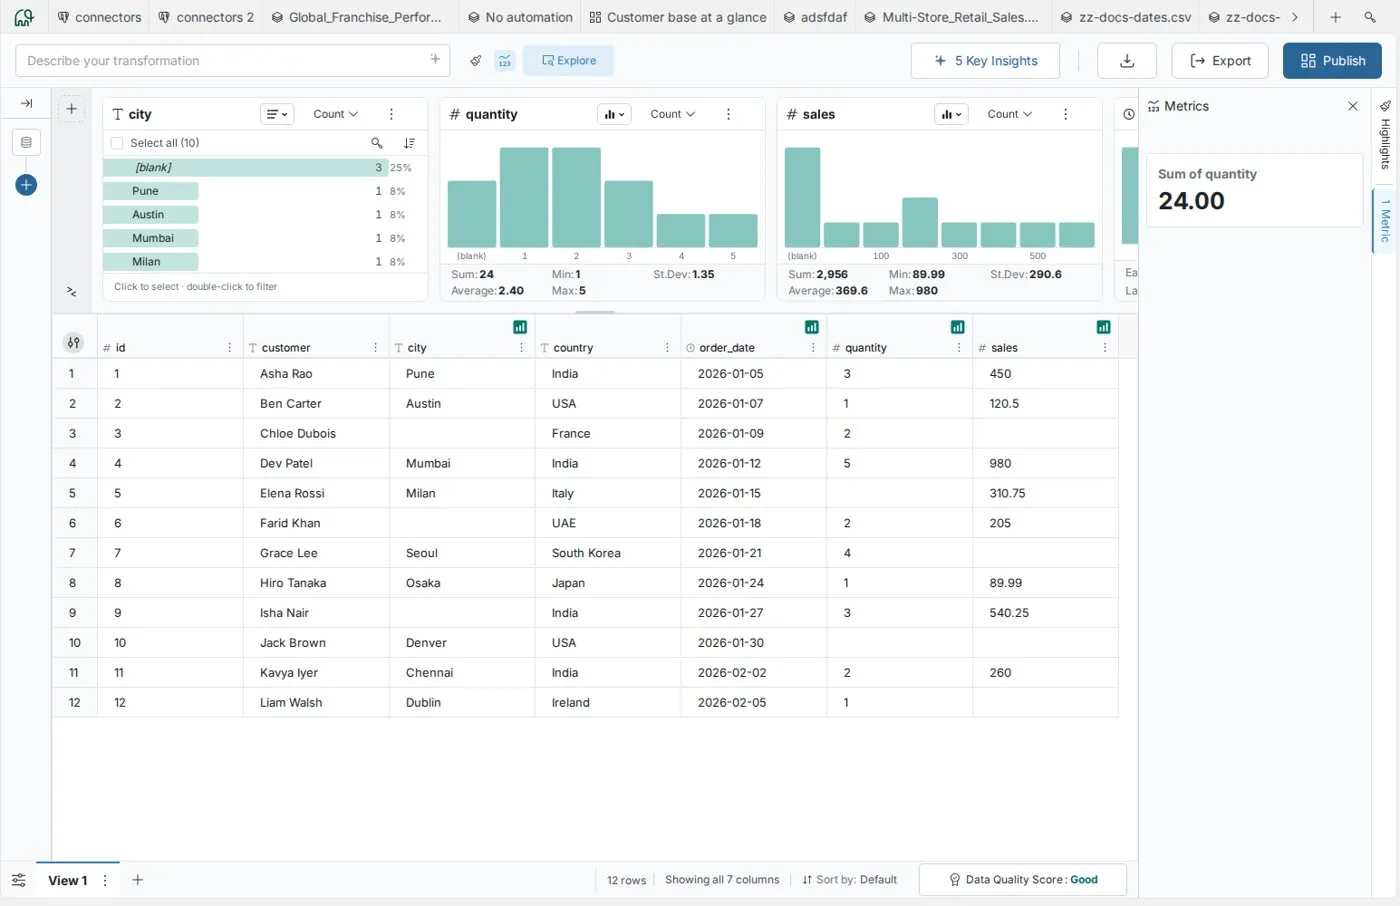
Mammoth has four discovery tools, each suited to a different analysis need. Use this page to pick one for your goal, or start with Quick decision framework.
View Insights and the Data Quality Report appear only when they are enabled for your workspace. Both are unavailable in preview mode, in edit mode and in a view-only workspace.
The four discovery tools:
- Explore Cards: Visual column profiling and interactive filtering
- View Insights: AI-generated business observations
- Data Quality Report: Quality assessment with recommended pipeline tasks
- Metrics panel: Custom calculations and KPI tracking
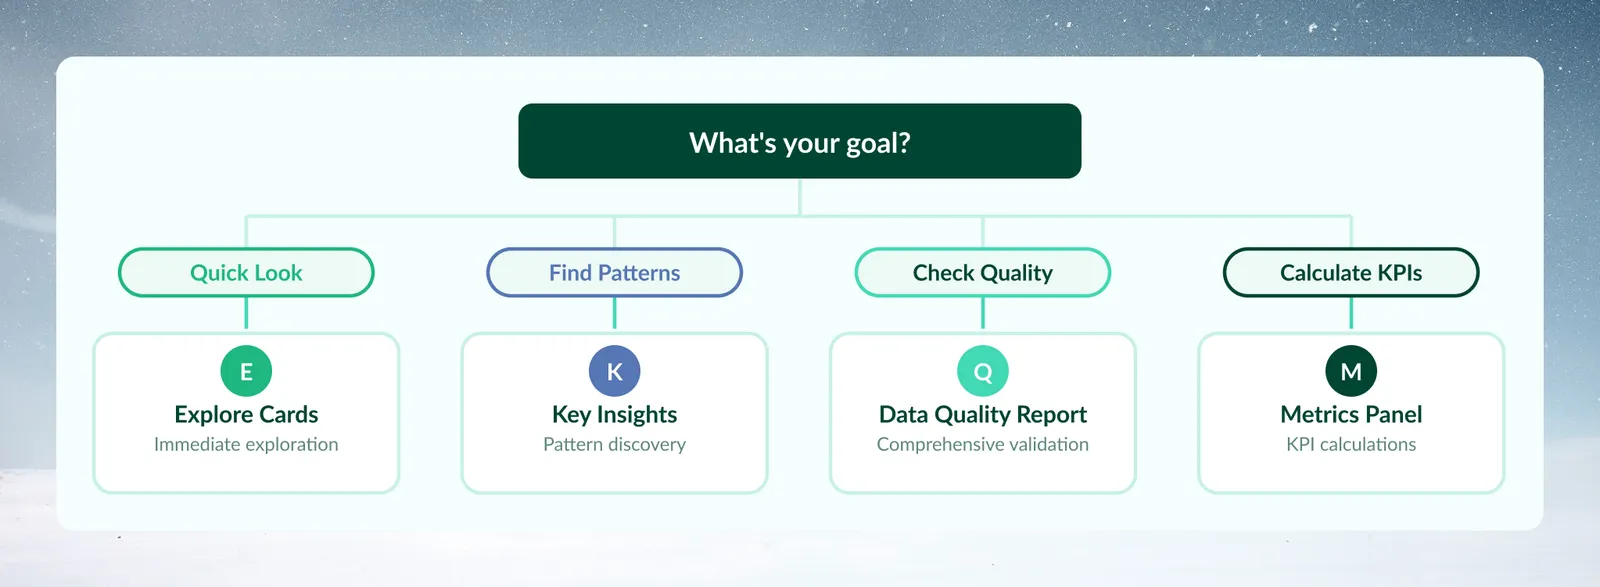
Quick decision framework
When you need a quick answer
Use Explore Cards for immediate data understanding:
- First look at any new dataset
- Quick value distribution checks
- Interactive filtering and segmentation
- Testing business logic before automation
Use Metrics panel for quick calculations:
- Specific KPIs or custom formulas
- Metric monitoring as you filter
- Dashboard preparation
- Quick aggregations (sum, average, count)
When you need more depth
Use View Insights for pattern discovery:
- Executive briefings and presentations
- Finding unexpected trends
- Business intelligence for stakeholders
- "What should I know about this data?"
Use Data Quality Report for comprehensive validation:
- Pre-production quality gates
- Compliance and audit requirements
- Pipeline planning (identify issues first)
- Systematic quality improvement
Tool-by-tool guidance
Explore Cards
What it does: Shows a visual card for each column you add to the Explore panel, with value distributions, statistics, and patterns. The display format depends on column type: text columns default to a ranked list of distinct values with counts and percentages, and can switch to a donut or treemap; numeric columns default to a vertical bar chart with range grouping; date columns default to a vertical bar chart and can switch to a timeline. Numeric and date cards can also be shown as a list.
Best for:
- Understanding data structure at first glance
- Identifying outliers and unusual patterns
- Creating filters through point-and-click interaction
- Validating data expectations ("Does this look right?")
When to use:
- New dataset arrives and you need quick orientation
- Filtering data for specific analysis segments
- Checking column distributions before transformations
- Converting discoveries into pipeline tasks
When NOT to use:
- You need AI-generated business insights
- Comprehensive quality scoring is required
- Custom calculations beyond basic statistics are needed
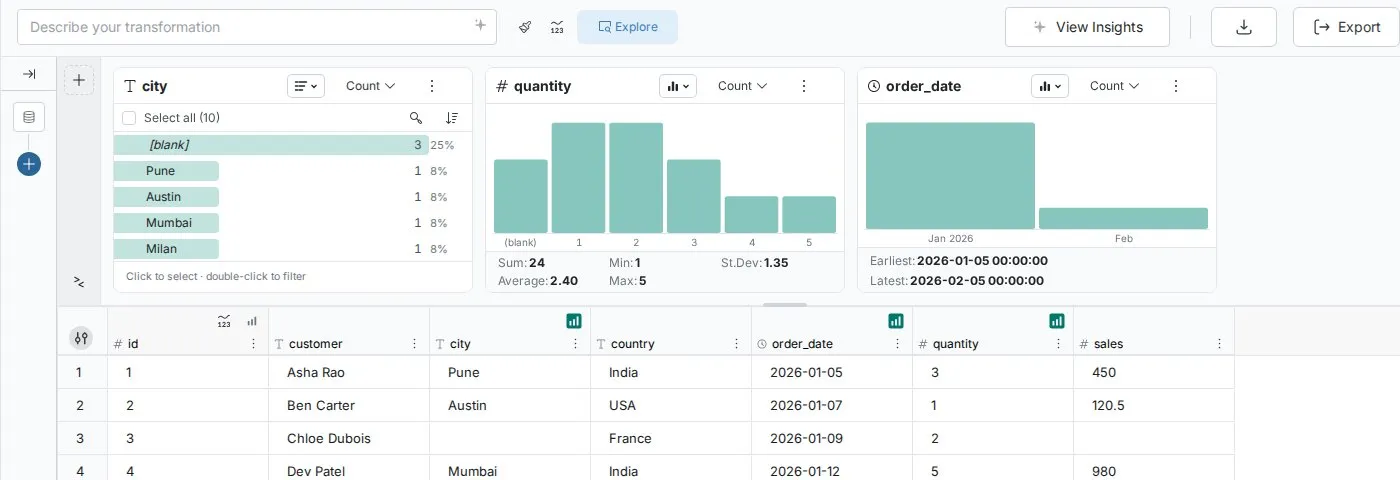
Example scenario: "I just uploaded sales data and want to understand the geography distribution before building regional reports."
Tip: Double-click any value in Explore Cards to instantly filter your data. The filter badge beside the Explore toggle counts your active filters, and you can later convert them to a permanent pipeline task.
View Insights
What it does: AI analyzes your current View's data and generates between 3 and 7 business observations about patterns, trends, and anomalies. The button label reflects the actual count generated—you may see "5 Key Insights", "7 Key Insights", or another number depending on the data. The AI determines the count; you cannot specify it. You open View Insights from the button on the right side of the action bar above the grid; before the first run it reads View Insights.
Important: View Insights analyzes the current View only. It does not analyze other Views or Datasets within your Project.
The AI identifies patterns and surfaces business-relevant observations—for example, flagging revenue concentration risk, inconsistent data formatting blocking joins, or churn clusters suggesting a cohort-level event. Insights combine factual pattern identification with business context to help you understand what the data means, not just what it contains. Results are not updated automatically when data changes; when the View's data changes, the saved insights are cleared and you click the button again to regenerate.
Best for:
- Executive summaries and stakeholder communication
- Discovering unexpected patterns you might miss
- Preparing talking points for presentations
- Getting an AI perspective on business implications
When to use:
- Preparing briefings for management or clients
- You don't know what questions to ask about new data
- You need business context for technical findings
- You want a second perspective on data patterns
When NOT to use:
- You need specific quality metrics or scores
- Interactive exploration is more important
- You want technical validation, not business observations
Current limitations:
- No follow-up questions: You cannot ask the AI to elaborate on a specific insight after generation
- No export option: the insights panel has no export button, so copy the text manually
- No cross-View analysis: Scope is limited to the current View
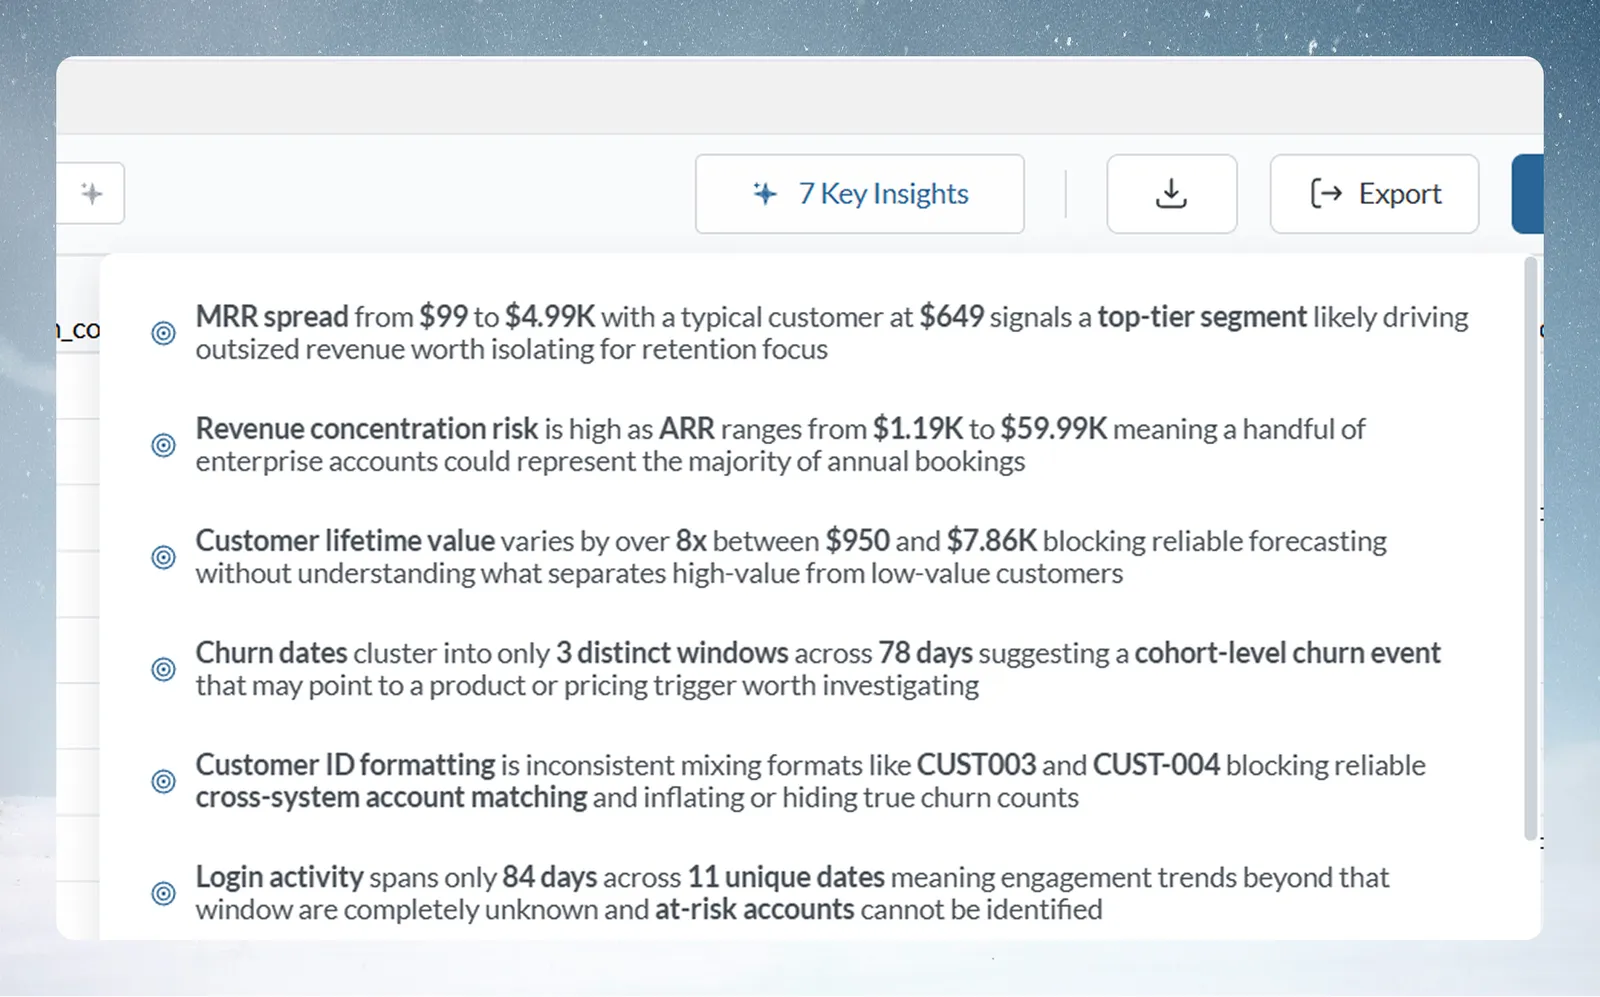
Example scenario: "I need to present quarterly results to the board and want AI to highlight the most important trends."
Tip: Copy View Insights output for stakeholder communication. The AI-generated observations work as talking points for presentations.
Data Quality Report
What it does: Systematic 6-dimension quality assessment using the DAMA (Data Management Association) framework, generating scores and pipeline task recommendations. The report covers the current View only—it does not compare quality across multiple Views or Datasets.
The report identifies issues and recommends specific pipeline tasks to address them—for example, Remove Duplicate Rows, Conditional Filter, Text Formatting, or Math Function—with High Priority, Medium, or Low labels. You open it from the button in the status footer below the grid (View Data Quality, which then shows the score). View Details opens the full report. You then build those tasks manually in the pipeline. There is no one-click apply button; the recommendations are guidance, not automated fixes.
Best for:
- Pre-production data validation
- Compliance and audit trail documentation
- Systematic quality improvement workflows
- Understanding data readiness for analysis
When to use:
- Before building production pipelines
- Compliance reporting requirements
- Data contains critical quality issues to address
- You need documented quality metrics for stakeholders
When NOT to use:
- Quick data exploration is the priority
- Quality issues are already known and accepted
- You need business insights, not technical validation
Current limitations:
- No export of the report—screenshot or copy/paste only
- Snapshot analysis only: not continuous monitoring
- Scope limited to current View—cannot compare quality across multiple datasets
- Cannot define custom quality dimensions beyond the DAMA framework
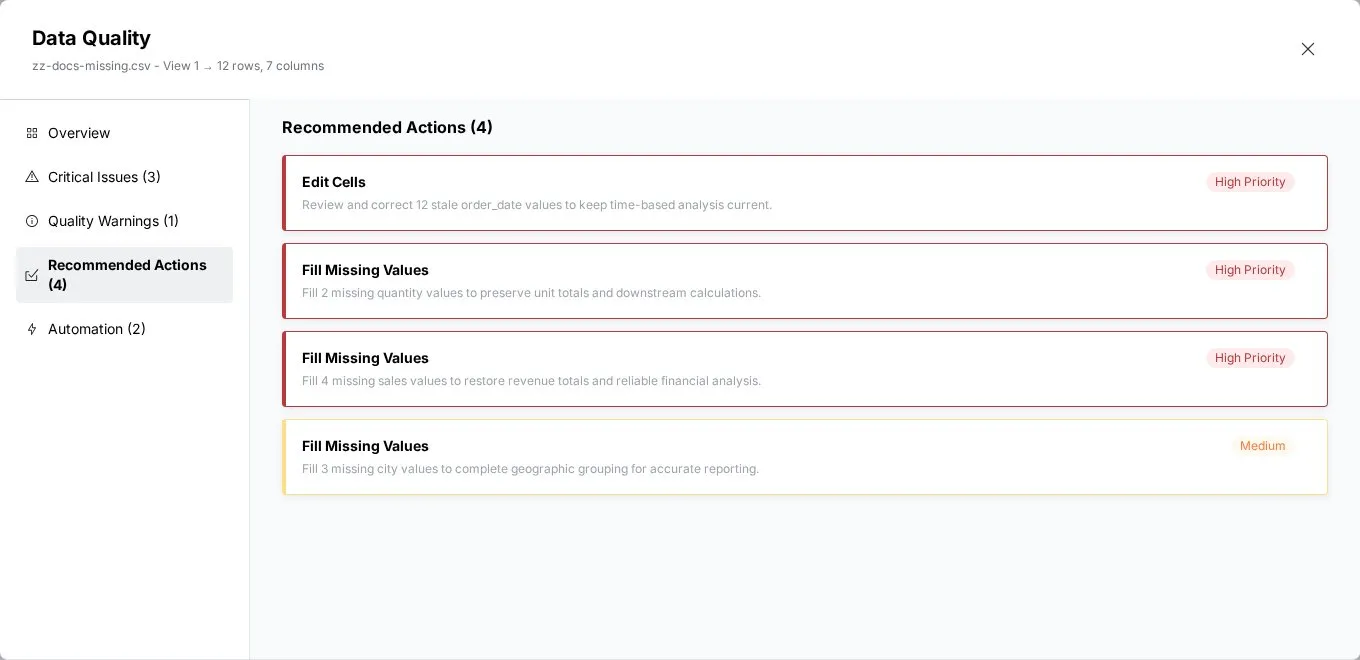
Example scenario: "This data feeds our financial reporting dashboard. I need to validate quality before publishing to executives."
Tip: Run the Data Quality Report immediately after connecting new data sources. Address critical issues before investing time in pipeline development.
Metrics panel
What it does: Create custom metrics, KPIs, and calculations that update with the current View and your explore filters, unless you lock a metric to keep its value fixed while you explore. The Metrics panel produces numeric calculations—it contributes to dashboard preparation but does not itself create dashboards.
Best for:
- Specific business metrics and KPIs
- Dashboard preparation and metric definition
- Custom formulas beyond basic statistics
- Real-time monitoring of key values
When to use:
- Building dashboards and you need specific metrics defined first
- Monitoring business KPIs as you filter
- Custom calculations required (ratios and percentages)
- Comparing multiple aggregation methods
When NOT to use:
- Basic column statistics are sufficient (use Explore Cards instead)
- You need comprehensive data profiling
- Quality validation is the primary concern
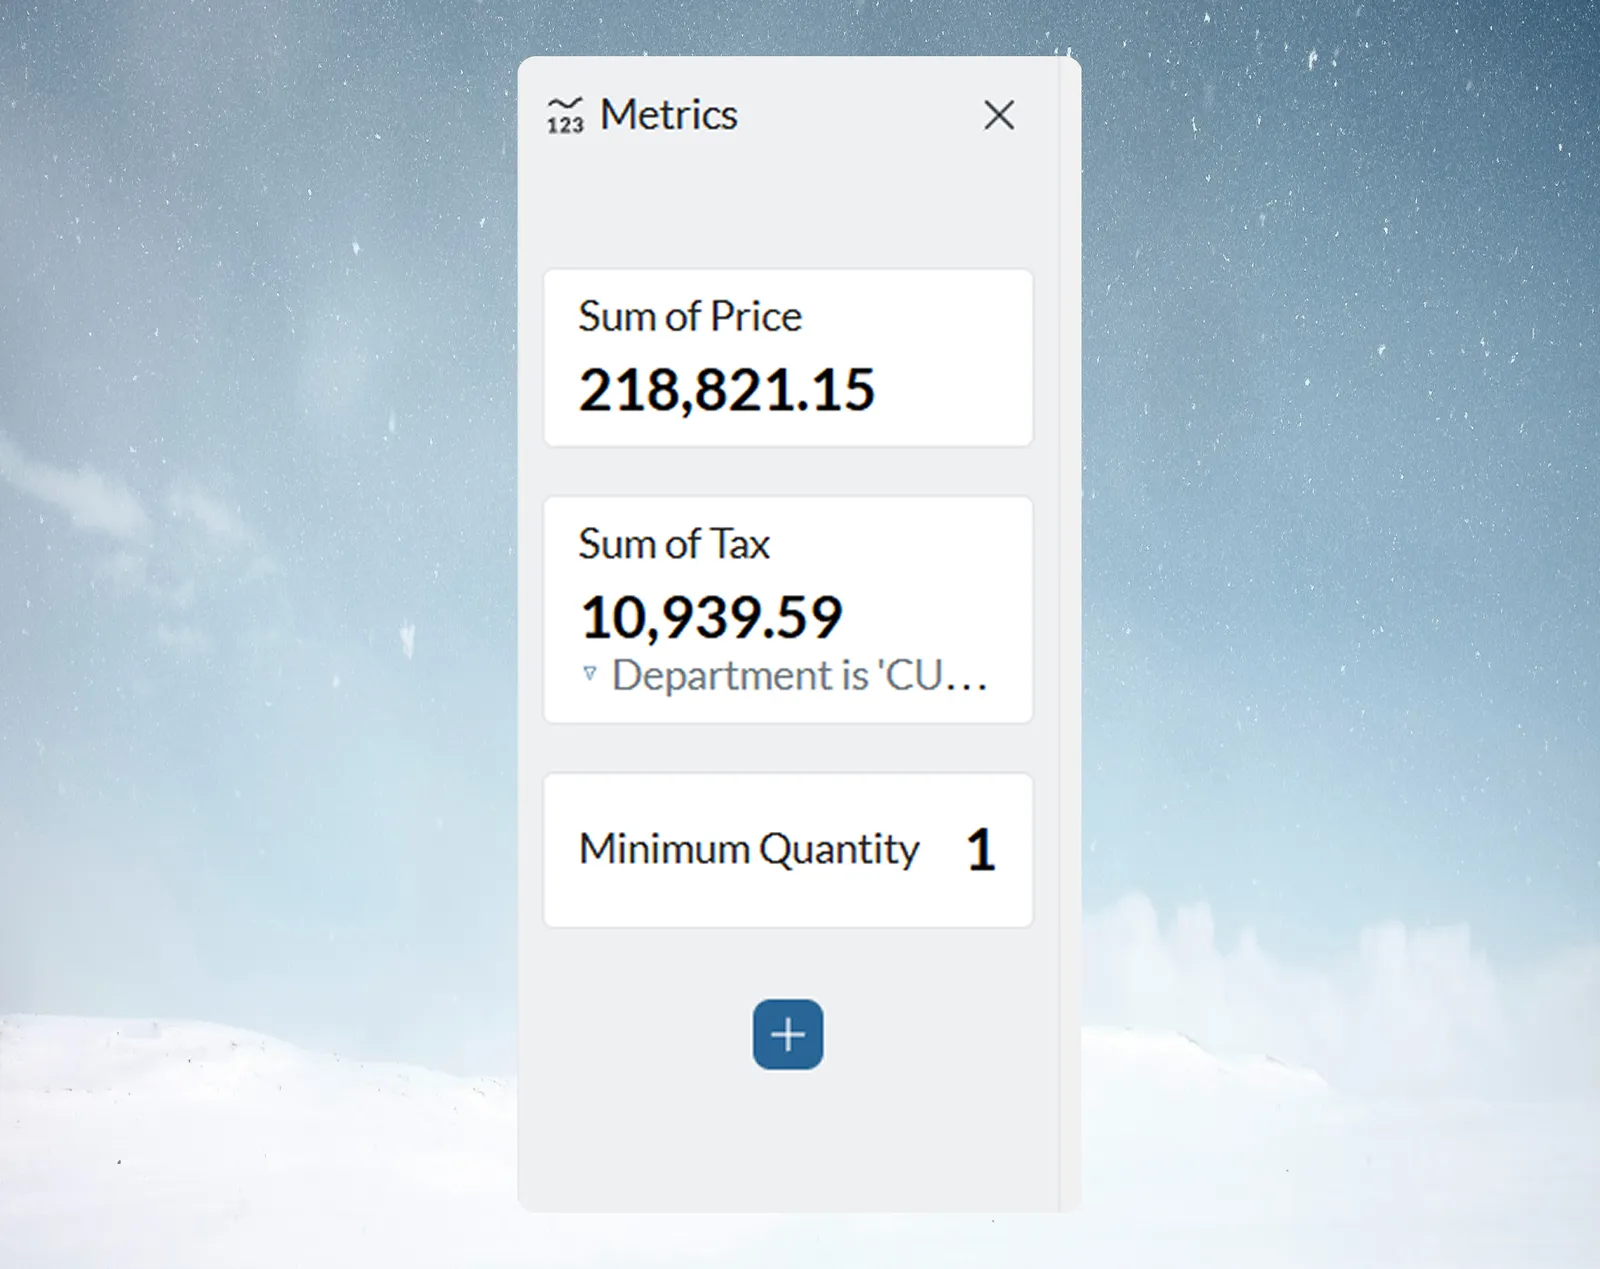
Example scenario: "I'm building a sales dashboard and need to track conversion rates, average deal size, and quota attainment."
Comprehensive tool comparison
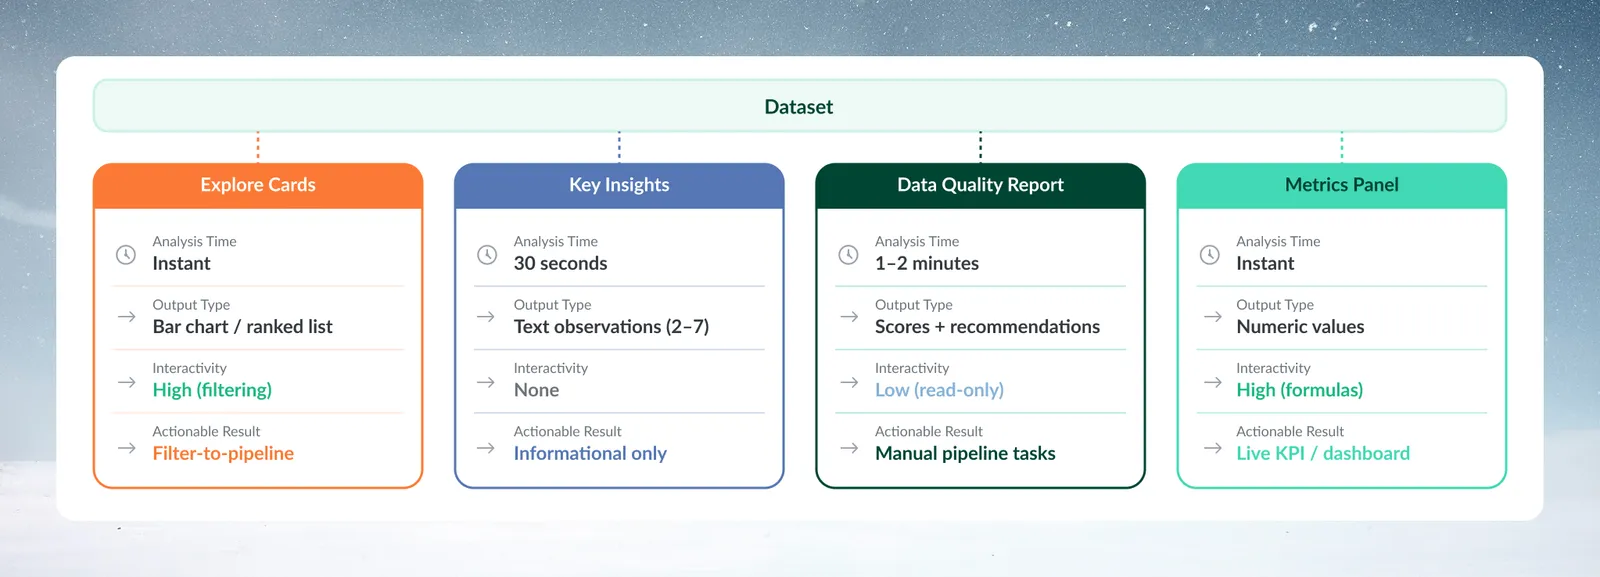
| Tool | Output type | Interactivity | Actionable results |
|---|---|---|---|
| Explore Cards | Text: ranked list (or donut, treemap). Numeric/Date: vertical bar chart (or list; timeline for dates) | High (filtering) | Filter-to-pipeline |
| View Insights | Text observations (3–7) | None | Informational only |
| Data Quality Report | Scores + recommendations | Low (read-only) | Manual pipeline task creation |
| Metrics panel | Numeric values | High (formulas) | KPI calculations / dashboard preparation |
Strengths and limitations
Explore Cards:
- Quick data profiling
- Interactive filtering
- Convert filters to pipeline tasks
- No business context generated
- Limited to the card statistics (Sum, Min, St.Dev, Avg, Max for numeric; Earliest and Latest for dates)
View Insights:
- Business intelligence focus
- Finds unexpected patterns
- Not interactive—no follow-up questions possible
- No export button (copy the text manually)
- Current View scope only
Data Quality Report:
- Comprehensive quality coverage across 6 DAMA dimensions
- Industry standard framework
- Prioritized pipeline task recommendations (High / Medium / Low)
- Read-only report—no one-click fix buttons; recommended tasks must be built manually in the pipeline
- No export of the report
- Current View scope only
Metrics panel:
- Custom calculations and formulas
- Updates with your explore filters, unless a metric is locked
- Supports dashboard preparation
- Requires formula knowledge for advanced use
- Manual setup required for each metric
Workflow integration patterns
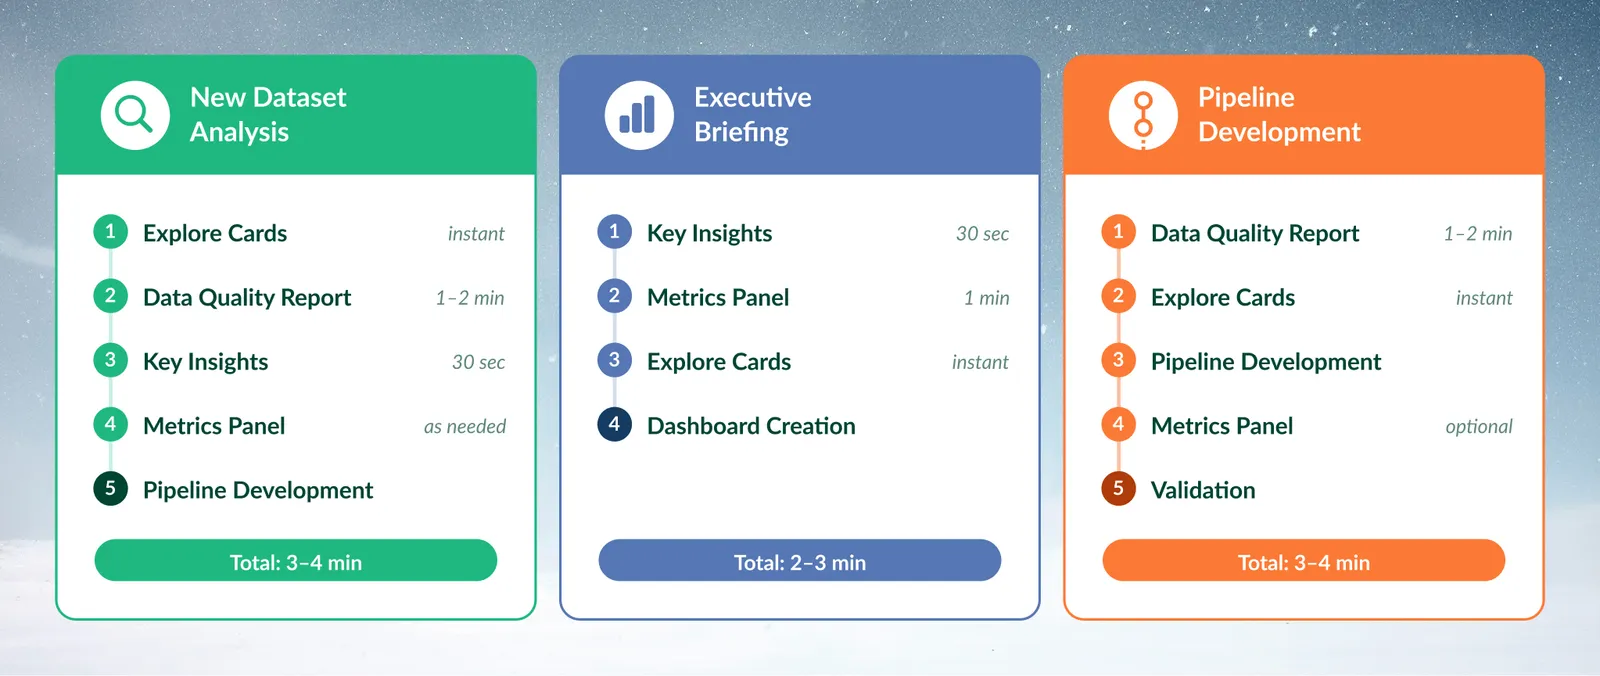
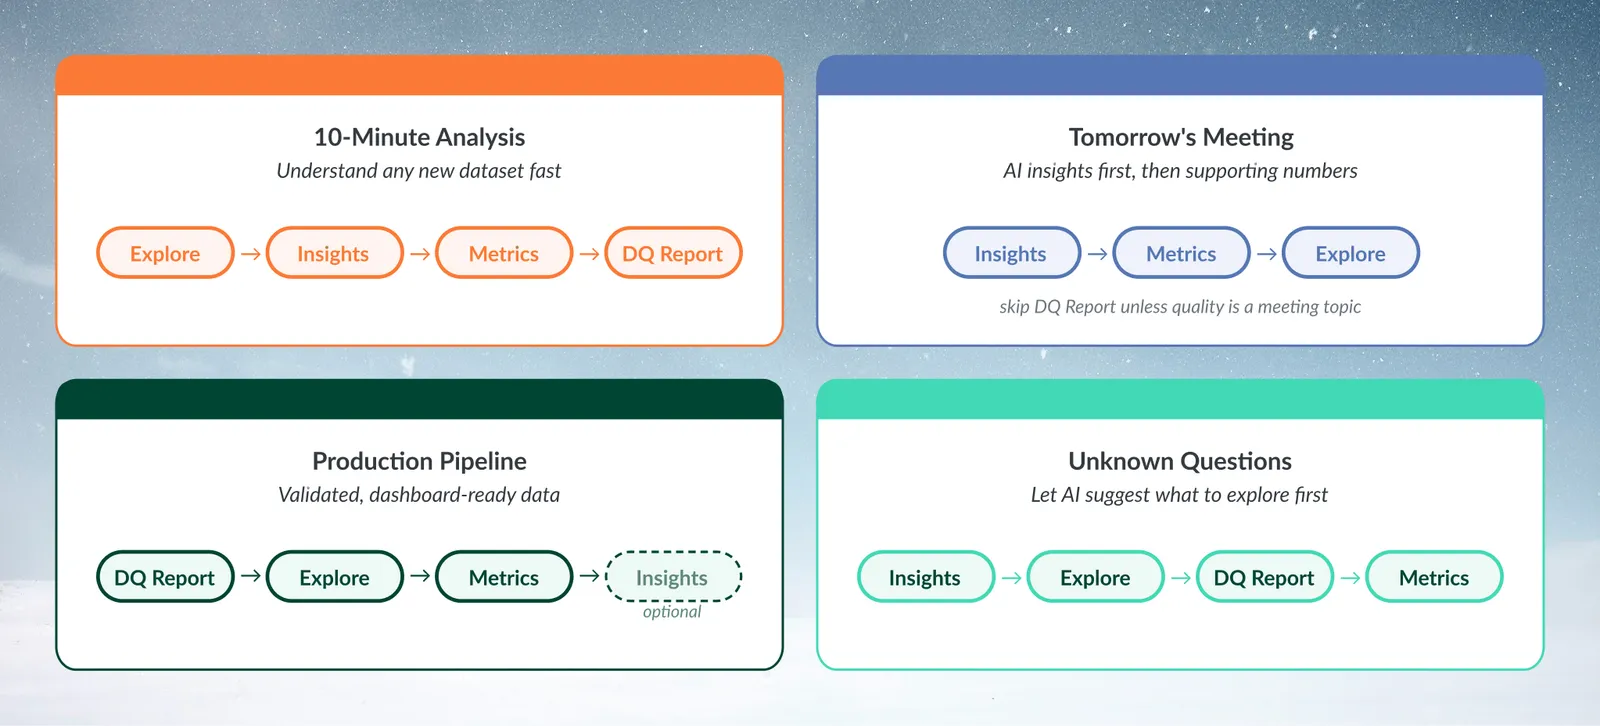
Pattern 1: New dataset analysis
Recommended sequence:
- Explore Cards: Understand structure and distributions
- Data Quality Report: Validate data readiness
- View Insights: Discover business patterns
- Metrics panel (as needed): Define specific KPIs
- Pipeline development: convert discoveries into pipeline tasks
Pattern 2: Executive briefing preparation
Recommended sequence:
- View Insights: Get AI perspective on trends
- Metrics panel: Calculate specific KPIs for presentation
- Explore Cards: Validate insights with visual confirmation
- Dashboard creation: convert metrics to visual presentation
Pattern 3: Production pipeline development
Recommended sequence:
- Data Quality Report: Identify issues requiring fixes
- Explore Cards: Understand data structure for transformations
- Pipeline Development: Build transformations addressing quality issues
- Metrics panel (optional): Define success metrics for monitoring
- Validation: Re-run tools to confirm improvements
Real-world use cases
Financial services: Monthly regulatory reporting
Challenge: Validate transaction data quality before SOX reporting
Solution:
- Data Quality Report: Ensure completeness and accuracy meet audit requirements
- Explore Cards: Check for unusual transaction patterns or outliers
- Metrics panel: Calculate key financial ratios for validation
- View Insights: Generate executive summary for compliance team
Outcome: Complete quality validation and executive briefing from one View
Manufacturing: Production line analysis
Challenge: Investigate quality issues affecting production yield
Solution:
- Explore Cards: Examine defect rate distributions by product line
- View Insights: Let AI surface patterns worth investigating
- Metrics panel: Calculate yield percentages and quality scores
- Data Quality Report: Ensure sensor data integrity for accurate analysis
Outcome: Root cause identified and quality metrics established for monitoring
Hospitality: Revenue management
Challenge: Optimize pricing strategy based on booking patterns
Solution:
- View Insights: Discover seasonal patterns and demand correlations
- Explore Cards: Filter by peak/off-peak periods for detailed analysis
- Metrics panel: Calculate occupancy rates, RevPAR, and ADR metrics
- Data Quality Report: Validate booking data completeness for accurate forecasting
Outcome: Data-driven pricing strategy with validated performance metrics
Common decision scenarios
"I have 10 minutes to understand this dataset"
Recommended approach:
- Start with Explore Cards: Visual overview
- Run View Insights: AI analysis
- Quick Metrics panel setup: Key numbers
- Data Quality Report: Quality validation
- Remaining time: Plan next steps based on findings
"My boss needs insights for tomorrow's meeting"
Recommended approach:
- View Insights first: Business-ready observations
- Metrics panel: Specific numbers to support key points
- Explore Cards: Visual validation if questions arise
- Skip Data Quality Report unless data quality is a meeting topic
"This data feeds our production dashboard"
Recommended approach:
- Data Quality Report recommended: Production benefits from validated data
- Explore Cards: Understand distributions for threshold setting
- Metrics panel: Define dashboard KPIs precisely
- View Insights optional: Unless stakeholder communication is needed
"I'm not sure what questions to ask about this data"
Recommended approach:
- View Insights first: AI suggests patterns to investigate
- Explore Cards: Visual exploration based on AI suggestions
- Data Quality Report: Understand data limitations
- Metrics panel: Calculate interesting ratios discovered during exploration
Advanced integration techniques
Combining tools for comprehensive analysis
Triangulation approach: Use multiple tools to validate findings:
- AI suggests pattern in View Insights
- Visually confirm pattern in Explore Cards
- Quantify pattern with Metrics panel
- Validate data quality in Data Quality Report
Progressive refinement: Start broad, get specific:
- View Insights: "Revenue grew 23% in Q3"
- Explore Cards: Filter to Q3 data for detailed analysis
- Metrics panel: Calculate month-over-month growth rates
- Data Quality Report: Ensure revenue data completeness
Tool output integration
From discovery to action:
- Explore Cards filters → Convert to Pipeline Conditional Filter tasks
- Explore Cards → Add a card's chart to a dashboard from its More options menu (Add to dashboard…)
- Data Quality Report recommendations → Build the suggested tasks in the pipeline
- View Insights patterns → Research further with Explore Cards
- Metrics panel calculations → Feed into dashboards
How each tool refreshes
Explore Cards and Metrics panel: Update as you filter and as the View's data changes.
View Insights and Data Quality Report: Require you to click the button. A saved result is cleared when the View's data changes, and a new one reflects the data at the moment you click.
Troubleshooting common issues
Tool selection problems
Problem: "I used View Insights but need specific numbers"
Solution: View Insights provides business observations, not calculations. Use the Metrics panel for specific numbers and KPIs.
Problem: "The button showed '5 Key Insights' but I only got 3"
Solution: The button label reflects the count at the time of generation—it is dynamic, not fixed. The AI generates between 3 and 7 insights based on data complexity and significant patterns found. The count cannot be set by the user and may differ across sessions on the same dataset.
Problem: "Data Quality Report found issues but I need quick insights"
Solution: Address critical quality issues first by building the recommended pipeline tasks, then run View Insights on the cleaned data for reliable patterns.
Problem: "Explore Cards don't show patterns I expected"
Solution: Check your active explore filters—a card to the right of a filtered card shows only the filtered rows (its header notes this). Use Clear filters to see full distributions, and check that you have added the columns you want to explore.
Workflow timing issues
Problem: "Don't have time to run all tools"
Solution: Prioritize based on your goal:
- Quick overview: Explore Cards only
- Executive briefing: View Insights and Metrics panel
- Production validation: Data Quality Report
- Comprehensive analysis: All tools in sequence
Problem: "Tools give conflicting information"
Solution: Check data scope. Explore Cards and Metrics reflect your active explore filters. View Insights and Data Quality Report both analyze the current View after all pipeline transformations are applied, and explore filters do not change them. To compare equivalent data states, clear the explore filters, or add a Conditional Filter task to the pipeline if you want View Insights or the Data Quality Report to analyze a subset.
Next steps
After using discovery tools to understand your data:
- Convert discoveries into pipeline tasks: use filter-to-pipeline conversion so the logic repeats on every refresh
- Build dashboards: Use Metrics panel calculations as the foundation for dashboard components
- Create documentation: Use View Insights output for dataset documentation
- Establish quality gates: Use Data Quality Report scores as pipeline validation checkpoints
- Share insights: Copy or screenshot findings for stakeholder communication
Start with the tool that matches your immediate need, then add the others as needed.