Your first pipeline
This tutorial is for new Mammoth users. It walks you through building your first pipeline, from loading data to applying transformations.
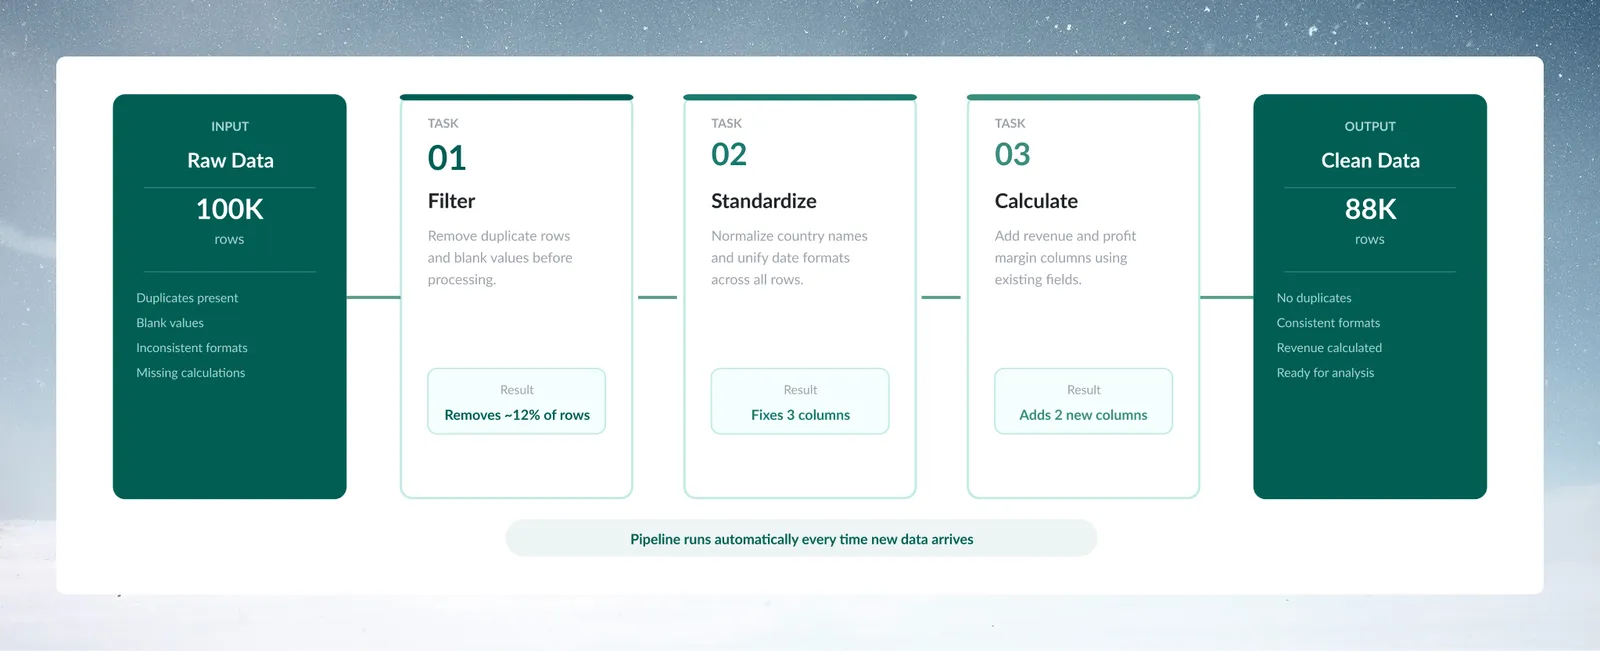
By the end, you'll have a three-task pipeline that filters, standardizes, and calculates new values from the sample data. The same approach turns other data cleanup work into a repeatable pipeline.
Before you begin
What you'll learn in this tutorial
In this tutorial, you'll learn how to:
- Upload or connect to a data source
- Add your first transformation from the transform picker
- See results as you build
- Create multi-task pipelines that execute in sequence
- Save your work for automated future use
Prerequisites for the tutorial
- A Mammoth account with Workspace access
- Sample data (Mammoth provides a sample file) or your own data
Each step includes a screenshot of what you should see and an expected result.
Step 1: Load the Multi-Store Retail Sales data
Before building a pipeline, you need data to transform. You can start with a Mammoth sample file or your own file.
Option A: Use the sample data (recommended for first time)
- Open any Project in your Workspace
- Click New Dataset
- In the New Dataset dialog, click Sample Files
- Select the Multi-Store Retail Sales dataset
- Click Create new dataset. Mammoth creates a Dataset and opens a View.
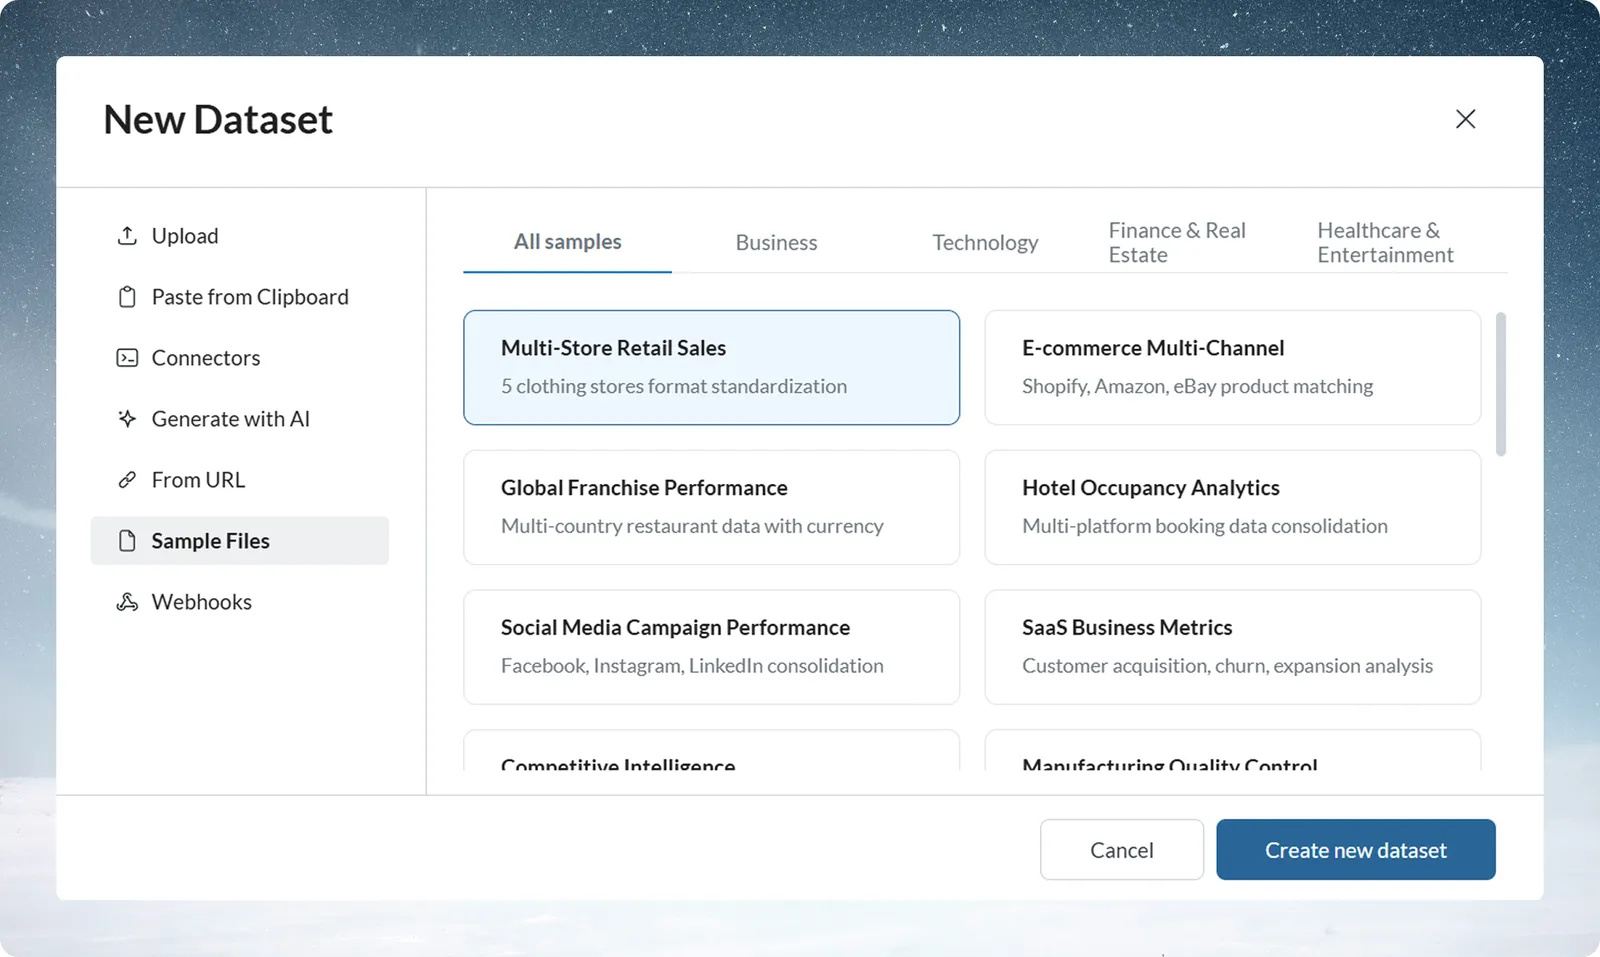
The sample file contains retail sales data, so you can learn pipeline basics without preparing your own data.
Option B: Upload your own file
- Click New Dataset in the Project
- Select your Excel, CSV, or other supported file
- Wait for the upload to complete
- Mammoth creates a Dataset and opens a View
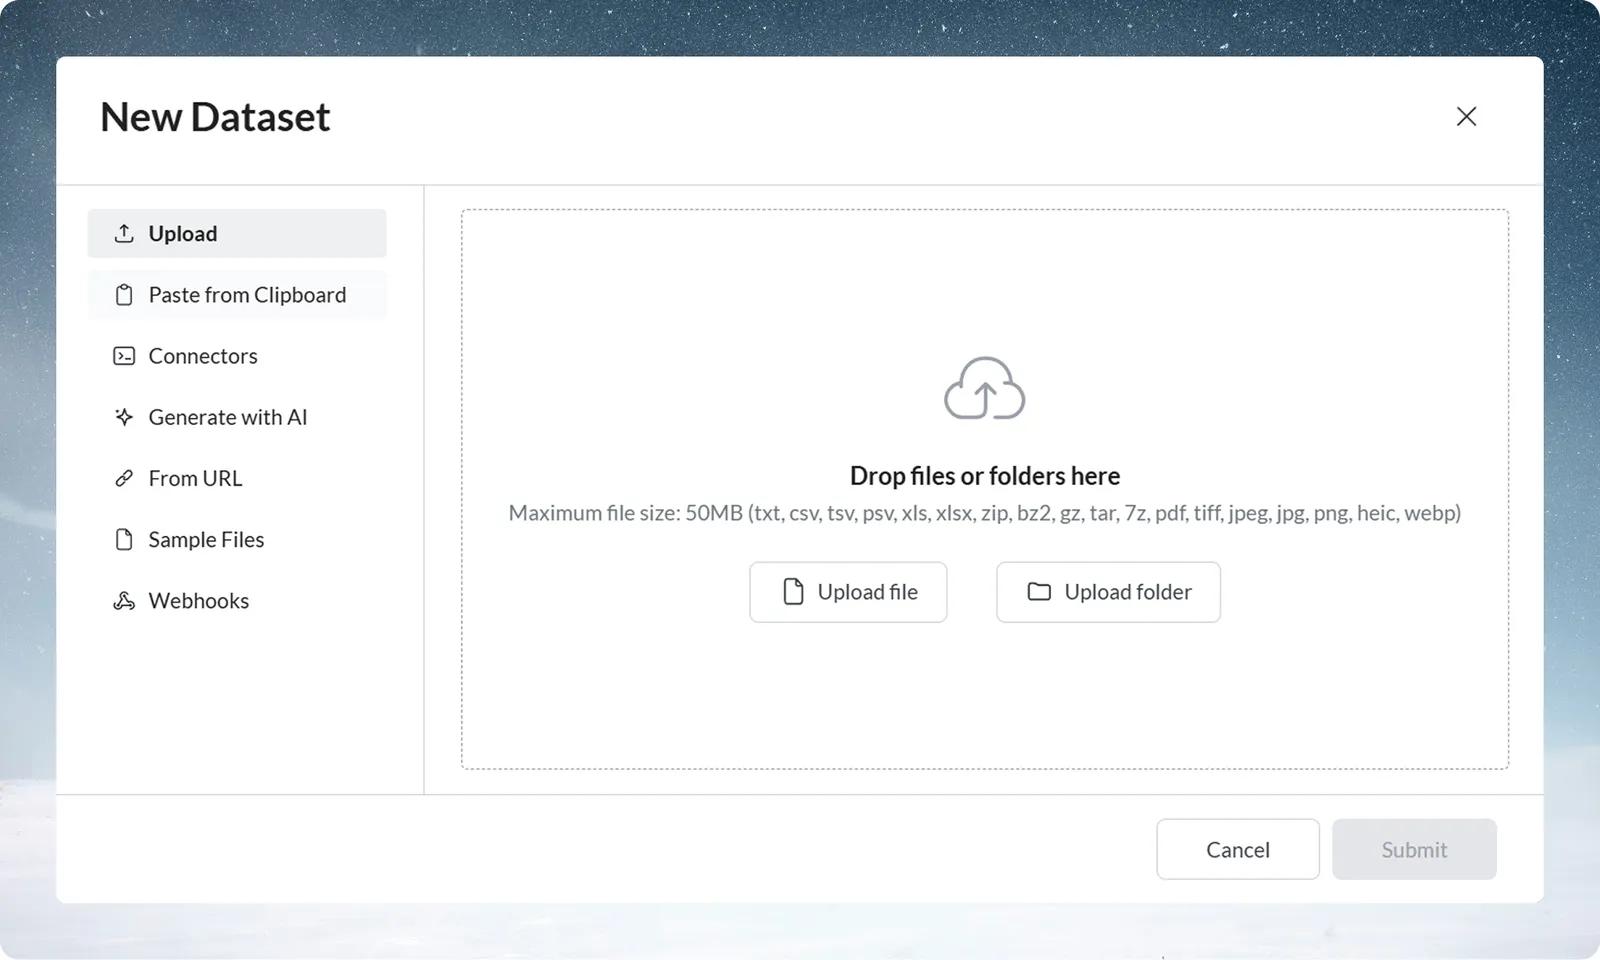
Start with the sample data for your first pipeline, then apply the same techniques to your own data.
What the View shows after loading data
After you load data (sample or your own) and open the Dataset, your screen displays:
- Data grid showing your data like a spreadsheet
- Pipeline panel on the left (empty for now—this is where your transformations will appear)
- A + button (tooltip Add a task) that opens the transform picker
- Explore Cards above the data grid showing column distributions
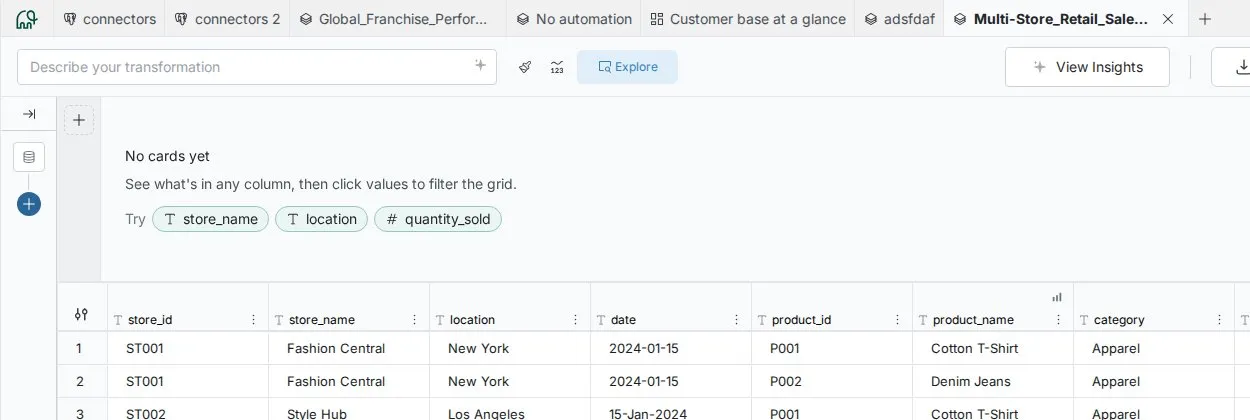
Expected result: The grid shows data rows and the Pipeline panel shows "Pipeline (0)". You're ready for Step 2.
Step 2: Add a Conditional Filter task for high-revenue orders
This step filters the data to show only orders with a total revenue over 100.
Open the transform picker
- Click the + button (tooltip Add a task)
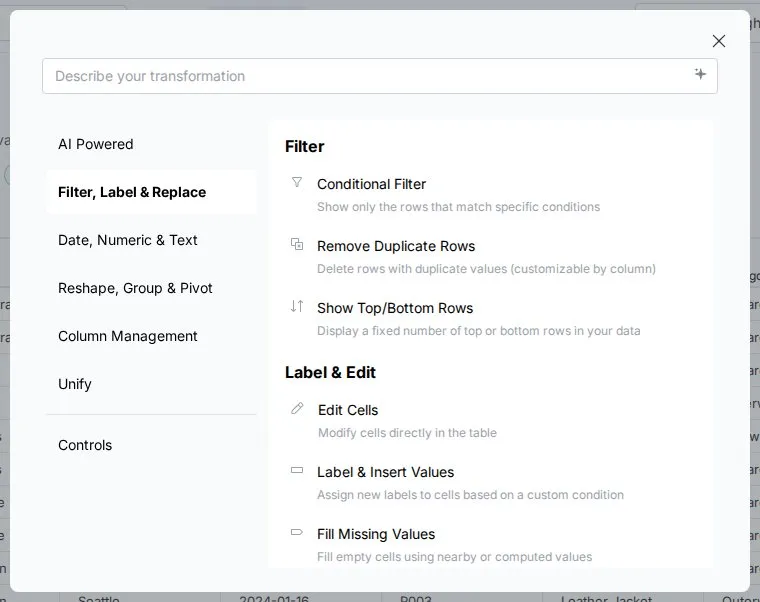
- The transform picker opens with a search box (Describe your transformation) and the transformation categories
- The categories are AI Powered, Filter, Label & Replace, Date, Numeric & Text, Reshape, Group & Pivot, Column Management, Unify, and Controls
Navigate to the Conditional Filter function
- Click the Filter, Label & Replace category
- Scroll through the function list to find Conditional Filter, or type its name in the search box
- Click Conditional Filter
- The Function Panel opens at the bottom of your screen
Configure the Conditional Filter
Set up the filter logic in the Function Panel:
- Column to filter: Click the dropdown and select total_revenue(or similar revenue column)
- Condition: Select is greater than from the operator dropdown
- Value: Enter 100 in the numeric field
- Filter type: Keep Show selected (this keeps rows matching your condition)
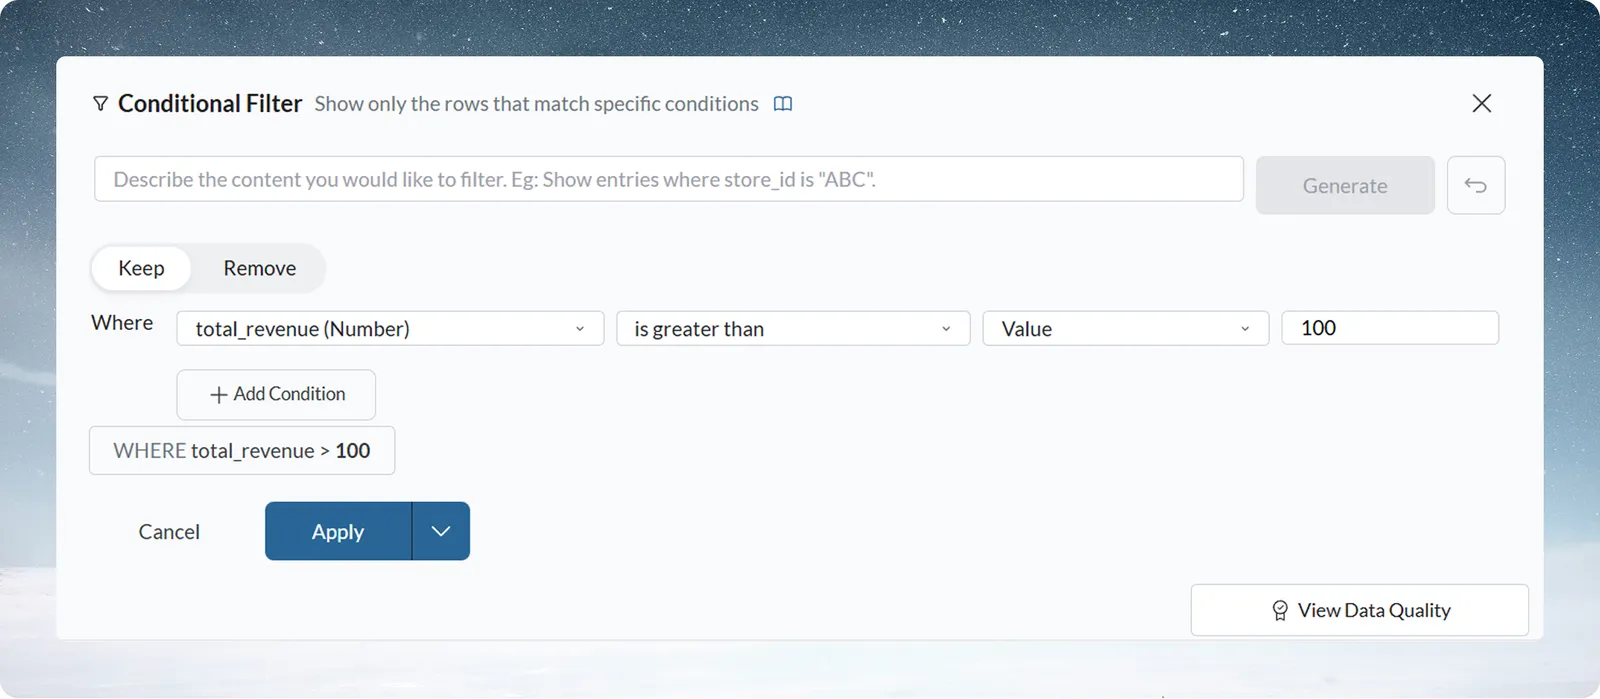
The Function Panel shows a clear summary of what will happen: "Show rows where total_revenue is greater than 100."
Apply the Conditional Filter
- Click the Apply button in the Function Panel
- The Function Panel closes automatically
- The Pipeline panel on the left now shows: "1. Conditional Filter"
- Your data grid updates to show only orders with total_revenue over 100
- Notice the row count at the bottom changes (you'll see fewer rows now)
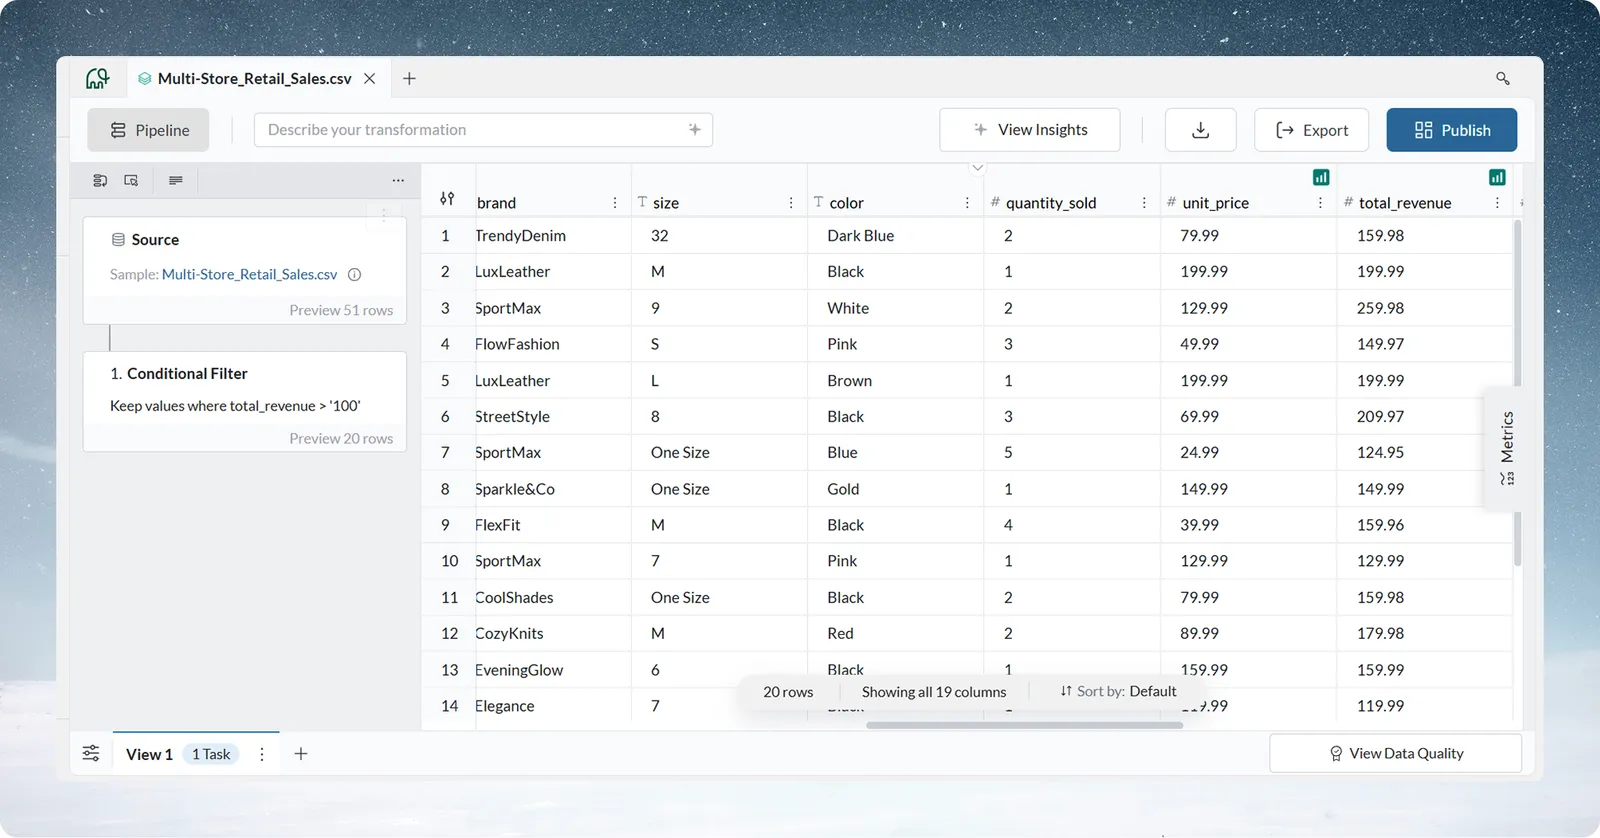
What the Conditional Filter did
You've created your first reusable transformation:
- The filter logic is saved in your pipeline as a task
- The pipeline executed automatically (because Draft Mode is off by default)
- Your data now shows only high-value orders
- Most importantly: this filter will automatically apply to any future data you add to this Dataset
Expected result: The Pipeline panel shows one task, and the data grid displays fewer rows than before, all with total_revenue values above 100.
Step 3: Standardize product names with Bulk Replace
This step standardizes text values that have slight variations. Use Bulk Replace to detect and standardize variations in the product_name column.
Open Bulk Replace
-
Click the + button
-
Go to Filter, Label & Replace
-
Select Bulk Replace
The Bulk Replace panel opens.
Detect product name variations in Bulk Replace
-
Select product_name in the Selected column dropdown
-
Open the Group Suggestions tab
-
Under Grouping Settings, choose a grouping method:
-
Smart
-
Similarity: Groups based on calculated similarity
-
Spelling Match: Groups spelling variations
-
Common Patterns: Groups by shared word patterns
-
-
Review the group suggestions
Each group shows:
-
Suggested grouped values
-
The number of occurrences
-
A + icon to create a replace rule
To proceed:
-
Click + for individual groups, or
-
Select Create all Group Suggestions to generate all rules at once.
You can also move values between groups and remove groups you don't want.
Review and adjust the Bulk Replace groups
-
Edit the standardized value if needed
-
Remove any group that should not be merged
Apply Bulk Replace
- Click Apply
The system updates the data grid with standardized product_name values based on the groupings.
Result of Step 3
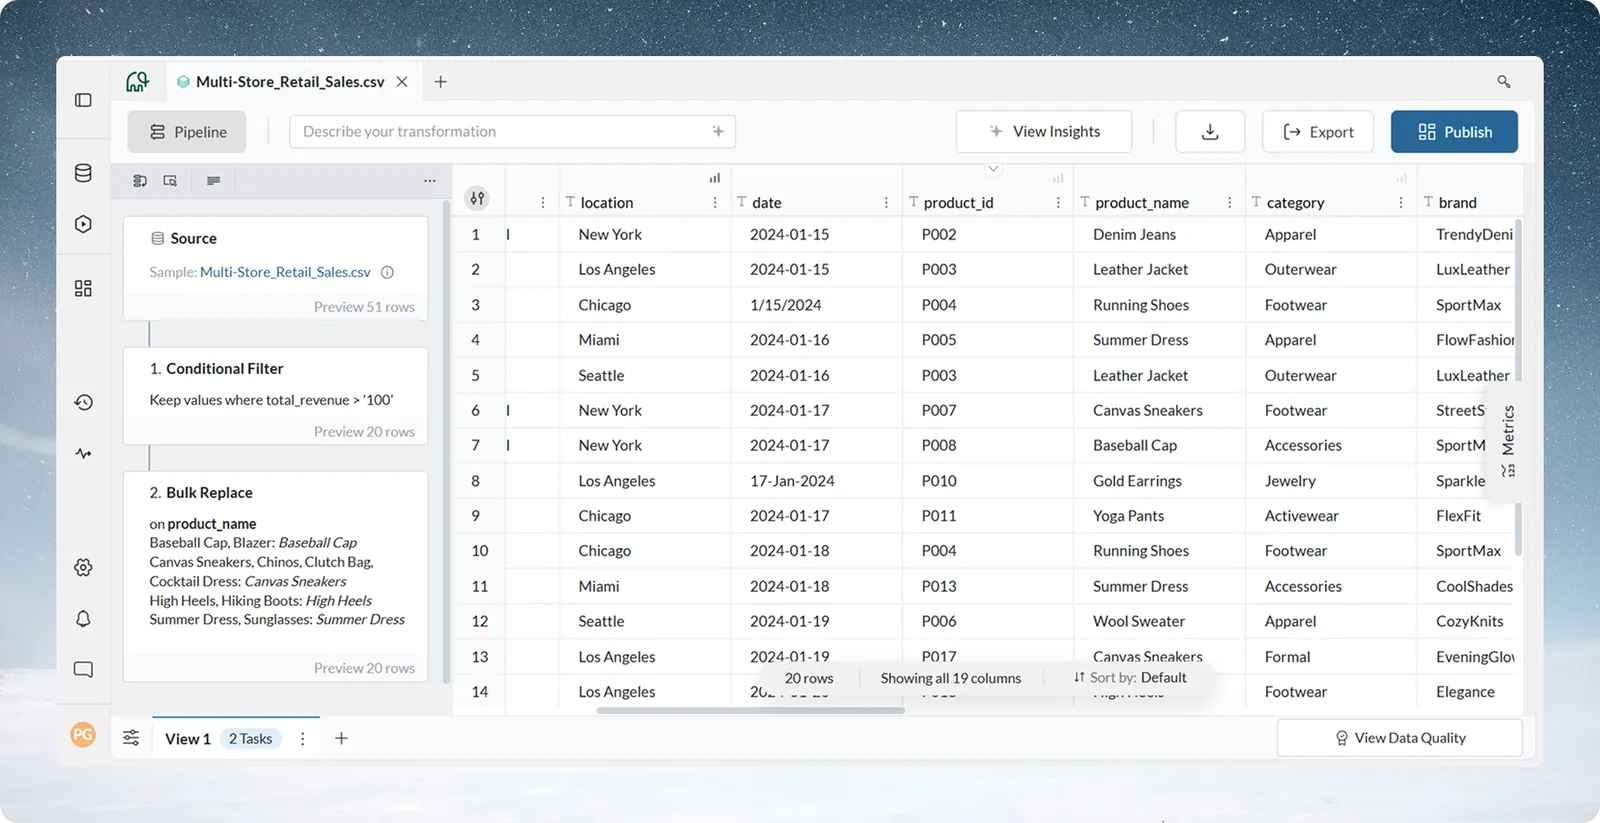
The Pipeline panel now includes:
-
Conditional Filter
-
Bulk Replace
Your product names are now standardized.
Step 4: Add a Gross_Sale column with Math Functions
This step creates a new column with calculated values: gross sales based on quantity and unit price.
Open Math Functions
- Click the + button
- Navigate to the Date, Numeric & Text category
- Select Math Functions
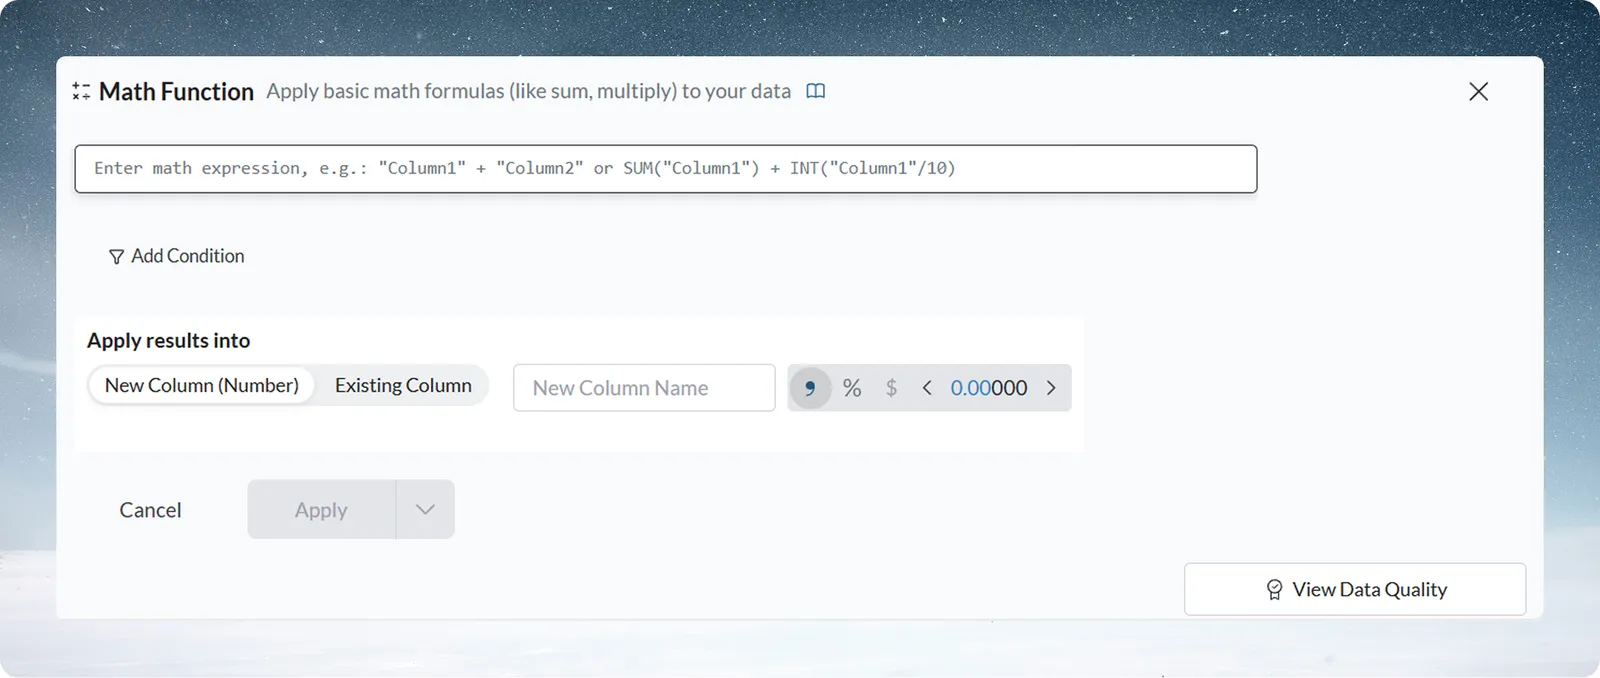
- The Function Panel opens for mathematical operations
Configure the Gross_Sale calculation
- New Column Name: Enter "Gross_Sale"
- Formula: Build your calculation using column names and operators
- Example:
quantity_sold * unit_price
- Example:
- Review the formula preview showing sample calculations
- Click Apply
Your pipeline now has three tasks, and the data grid shows your new Gross_Sale column with calculated values for every row.
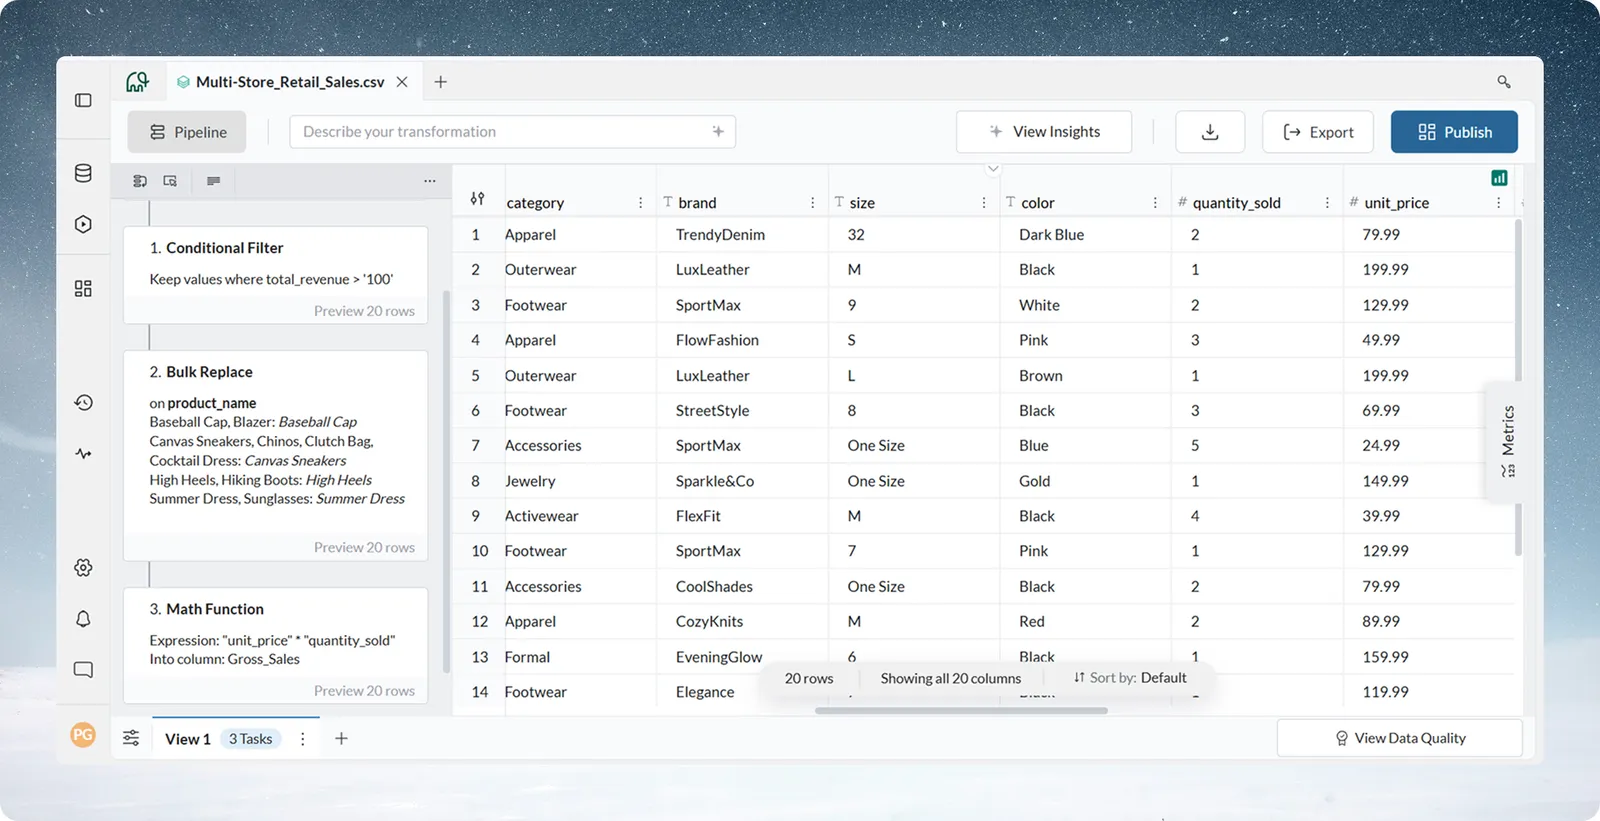
Expected result: The Pipeline panel displays three tasks, and scrolling right in the data grid reveals your new calculated column.
How the three-task pipeline runs
Your pipeline is a sequence of three transformations that execute in order.
Pipeline structure
Pipeline (3)                           ← Total number of tasks
├── 1. Conditional Filter              ← First task (executes first)
│   total_revenue> 100
│   Rows filtered
│
├── 2. Bulk Replace                    ← Second task (executes second)
│   product_name variations grouped
│   Result: Names standardized
│
└── 3. Math Functions                  ← Third task (executes last)
    Create Gross_Sale column
    Result: New column added
How tasks execute
When you run the pipeline (or when it runs automatically), Mammoth:
- Starts with your original data
- Applies Task 1 (Conditional Filter) → creates intermediate result
- Takes that result and applies Task 2 (Bulk Replace) → creates another result
- Takes that result and applies Task 3 (Math Functions) → creates final output
This sequential execution means each task works with the output of the previous task—like a recipe where each task builds on the last.
Task options in the Pipeline panel
Hover over any task in the Pipeline panel to see available options:
- Edit: Modify the task's configuration (reopens Function Panel)
- Preview Data at this Task: See what the data looks like after this specific task (without later tasks)
- Paste below: Add a new transformation below the selected task
- Add note: Document why you added this task (business logic notes)
- Duplicate: Create a copy of this task
- Delete: Remove the task from the pipeline
- Suspend: Suspend the task from pipeline
- Rename: Rename a task in the pipeline
Reordering tasks in the Pipeline
You can drag and drop tasks to change execution order:
1. Click on the Reorder icon from the top toolbar in the pipeline
2. Hover over a task in the Pipeline panel
3. Click and hold the drag handle (⋮⋮ icon)
4. Drag up or down to the new position
5. Release to drop
6. Click on Reorder Tasks
Important: Mammoth validates dependencies automatically. If Task B uses a column created by Task A, you cannot move Task B before Task A. The system will show a warning and prevent the reorder.
Reviewing the results of the pipeline
Before and after comparison
Starting point:
-
All rows with various revenue values
-
Brand values with variations
-
No Gross_Sale calculation
After your pipeline:
-
Only rows where total_revenue > 100
-
Standardized product values
-
New Gross_Sale column showing calculated totals
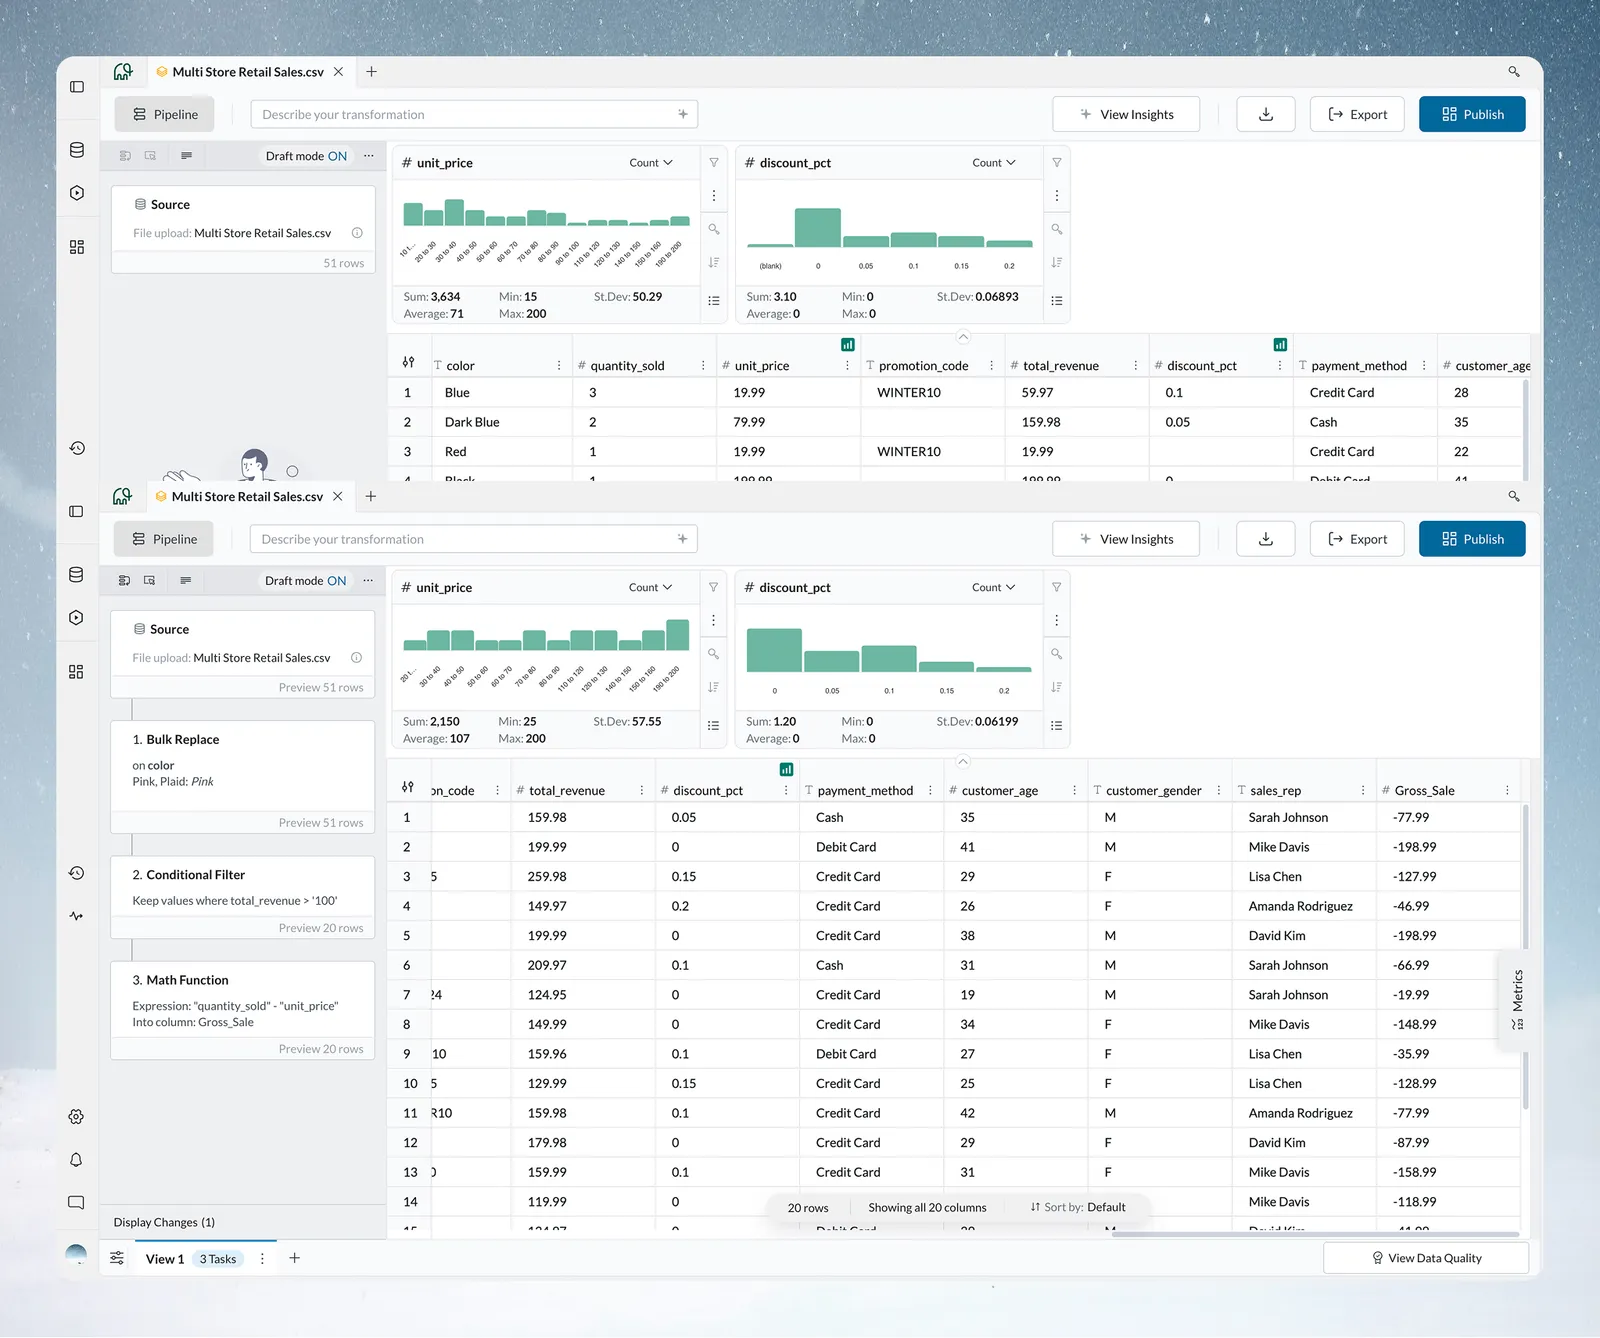
The screenshot compares the original data on top with the transformed data on the bottom (20 rows, clean names, and 20 columns including Gross_Sale).
Verify the pipeline results
Use these methods to confirm everything worked correctly:
Check the Metrics Panel (right side):
- Shows row count changes
- Displays summary statistics
- Updates dynamically with each transformation
Scroll through the data grid:
- Verify total_revenue values are all above 100
- Check product_name for consistency
- Look at Gross_Sale calculations
Use "Preview Data at this Task":
- Hover over any task in the Pipeline panel
- Click on Preview x rows from any task
- See exactly what the data looked like after that task
- Useful for debugging multi-step pipelines
Checking each task in turn shows where an issue occurs if results don't match expectations.
Saving and reusing the pipeline
Your pipeline is saved automatically.
The pipeline is already saved
Every task you add gets saved immediately to this View. There's no separate "save" button to remember. This means:
- Your pipeline persists in this View permanently
- You can close the browser and come back later
- Other team members with View access see the same pipeline
- The pipeline won't be lost if your browser crashes
What you can do with the pipeline
After you build a pipeline, you can:
Apply to new data automatically:
When you add new batches of data to this Dataset, your pipeline runs automatically, applying the same transformations. This means next month's data gets filtered, standardized, and calculated exactly the same way, with no manual work.
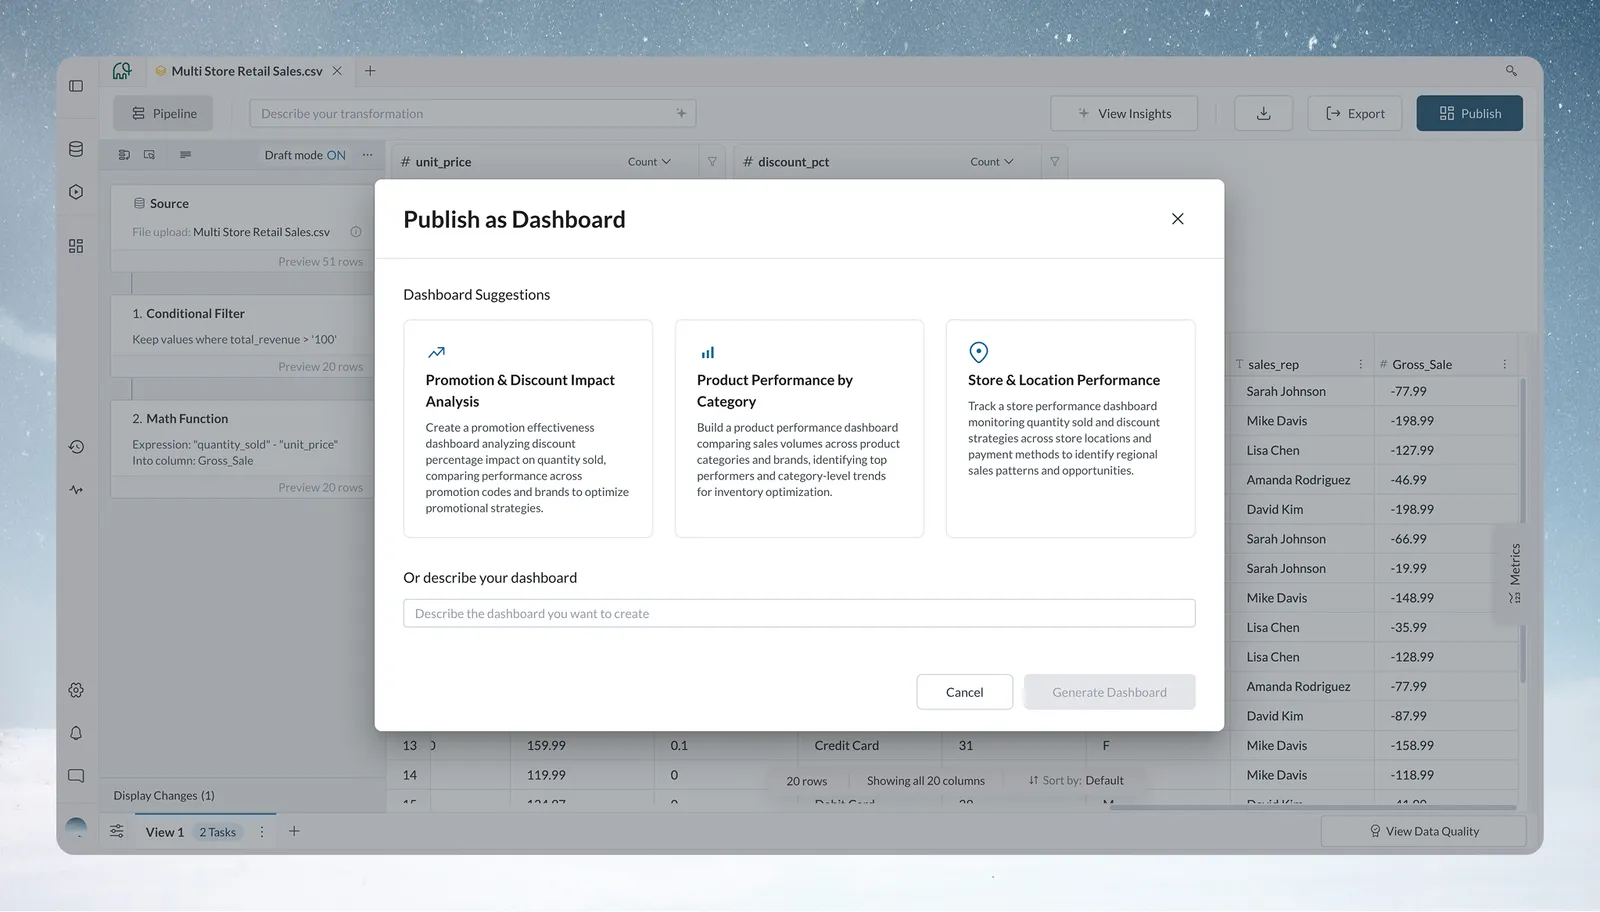
Create a dashboard:
- Click Create to open What do you want to build?
- Pick your transformed data under With my data. Mammoth shows starting points based on your columns and dates, or you can describe what you want
- Choose a starting point or describe your dashboard
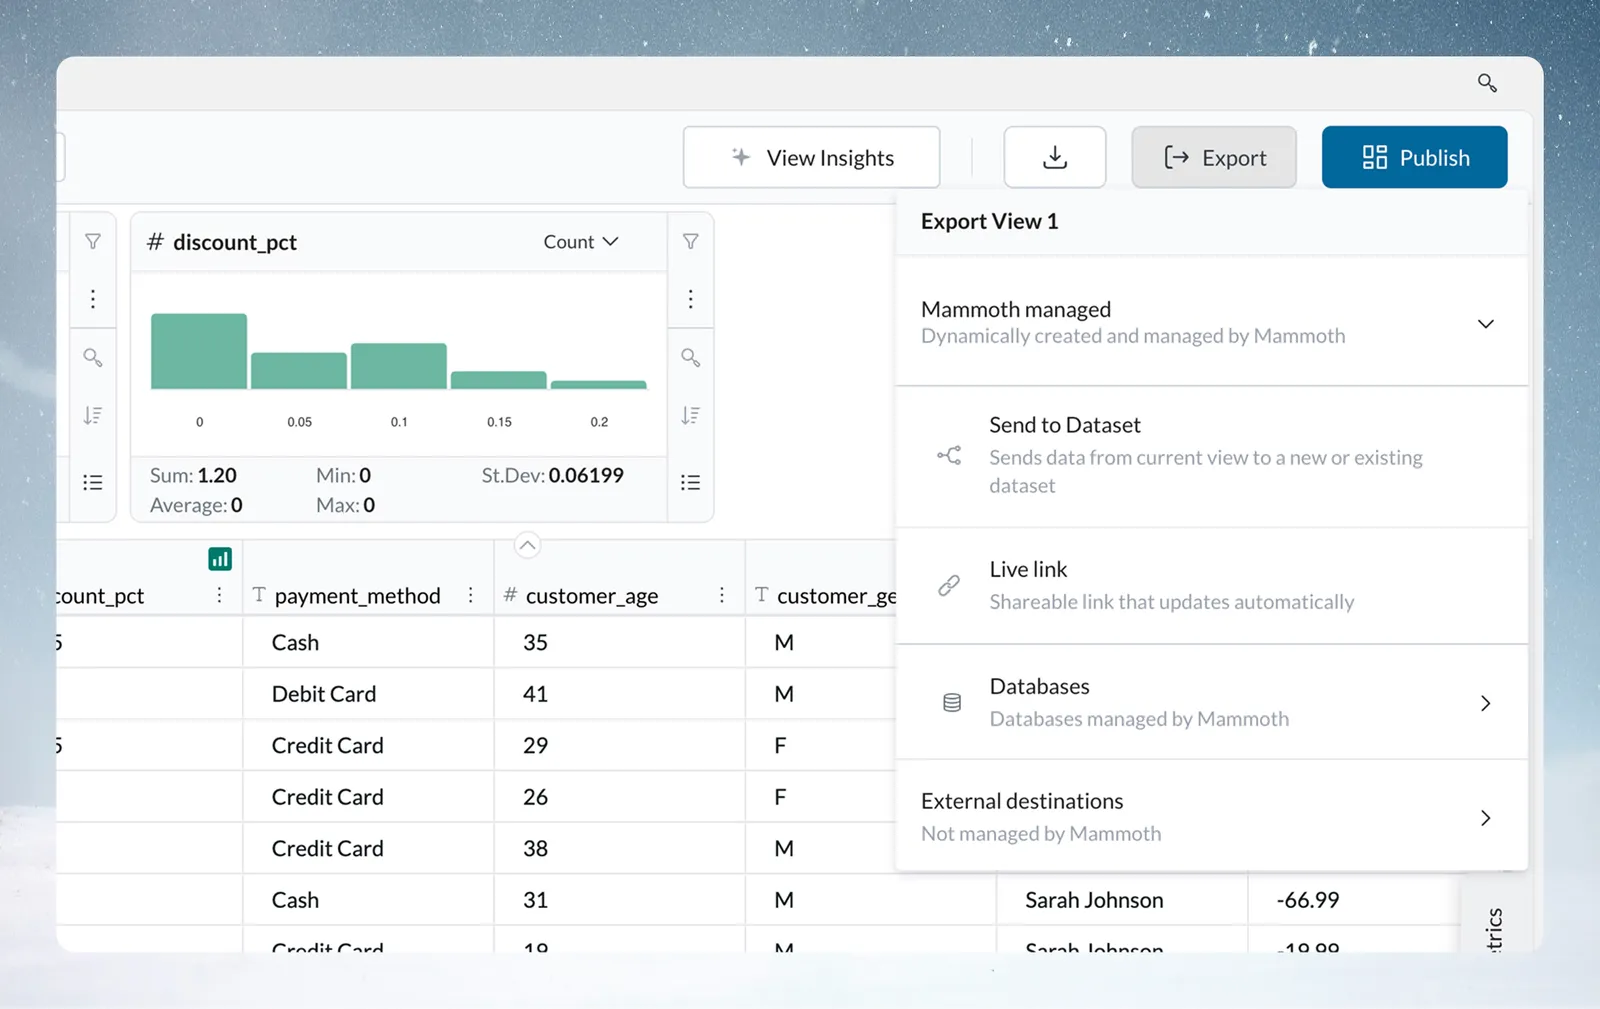
Export your transformed data:
- Click the Export button
- Choose your format: Excel, CSV, live link, database, or cloud storage
- Your transformed data exports ready for use in other tools
Schedule automatic refresh:
- Set up automation to refresh your data on a schedule
- Your pipeline runs automatically with each refresh
- Transformed data stays current without manual intervention
Next steps after the first pipeline
Now that you understand pipeline basics, you can:
- Try Describe your transformation: Click +, describe what you want in plain English in the search box, and let AI build the task for you
- Explore more transformations: The transform picker has functions for date operations, text formatting, joining data, and more
- Build production pipelines: Apply these techniques to your real business data
- Set up Automations: Configure Automations to run pipelines on schedules
For large datasets, turn on Draft Mode before adding multiple tasks. This lets you build your entire pipeline first, then execute all tasks at once instead of processing after each addition.
Common first-pipeline problems and solutions
These are the issues new users encounter most often.
Problem 1: "my transformation didn't work"
Symptoms: You added a task, but the data didn't change
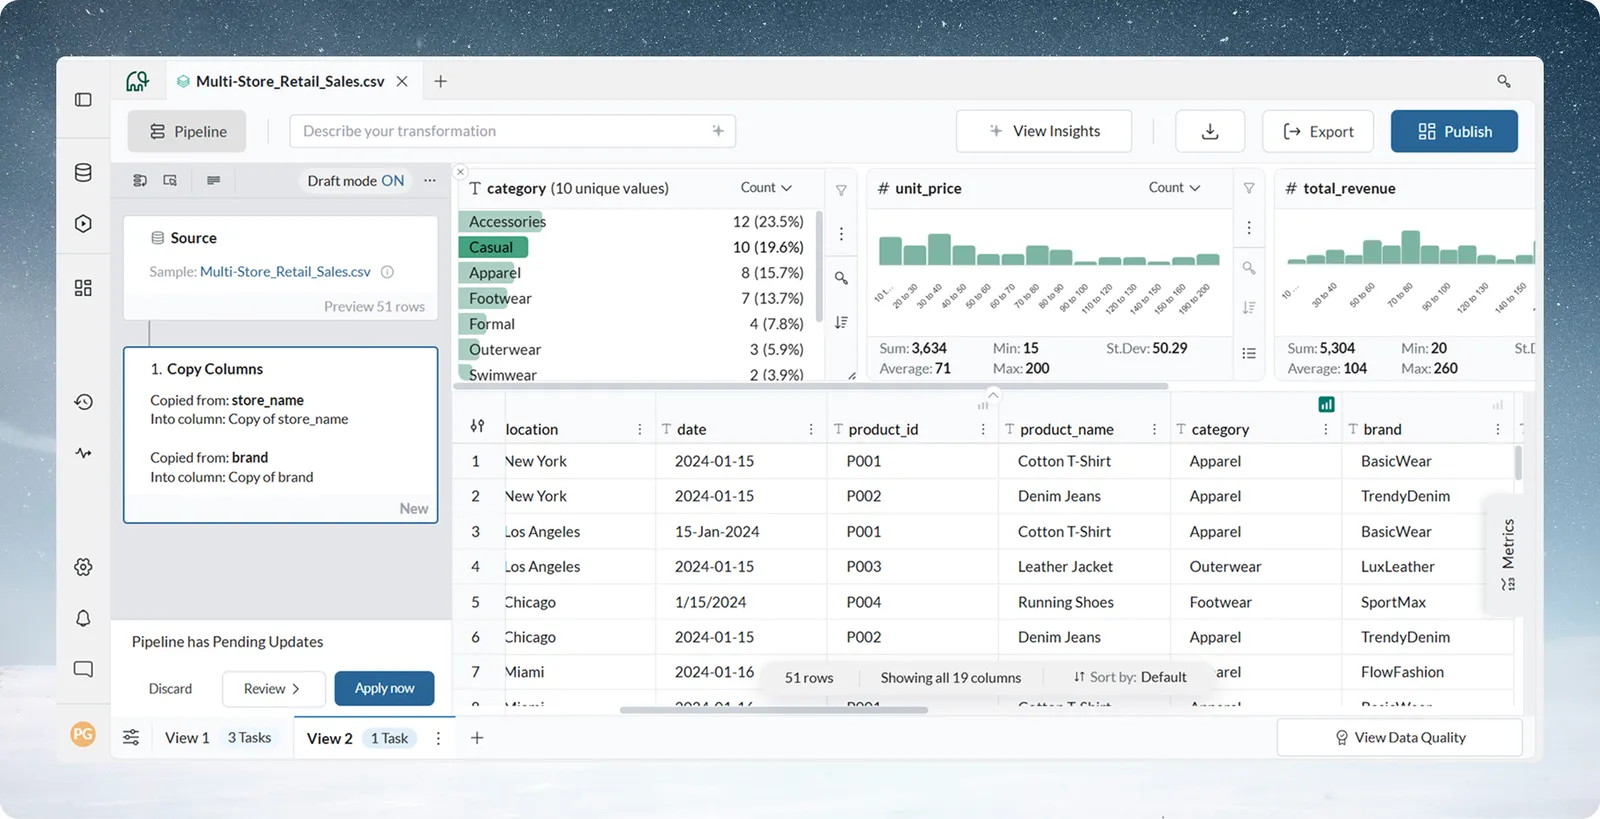
Solution: Check if Draft Mode is ON. When Draft Mode is enabled, tasks appear in the Pipeline panel but don't execute until you click Apply now at the bottom of the Pipeline panel. Look for a blue indicator on tasks—this means they're drafted but not executed.
Problem 2: "I don't see the column I need"
Symptoms: Your required column doesn't appear in dropdown menus
Solution: Check the pipeline task order. If Task B creates a new column, and Task A tries to use that column, Task A can't find it yet. Reorder your tasks so the column-creating task comes first. Alternatively, add the task that creates the column earlier in your pipeline.
Problem 3: "data looks wrong after my transformation"
Symptoms: Results don't match expectations after applying a task
Solution: Use "Preview Data at this Task" to identify where things went wrong:
- Hover over each task in sequence, click on Preview X rows
- It will show Preview Data at this task
- Find the task where data became incorrect
- Edit that specific task to fix the issue
This technique lets you isolate problems in complex multi-task pipelines without deleting everything.
Problem 4: "I want to undo a transformation"
Symptoms: You applied a task and want to remove it
Solution: Delete the task from the pipeline:
- Hover over the task in the Pipeline panel and click on More options(three dot menu)
- Click the Delete icon (trash can)
- Confirm deletion
- The pipeline re-executes without that task, and your data reverts to the previous state
Problem 5: "the Function Panel is confusing"
Symptoms: You're not sure what parameters mean or how to configure a task
Solution: Every parameter in the Function Panel has contextual help:
- Hover over any field to see a tooltip explanation
- Click the (?) icon next to parameters for detailed help
- Use Describe your transformation in the transform picker if visual configuration feels overwhelming: describe what you want, and AI configures the task for you
- For each transformation in the Function Panel, click the Help (book icon) to open the corresponding documentation page for detailed guidance.
Quick reference for first pipelines
Most common first transformations
These are five transformations new users often need:
- Conditional Filter - Remove unwanted rows based on criteria
- Bulk Replace - Standardize text values with variations
- Convert Column Type - Fix data types (text to number, text to date)
- Remove Duplicate Rows - Clean duplicate records
- Math Functions - Calculate new values from existing columns
Pipeline best practices
Follow these principles for successful pipelines:
Start with filters:
Reduce dataset size early by filtering out unnecessary rows. Smaller data makes later tasks faster.
Use Draft Mode for complex workflows:
If you're adding 5+ tasks, turn on Draft Mode. Build your entire pipeline, then execute once. This also helps you think through the full transformation logic before processing.
Add comments to tasks:
Document business logic, calculation formulas, or decision criteria. Future you (and your teammates) will appreciate the context.
Test with small data first:
If you have a large dataset, build and test your pipeline on a small sample file first, then apply it to the full dataset once it's working.
You've built your first pipeline. The skills you practiced here (filtering data, standardizing values, and adding calculations) apply to many data preparation tasks. Next, read Core concepts, or explore the Transform section.