Explore Cards—interactions
Explore Cards respond to your clicks in two ways: a single click selects values for careful investigation, and a double-click filters right away. Progressive discovery means filtering one card to reveal patterns in the cards that follow it.
Key interaction types:
- Click: Select values (no filtering yet)
- Double-click: Filter to a value right away
- Filter and Exclude: Apply or invert a selection
- Filter badge: See and manage active explore filters
- Filter-to-pipeline: Convert explore filters into a pipeline task or a new View
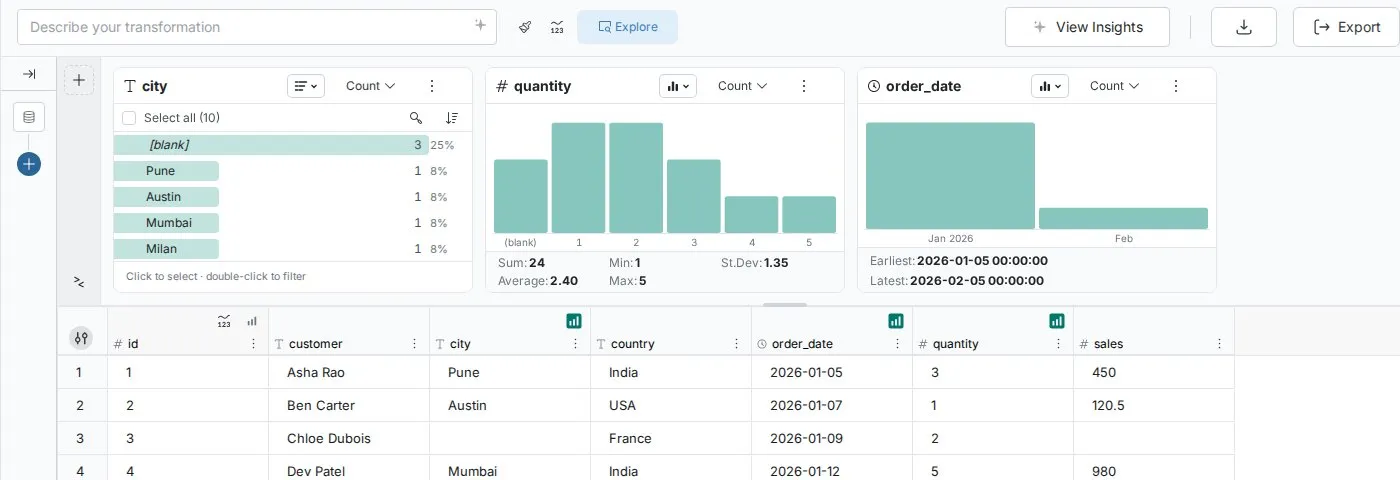
Click: select values
Clicking a value in an Explore Card selects it without filtering your data. You can select several values, then decide what to do with them.
What happens on click
- The value is marked as selected in the card (a checkbox in list views, a highlighted bar in chart views)
- A selection bar appears showing how many values and rows are selected, with Filter, Exclude, and Clear selection buttons
- The data grid remains unchanged (no filtering applied)
Selecting more than one value
- Click more values to add them. A plain click toggles a value on or off.
- Shift-click to select a run of values from the last one you clicked.
- Drag across bars in a chart view to select a range.
- In list views, Select all and Invert select every value or flip the selection.
Select values, then choose what to do with them:
- Filter (or press Enter)—show only rows with the selected values
- Exclude—hide rows with the selected values
- Clear selection (the × button, or press Esc)—deselect everything
You need edit access to the workspace to filter. Viewers can still read the cards.
Actions in the More options menu
The card's More options (⋮) menu offers shortcuts. With values selected, and when you can edit the View, it offers transformation shortcuts that open the matching function in the Functions panel with your selection filled in, so you can review it before applying:
For text columns:
- Replace all values like this (opens Bulk Replace)
- Remove all values like this (opens Conditional Filter set to remove)
- Keep all values like this (opens Conditional Filter set to keep)
For numeric and date columns:
- Replace all values like this (opens Label & Insert Values)
- Remove all values like this (opens Conditional Filter set to remove)
- Keep all values like this (opens Conditional Filter set to keep)
For all columns:
- Add to dashboard… (when you can create or edit dashboards in the project)
- Copy values to clipboard—copies the selected values with their counts, or every value if none is selected, as tab-separated text. Ctrl+C does the same when values are selected
- Export list as CSV
- Export Image as PNG (chart views only)
When to use click
Data quality investigation:
Select suspicious values to open Bulk Replace without filtering the data first.
Transformation planning:
Select values and check the row count in the selection bar before deciding whether to filter.
Double-click: instant filtering
Double-clicking a value immediately filters your data and updates the cards that follow it. Use it for rapid data investigation.
What happens on double-click
- The filter is applied with no confirmation step
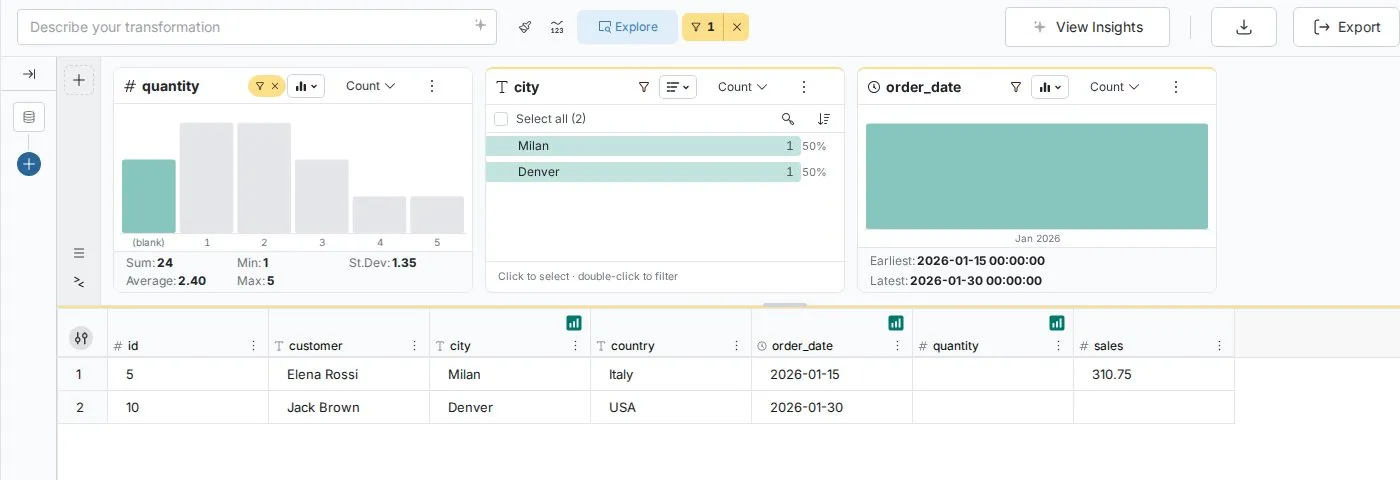
- The card shows a Filtered chip (or Excluding, if you used Exclude), and the filter badge beside the Explore toggle updates
- The data grid updates to show only matching records
- The cards to the right recalculate based on the filtered data
In chart views, double-clicking a bar also drills into it. A Drill path appears so you can step back to All.
Progressive discovery in action
This example shows progressive discovery in practice.
Example: Manufacturing quality investigation
Step 1: Double-click "Fabrication Line Beta" in the line_name Explore Card
- The line_name card shows a Filtered chip
- The data grid shows only Beta line records (2,847 rows → 892 rows)
Step 2: Observe how other cards update:
- shift Explore Card now shows: Day (60%), Evening (25%), Night (15%)
Discovery: Beta line runs more day shifts - defect_severity Explore Card shows: Critical (35%), Major (45%), Minor (20%)
Discovery: Beta line has unusually high critical defect rate - date Explore Card shows: Spike during weeks of March 15-22
Discovery: Beta line issues concentrated in specific period
Step 3: Add a second filter—double-click "Critical" in defect_severity
- Now filtering on both line_name and defect_severity
- Cards update again showing patterns within BOTH filters
- operator_name Explore Card reveals: 3 operators account for 80% of critical defects
Insight discovered: Specific operators on specific line need training—all discovered through clicks.
This is progressive discovery: each filter reveals deeper patterns in your remaining data.
Managing explore filters
The filter badge beside the Explore toggle shows how many explore filters are on, counting Search, Ask, and Compare cards too. It is visible whether or not the panel is open. The × beside it clears all explore filters in one click.
Reading the filters
Click the badge to open the list of filters. Each row shows the column and what it is filtered or excluded to, in plain words, such as region and West.
Filter logic
Several cards = AND logic: all conditions must be true
- Filtering
regionto West andproduct_typeto Electronics andstatusto Active shows only records matching ALL criteria
Several values in one card = OR logic: any selected value matches
- Selecting "Active" and "Pending" in status and clicking Filter shows records with EITHER status value
Order matters
Cards filter the cards to their right. When you change or clear a filter on a card, filters on the cards after it are cleared, because those cards were showing values from the earlier selection. A card with a filter moves toward the front of the row. If a card is showing a subset because of a filter on an earlier card, its header shows a filter icon.
Removing filters
Remove one filter: Use Clear this card's filter (the close button in the badge list, or on the card's Filtered chip)
Remove all filters: Click Clear filters in the badge list, or the × beside the badge
Cross-card investigation patterns
Pattern 1: Category → numeric analysis
Workflow: Filter by category, then examine numeric distributions within that segment
Example:
- Double-click "Enterprise" in customer_tier
- The revenue Explore Card, placed after it, shows the Enterprise customer revenue distribution
- Discover: 80% of Enterprise revenue comes from 20% of customers
Pattern 2: Time → category analysis
Workflow: Filter by time period, then view categorical breakdowns
Example:
- Double-click "Q4 2024" in date Explore Card
- The product_category card shows Q4 category performance
- Discover: Holiday products drove 60% of Q4 sales
Pattern 3: Outlier investigation
Workflow: Filter by extreme values, then examine context
Example:
- Double-click the highest bar in the amount Explore Card (transactions over $10,000)
- The customer_name card shows which customers have high-value transactions
- The region card shows geographic concentration of large transactions
- Discover: West Coast enterprise customers drive high-value transactions
Pattern 4: Multi-dimensional drill-down
Workflow: Progressive refinement through multiple filters
Example: Sales performance investigation:
- Filter to "West" region (3,200 records)
- Add "Electronics" product filter (1,850 records)
- Add "Q4 2024" time filter (420 records)
- Result: West Coast Electronics sales in Q4—specific, actionable segment
Each filter reveals patterns that only exist within that combination—insights impossible to spot without progressive discovery.
Filter-to-pipeline conversion
You can convert your explore filters into a pipeline task or a new View, so the filtering logic is saved.
The exploration-to-automation workflow
Step 1: Explore with filters (temporary investigation)
- Double-click values or use Filter to filter
- Test different filter combinations
- Validate business logic through interaction
- Confirm this filtering produces the desired dataset
Step 2: Convert to permanent logic
When you've found useful filters, open the menu (≡) at the left of the Explore panel. Mammoth offers two options:
Option A: Create new View with filters applied
Choose Create New View with these filters applied. Mammoth shows a name box (the default name is "Filtered View"); click Submit.
What happens:
- Another View is created within the same Dataset, named as you entered
- Your current filters are applied to that new View
- The original View remains unchanged
- The new View opens
When to choose:
- You want to create a permanent filtered dataset
- Multiple team members need this specific segment
- Filters define a regular business segment (e.g., "Enterprise Customers West Coast")
Option B: Convert filters into a pipeline task
Choose Convert these filters into a Task in the Pipeline.
What happens:
- The Functions panel opens with a Conditional Filter pre-filled from your filters
- Review it, then apply it to add the task to the current View's pipeline
- The task runs as part of the pipeline from then on
When to choose:
- You want to modify the current View permanently
- Filters represent data quality rules
- You're building a complete transformation pipeline
Start with explore filters for exploration, then convert successful discoveries into a pipeline task.
Common investigation workflows
Workflow 1: Data quality investigation
Goal: Identify and standardize inconsistent values
- Scan text Explore Cards for values that look like variations
- Click suspicious values → examine the More options menu
- Double-click to filter → see all records with this value
- Determine: Valid variation or standardization needed?
- Action: Apply Bulk Replace or Find & Replace
Example: customer_name shows "Apple Inc.", "Apple Inc", "Apple Incorporated"
→ Use Bulk Replace to standardize all to "Apple Inc."
Workflow 2: Outlier investigation
Goal: Understand extreme values in your data
- Scan the numeric Explore Card for unexpected ranges or outliers
- Double-click the outlier bar → filter to extreme values
- Cross-reference with other columns (date, category, source)
- Determine: Data error or legitimate edge case?
- Action: Conditional Filter to exclude or create special handling
Example: price shows transactions at $999,999
→ Investigation reveals test transactions that should be filtered out
Workflow 3: Temporal pattern analysis
Goal: Understand time-based trends and anomalies
- Review the date Explore Card for spikes, gaps, or unusual patterns
- Double-click an interesting period → filter to that timeframe
- Observe other cards → what drove the pattern in that period?
- Discover root cause through progressive filtering
- Action: Create a period-specific View or trend analysis
Example: March 2024 sales spike
→ Investigation reveals successful product launch driving regional performance
Workflow 4: Segment discovery
Goal: Define meaningful business segments through data
- Filter by primary attribute (region, product line, customer tier)
- View distributions within segment → look for unexpected patterns
- Add additional filters → refine segment definition
- Validate segment value through multiple dimensions
- Convert to permanent segment with filter-to-pipeline conversion
Getting started with interactions
Your first investigation
- Open any View with your data loaded
- Open the Explore panel and add a few columns with Add card
- Click a value → see the selection bar appear
- Double-click the same value → watch the cards after it update
- Try a second filter → see progressive discovery in action
- Remove filters → click Clear filters to reset
Building investigation skills
Start simple: Begin with obvious categories (region, product, status)
Look for co-occurrence: What happens when you filter Category A and Category B together?
Question assumptions: Use filters to validate what you think you know about your data
Follow curiosity: Unexpected patterns often lead to valuable insights
Explore filters vs pipeline tasks
Explore filters and pipeline tasks are both ways to filter data in Mammoth, but they serve different purposes and behave differently. The table shows the differences.
| Explore filters | Conditional Filter tasks | |
|---|---|---|
| Purpose | Exploration and investigation | Automated data processing |
| Created by | Explore Card interactions | Transform menu or filter-to-pipeline conversion |
| Visibility | Filter badge beside the Explore toggle and chips on cards | Tasks in the Pipeline panel |
| Scope | Changes what the grid and cards show while you explore | Part of the pipeline; runs on every data refresh |
| Best for | "Let me investigate this segment" | "Always exclude test data from this View" |
The intended workflow—use explore filters to investigate and validate your filtering logic interactively, then convert successful combinations into a pipeline task using the ≡ menu when you want that logic to run on every refresh.
Troubleshooting interactions
Filter doesn't apply
Problem: Double-click doesn't filter
Solutions:
- Double-click quickly—two slow clicks are read as two separate clicks, which toggle the selection on and off. Click Filter to apply the selection instead
- Double-click the value itself, not empty space around it
- Check that you have edit access to the workspace. Filtering is unavailable in view-only workspaces
- Refresh the View if the display seems unresponsive
Cards don't update
Problem: Other Explore Cards don't recalculate after filtering
Solutions:
- Cards recalculate only for cards after the one you filtered. Drag the card you want to analyze to the right of the filtered card
- Check the filter badge to confirm the filter was applied
- Try removing and re-adding the filter
Unexpected results
Problem: Filter shows different data than expected
Solutions:
- Check the filter list in the badge matches your intent
- Verify column name and value spelling
- Review data quality—might reveal actual data inconsistencies
- Select values first and check the row count in the selection bar before filtering