Quick Start Guide
This hands-on tutorial is for new Mammoth users. It walks you through the core workflow (upload, explore, transform, and export) using a small sales file, and ends with a clean, exportable dataset.
What you'll accomplish: Transform messy sales data with duplicates and inconsistent formatting into a clean dataset ready for analysis.
Prerequisites: A Mammoth account (sign up for Mammoth)
Data: A CSV file of sales orders with messy product names, mixed date formats, and duplicate rows (described in Step 1)
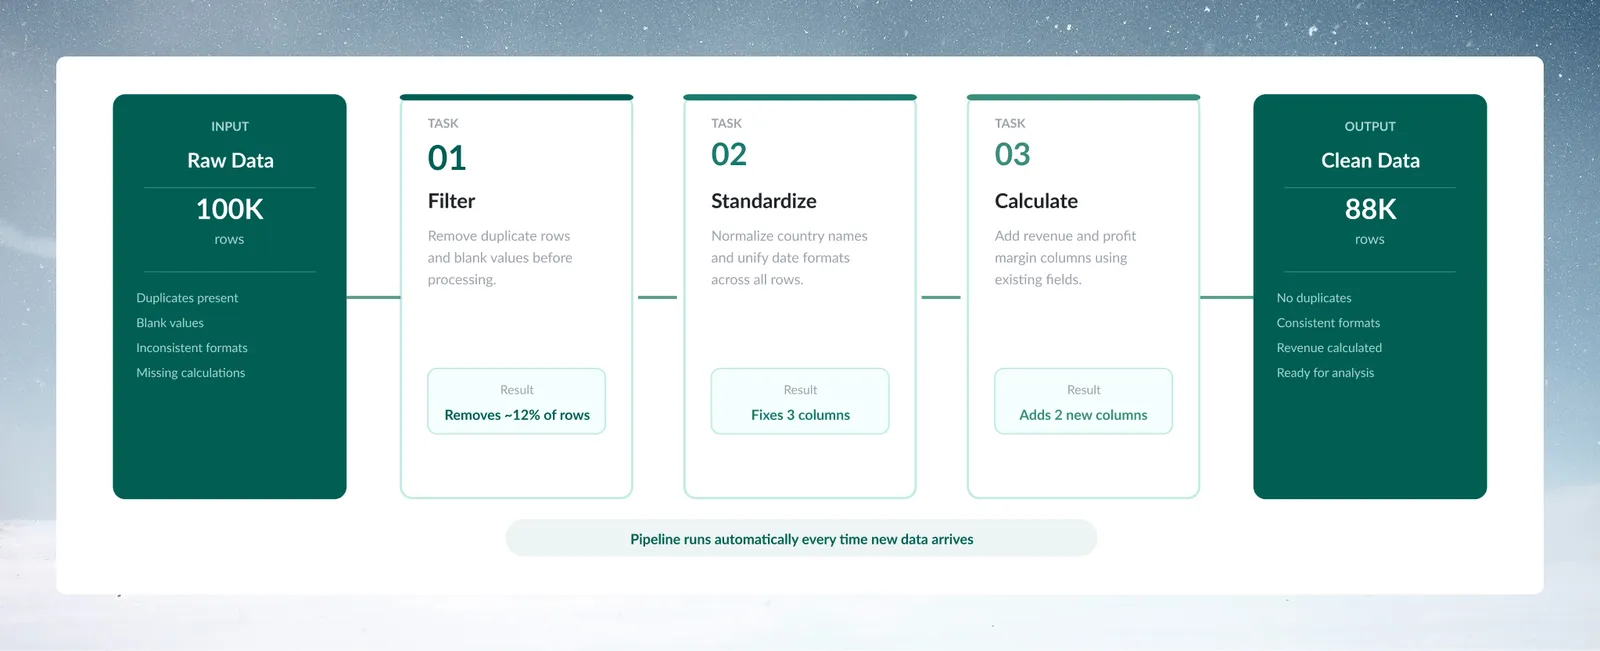
Step 1: Upload the sales CSV as a Dataset
This step gets the sales data into Mammoth.
-
Prepare a CSV file of sales orders, such as
sales_data_messy.csv, with columnsproduct_nameandorder_date:-
Product names written in several variations
-
Dates in inconsistent formats
-
Duplicate entries
-
-
In Mammoth, click Data in the left sidebar to open the Data Library.
-
Click the New Dataset button at the top right of the Data Library.
-
In the New Dataset dialog, choose Upload
-
Drag your file into the drop zone and click Submit
What just happened: Mammoth imported your CSV and created a Dataset (a standardized data container). The data is now stored in your Project. Open the new dataset from the Data Library list to see it in a View. A View is your interactive workspace for exploring and transforming data.
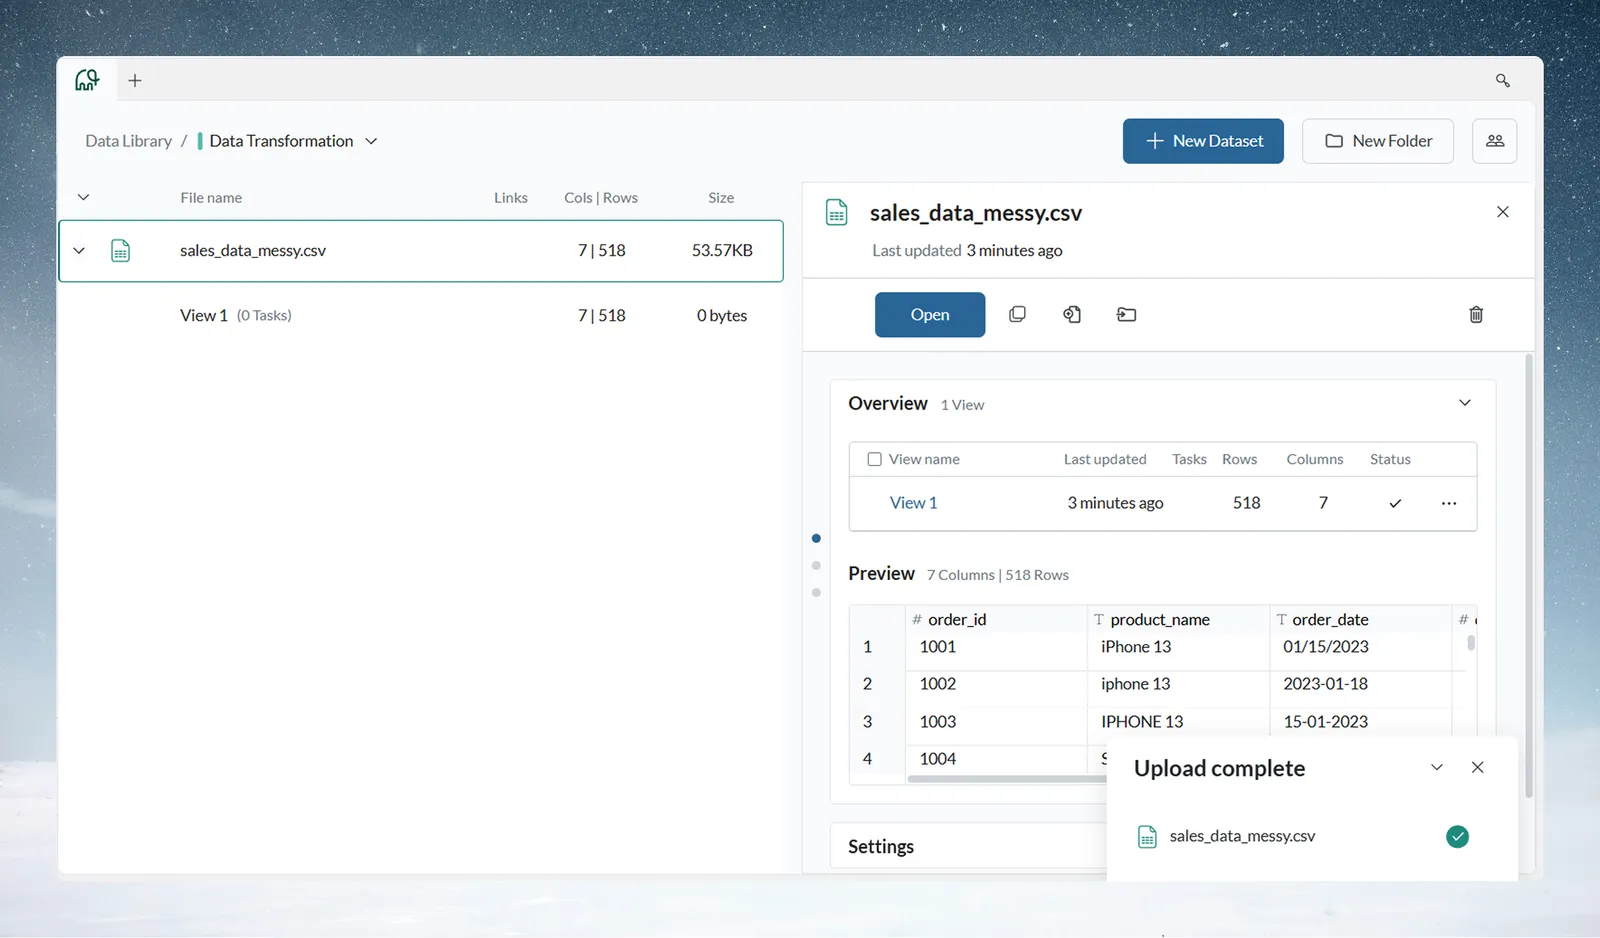
Step 2: Explore the sales data with Explore Cards
Before transforming data, check its quality and patterns. Explore Cards profile each column automatically.
Profile the sales columns with Explore Cards
When your View opens, Explore Cards appear above the data grid. They are automatic visualizations showing the distribution of values in each column.
-
Click on the product_name column's Explore Card
- See the bar chart showing value distribution
- Notice inconsistencies: "iPhone 13", "iphone 13", "IPHONE 13" all appear separately
- This reveals a standardization opportunity
-
Click on the order_date column's Explore Card
- See the date distribution histogram
- Notice format variations that need cleaning
-
Open Data Quality in the footer below the data grid (when it is enabled for your workspace)
- Shows the quality score, column completeness, critical issues, and recommendations
- Click View Details for the full analysis
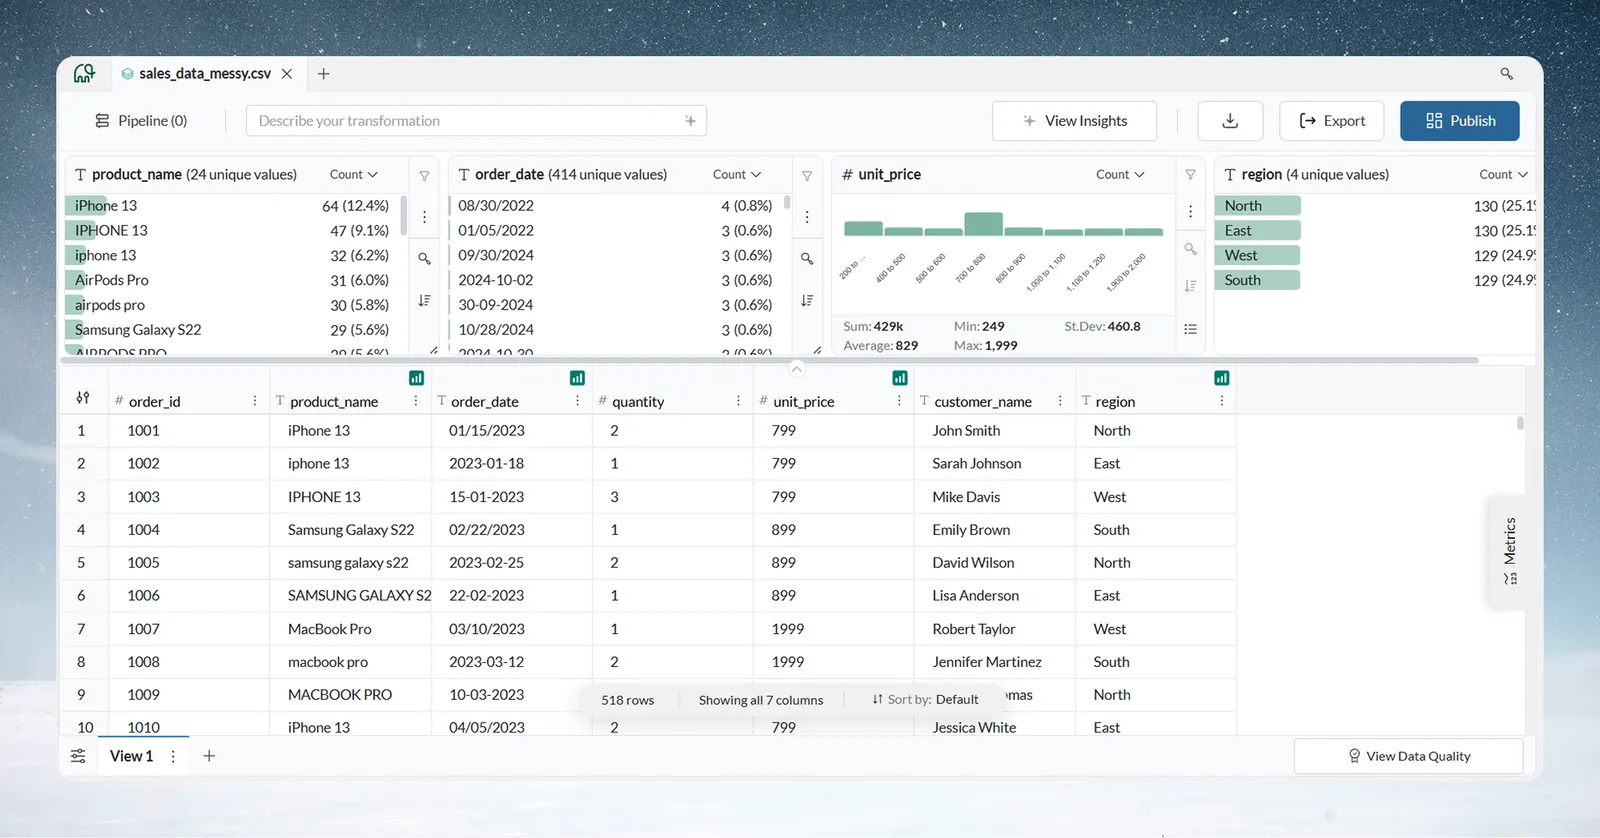
What just happened: Explore Cards automatically profiled every column, so you can spot quality issues without manual analysis.
Double-click any value in an Explore Card to filter your data to just those rows. This creates a filter "pill" that you can remove at any time or convert into a permanent pipeline task.
Data quality issues in the sales file
The sample data contains common real-world issues:
- Product names: Multiple variations ("iPhone 13", "iphone 13", "IPHONE 13")
- Duplicate records: Same order appearing multiple times
- Date filtering needs: Mix of old and recent orders
Step 3 fixes these problems.
Step 3: Clean the sales data with three tasks
This step cleans and standardizes the data using visual transformations. Each transformation creates a Task in your Pipeline, which can be applied to future data.
A. Standardize product names
-
Click the three-dot menu (⋮) on the product_name column header
-
Select Bulk Replace from the menu
-
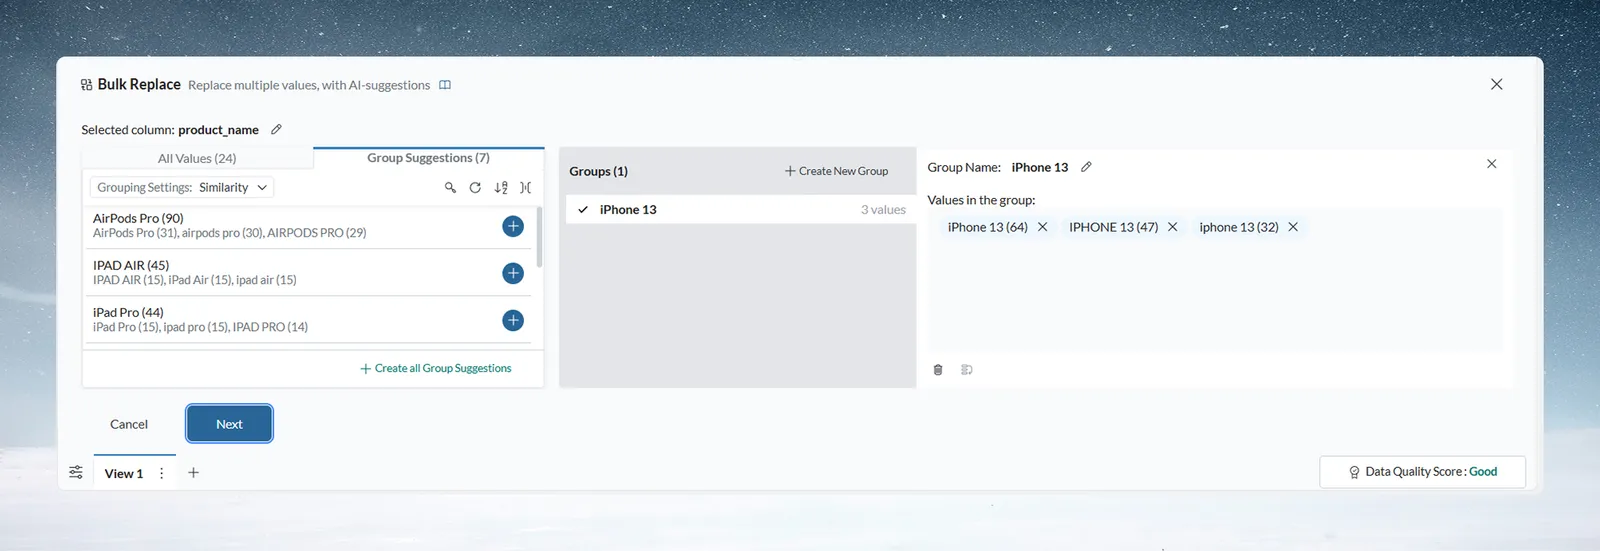
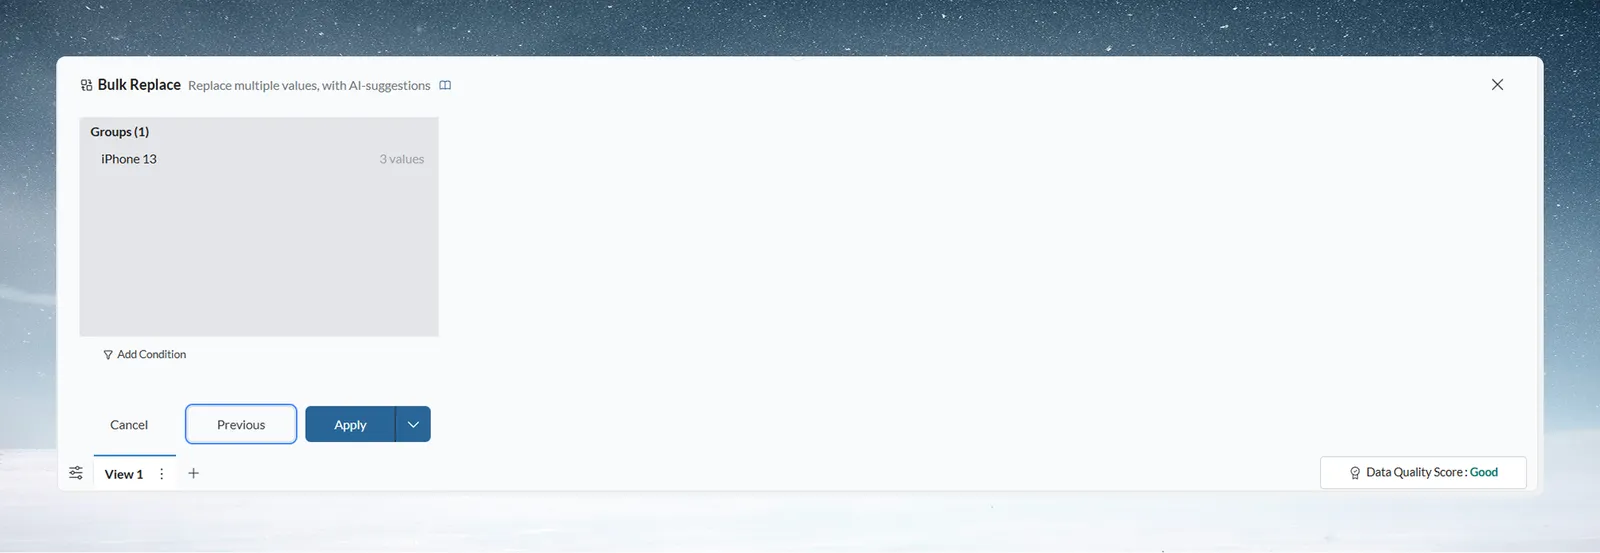
Mammoth analyzes the column and suggests groupings of similar values:
- "iPhone 13", "iphone 13", "IPHONE 13" → "iPhone 13"
- Similar patterns for other products
-
Review the suggestions and click Apply
-
Notice the Pipeline panel on the left now shows "Task 1: Bulk Replace"
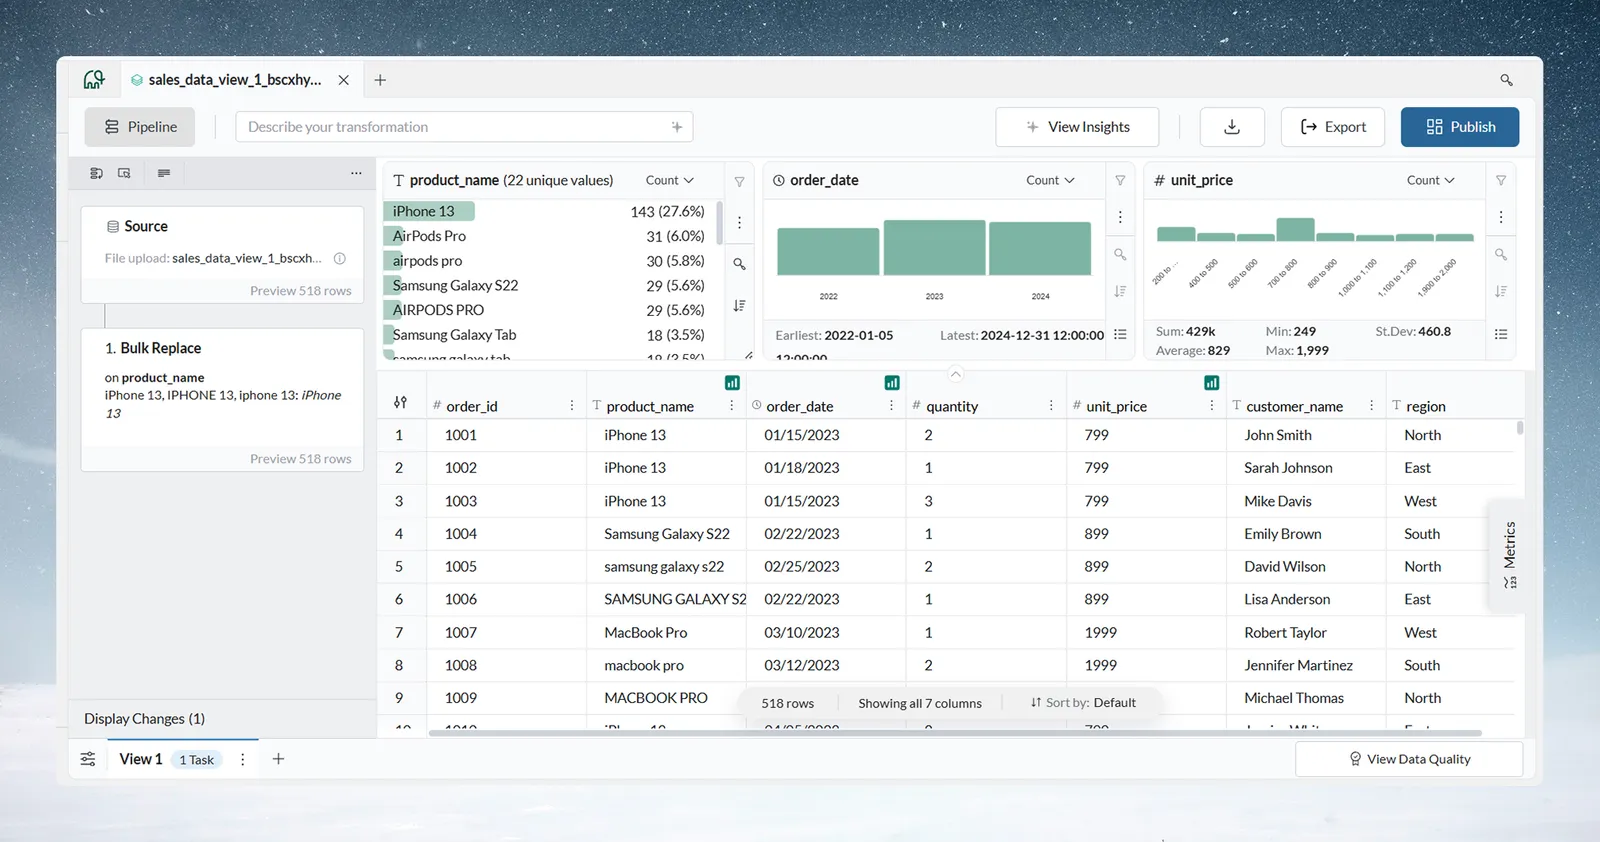
What just happened: You fixed inconsistent product names. The Bulk Replace function identified similar values and grouped them. This same logic now applies automatically to any new data you add to this Dataset.
B. Remove duplicate rows
-
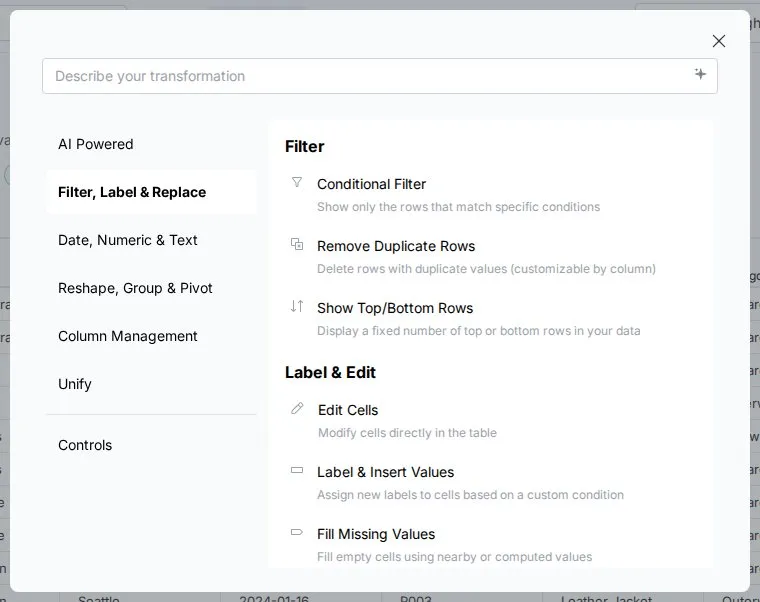
Click the + button (tooltip Add a task)
-
In the task picker, open Filter Label & Replace and select Remove Duplicate Rows
-
Under Evaluate duplicates from, choose which columns to compare (leave the default to compare all columns)
-
Click Apply
-
Notice the Pipeline shows "Task 2: Remove Duplicate Rows" and the row count decreased
Tasks execute from top to bottom in your Pipeline. You can drag tasks to reorder them, and Mammoth will re-execute the entire pipeline in the new sequence.
C. Filter to recent orders
-
Click + → Filter Label & Replace → Conditional Filter
-
Configure the filter:
- Select column: order_date
- Choose condition: is later than
- Set date: 2023-01-01
-
Click Apply
-
The Pipeline now shows "Task 3: Conditional Filter"
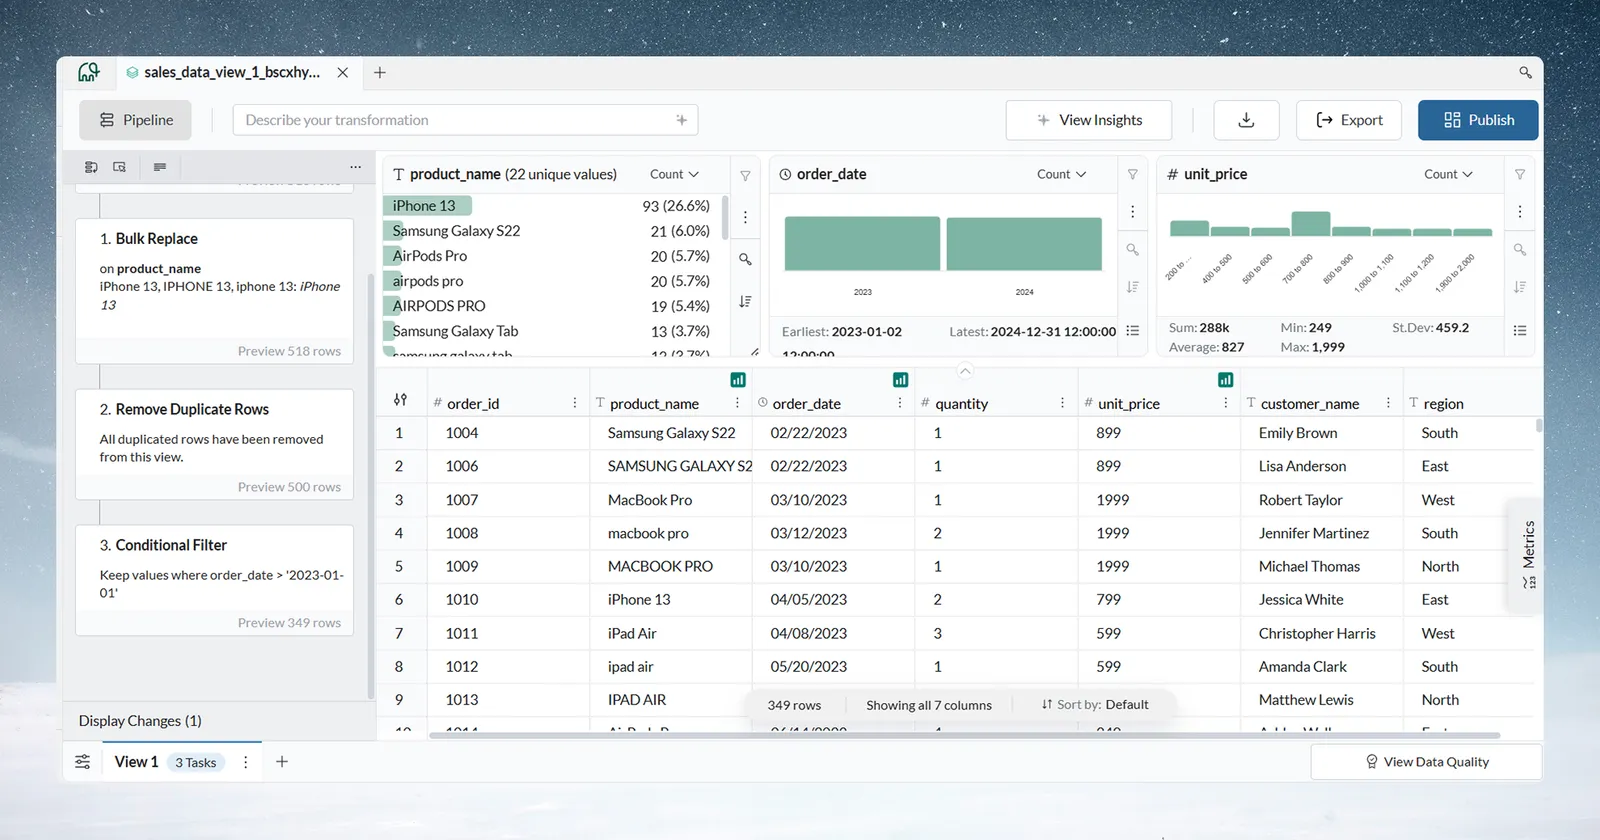
What just happened: You built a three-task transformation pipeline without writing any code. Each task executes in sequence, and you can see the results immediately. The pipeline is saved, so when new data arrives, these same transformations apply automatically.
Step 4: Review the three-task pipeline
This step shows how to check each task in the pipeline.
Inspect each task's transformation logic
-
Look at the Pipeline panel on the left sidebar
-
Click on any Task to see its configuration:
- Shows exactly what parameters you set
- Displays the logic applied to your data
-
Click Preview on each task to see before/after data:
- View data state at any point in the pipeline
- Understand how each transformation affects your results
-
Notice the complete audit trail:
- Every change is listed as a Task
- Team members can see and understand your logic
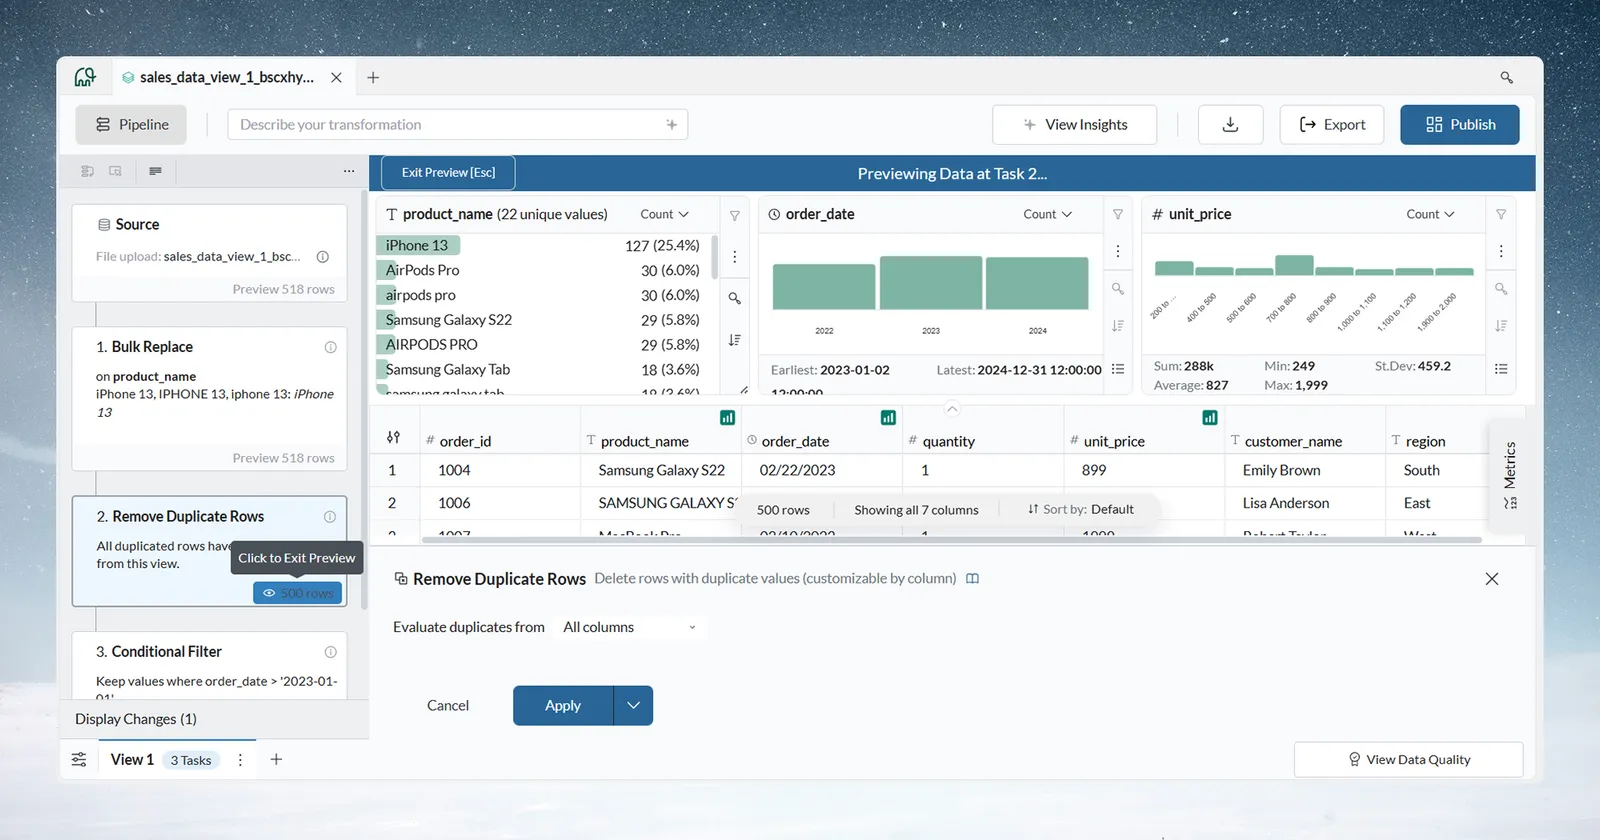
What just happened: Your manual work is now a repeatable pipeline. When new sales data arrives, these same transformations execute automatically.
You can go back to any pipeline task and see the data state at that point, which helps when you need to trace how a result was produced.
What the three-task pipeline demonstrates
This pipeline shows three properties of Mammoth pipelines:
Automation: Future data batches can run through the same tasks
Auditability: Every transformation is listed in the Pipeline
Reusability: This pipeline can be copied and adapted for similar datasets
Step 5: Export the cleaned data as CSV
This step downloads the cleaned data.
-
Click the download icon in the top toolbar to open the Save file as menu
-
Choose your export format:
- CSV: Most common, works everywhere
- XLSX: An Excel workbook
- Mammoth Dataset: Save your data to a new dataset
-
For this tutorial, select CSV
-
Click Confirm
-
Open the file—notice clean, standardized data:
- Product names consistent
- Duplicates removed
- Only recent orders included
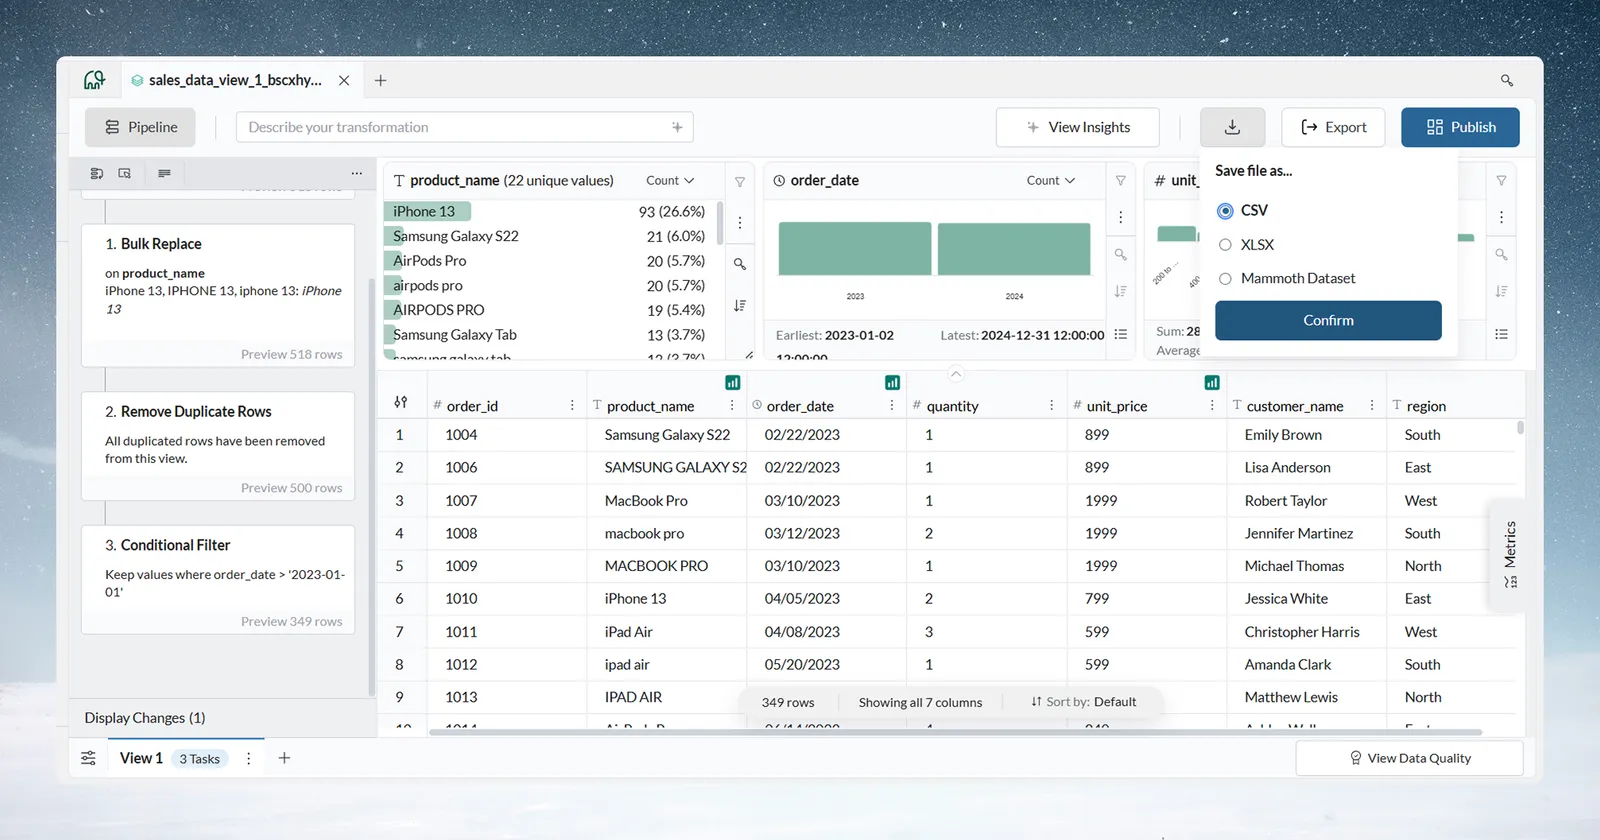
What just happened: You transformed messy data into clean output. The pipeline you created is saved and reusable.
Alternative next steps
Instead of downloading, you could:
- Schedule automatic execution so fresh data processes every night
- Create a dashboard using the AI-powered dashboard creator
Summary of the quick start workflow
You have now run the complete Mammoth workflow:
- Upload: Drag-and-drop or file selection gets data into Mammoth
- Explore: Explore Cards profile each column without manual work
- Transform: Point-and-click functions, with no code or formulas
- Reuse: A pipeline applies to new data automatically
- Export: Multiple formats and destinations are available
The pipeline gives you reusable preparation, fewer manual errors, a visible audit trail of every task, and self-service without IT dependencies.
Next steps
Choose a learning path based on your role:
For business analysts
Recommended path: Getting started as a data analyst
Focus on:
- Automating monthly reporting workflows
- Building executive dashboards
- Integrating with Excel and PowerBI
- Scheduling pipelines for automatic execution
For technical users
Recommended path: Getting started as a technical user
Focus on:
- Advanced transformation functions
- SQL Query capabilities
- API integration and automation
- Team enablement and template creation
Deep dive on Mammoth concepts
To understand how the platform is organized, read Core concepts.
Learn about:
- Workspace, Project, Dataset, Batch, View hierarchy
- How Pipelines and Tasks work
- Live Connections for database integration
- Data versioning and audit trails
Explore specific Mammoth features
Explore Cards: Explore Cards
Transformations: Transform data overview
Dashboards: Dashboards
Troubleshooting: Troubleshooting common issues
Try the workflow with your own data
- Upload a real file from your work
- Explore it using Explore Cards
- Build transformations for your actual business problems
- Share results with your team
Tip: Start with a small dataset (< 10,000 rows) to learn quickly, then apply those skills to larger production datasets.
Need help?
- In-app documentation: Click the 📘 book icon next to a transformation to open its related documentation and learn how that feature works.
- In-app Support: Use the Support option in the sidebar to ask questions, report issues, or share feedback.
Remember: You now have the foundation to automate your own data workflows.