The dataset panel
Click any dataset row in the Data Library and the dataset panel opens on the right side of the screen. The dataset list compresses to the left half; the panel fills the right. This page is for anyone who works with datasets. Start with the section you need: Overview, Settings, Batches, or Automations.
The panel is a single scrollable surface divided into four collapsible sections (Overview, Settings, Batches, and Automations). It gives you everything you need to understand, configure, and manage a dataset without leaving the Data Library. The raw data grid lives inside Overview, not as a separate top-level section.
Opening and closing the panel
- Open: Click any dataset row in the file list.
- Close: Click the × in the top-right corner of the panel.
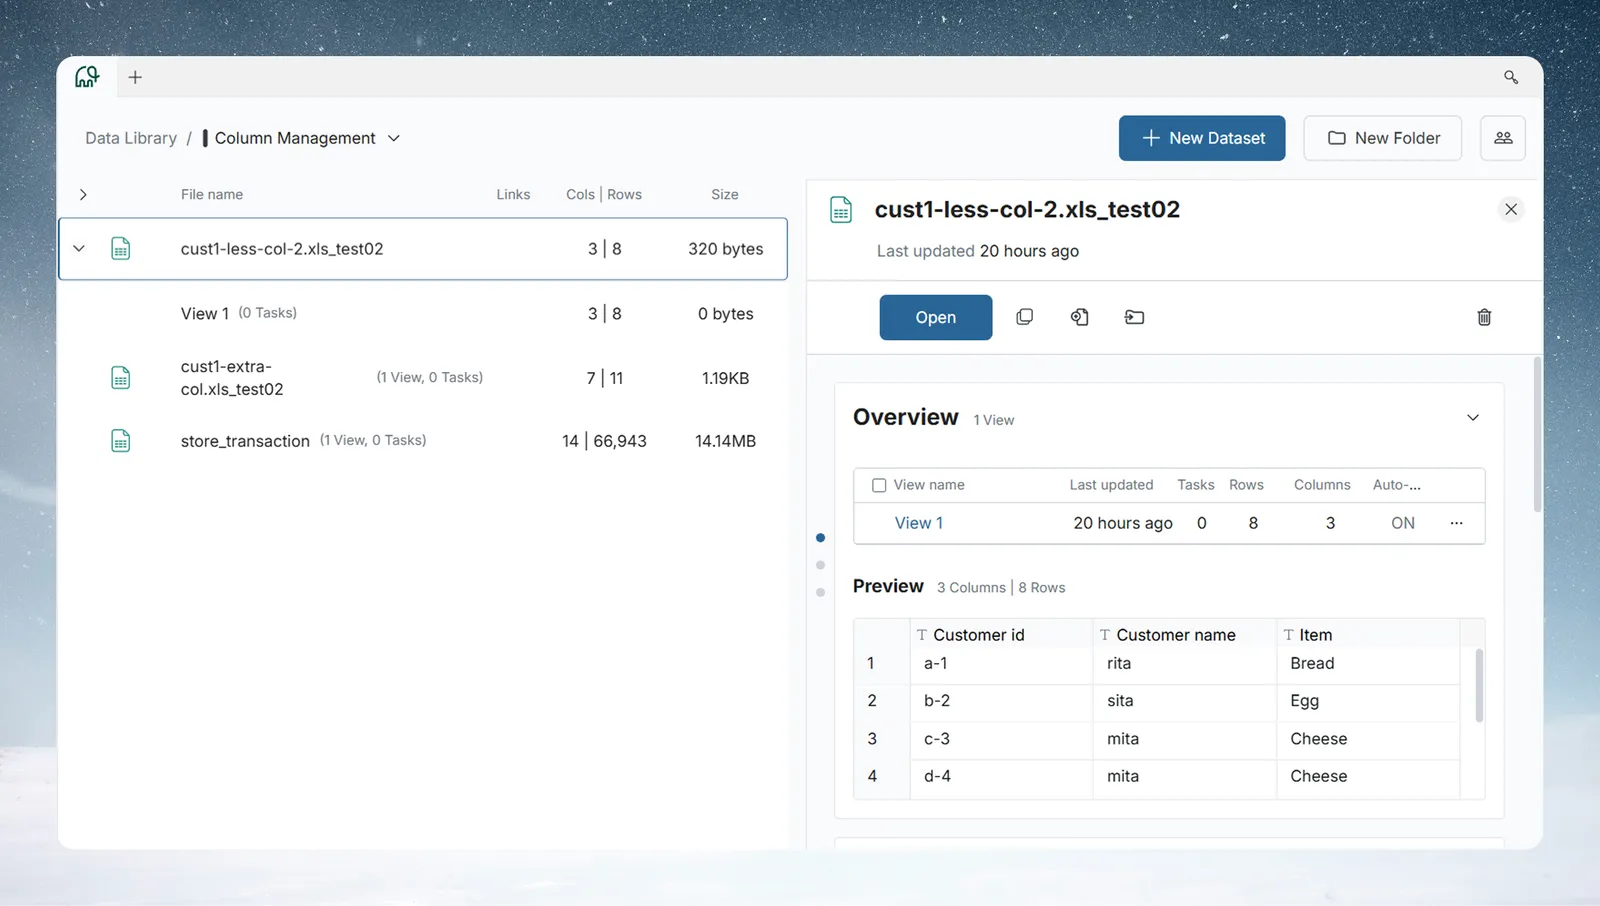
Panel header
The header is always visible regardless of how far you scroll inside the panel.
| Element | Description |
|---|---|
| File icon | Reflects the dataset's source type (spreadsheet, database, API, etc.) |
| Dataset name | Bold title: the name you gave the dataset on upload. Click the name, or the pencil (Rename) icon next to it, to rename |
| Last updated | Relative timestamp of the most recent change (hover for the full date) |
| × close button | Dismisses the panel |
Renaming a dataset
Click directly on the dataset name in the header to rename it in place. There is no separate menu or modal.
- Click the dataset name. It turns into an editable text field pre-filled with the current name.
- Type the new name (up to 300 characters).
- Press Enter, or click anywhere outside the field, to save.
If you clear the field or leave the name unchanged, the field reverts to the original name without saving. On success, a Rename successful confirmation appears; if the rename fails (for example, an authorization error), the name reverts, the field re-opens, and an error message is shown.
Note: You can't rename a dataset that needs attention (for example, a corrupted or password-protected file awaiting action). The name isn't clickable until the issue is resolved.
Action buttons
A row of buttons sits below the header. The primary Open button comes first, followed by icon buttons; hover an icon to see its name. Which buttons appear depends on the dataset's type.
| Button | What it does |
|---|---|
| Open | Opens the dataset in the data editor. It turns red when the dataset's pipeline has errored, and is disabled while the dataset is processing. |
| Refresh | Appears for webhook datasets that have pending updates |
| Clone dataset | Duplicates the dataset. See Cloning and moving datasets. |
| Add or Replace data | Starts the Add or replace data workflow. Appears only when the dataset has views and a file-related source. |
| Retrieve latest data | Pulls the newest data for a dataset from a third-party source |
| Move to | Relocates the dataset to a different folder |
| More options (⋮) | The remaining actions, such as Settings, View activity, Rename, and Automations |
| Trash (far right) | Moves the dataset to Trash. See Trashing a dataset for the confirmation flow and the 30-day recovery window. It is not an instant, permanent delete. |
Navigating the panel
A column of dots runs down the left edge of the panel—one per section (Overview, Settings, Batches, Automations). It is hidden while a dataset is processing or needs action. The active dot highlights as you scroll. Clicking a dot jumps directly to that section with a smooth scroll. Use this when a dataset has many batches and you want to reach Settings or Automations quickly without scrolling through them.
Section 1: Overview
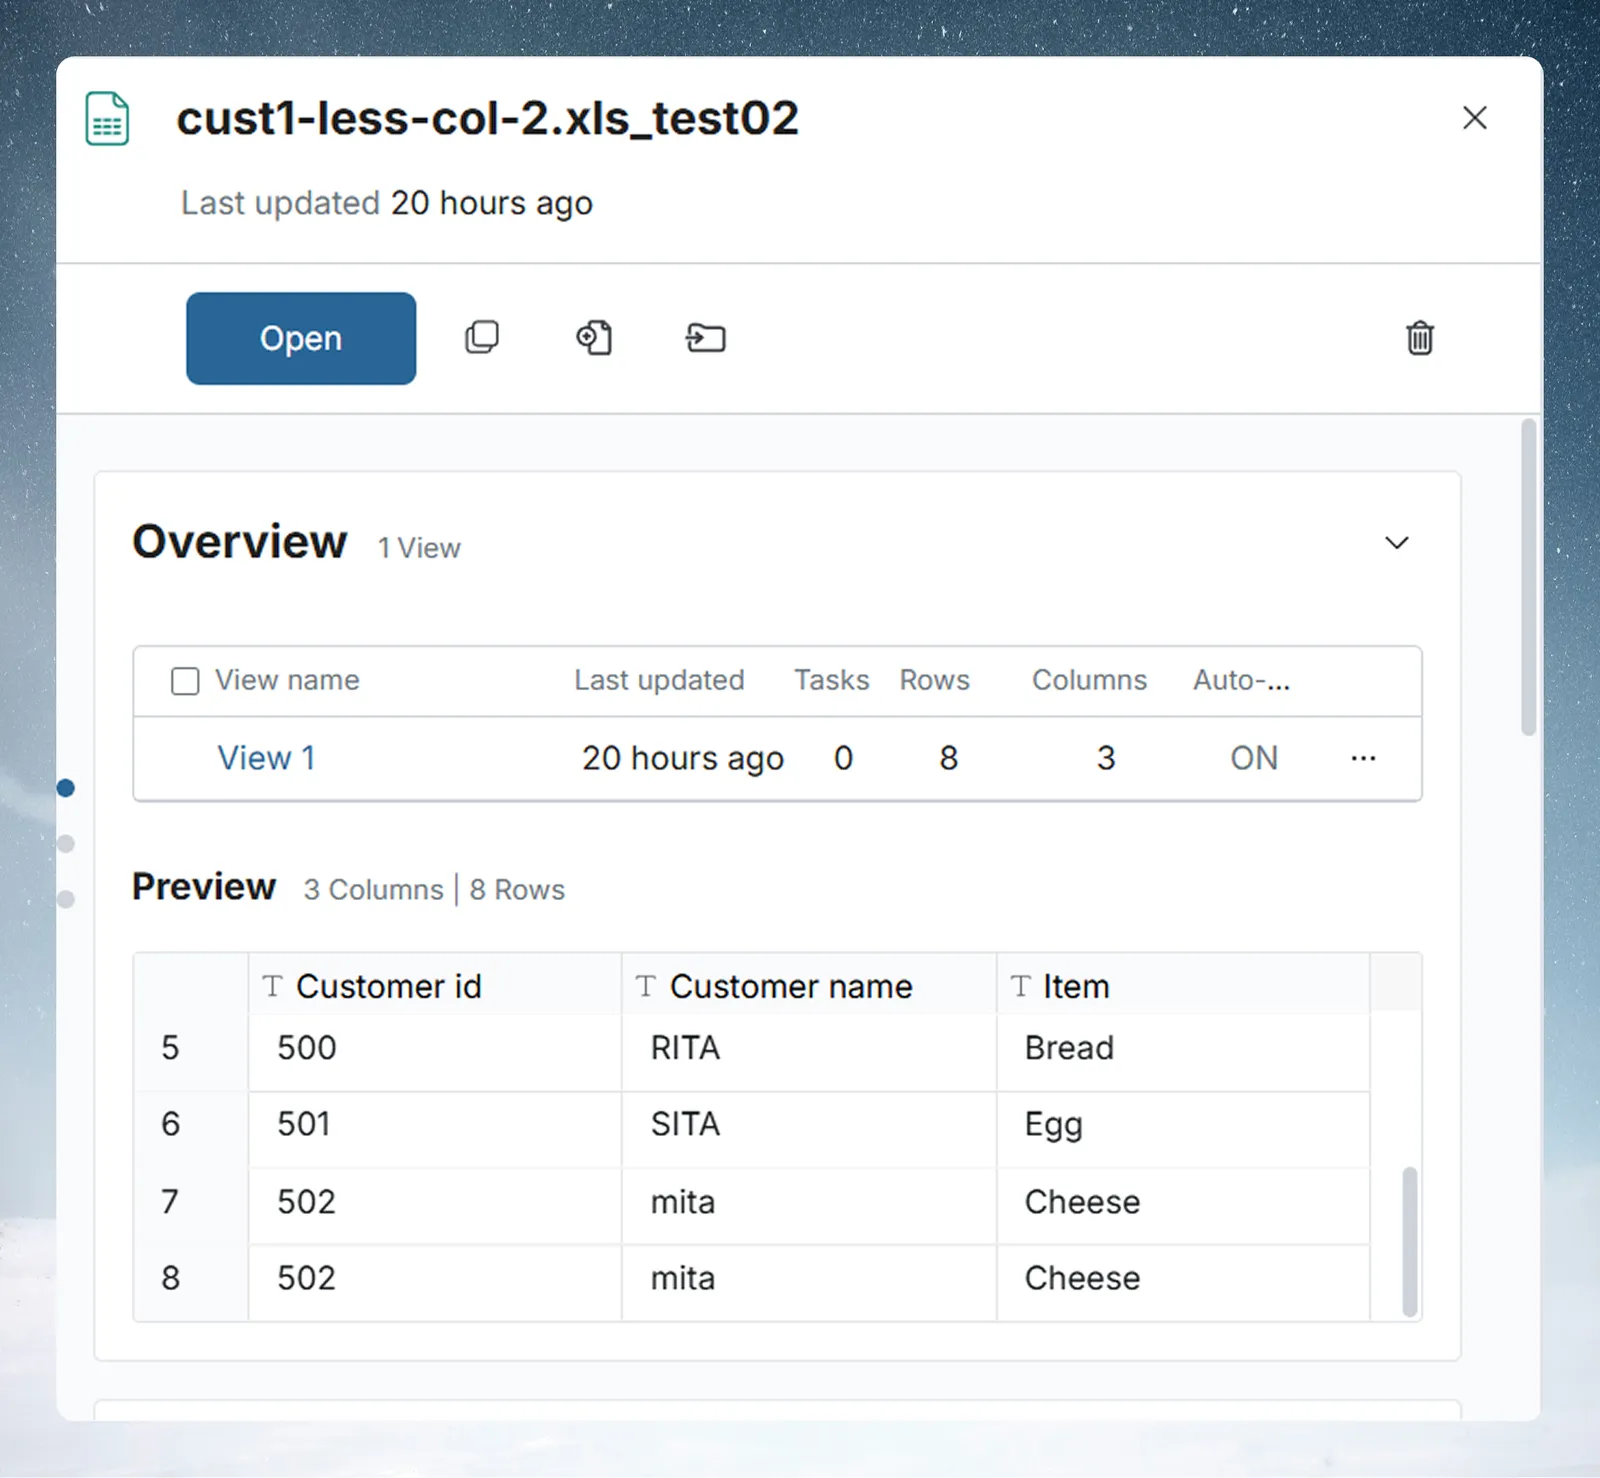
The Overview section lists every View that belongs to this dataset. The section header shows the total View count as a badge (for example, 1 View).
What is a view?
A View is the output of a transformation pipeline built on top of a dataset. Each View has its own pipeline—a sequence of tasks (filters, joins, formulas, aggregations)—applied to the dataset's source rows. You can have multiple Views per dataset, each producing a different shape of data for different purposes.
The views table
Each row represents one View:
| Column | What it shows |
|---|---|
| Checkbox | Selects the View for a bulk action |
| View name | Clickable—opens that View full-screen |
| Last updated | When the View data was last refreshed |
| Tasks | Number of transformation tasks in this View's pipeline |
| Rows | Current row count after the pipeline runs |
| Columns | Current column count |
| Auto-sync | Whether the View re-runs automatically when new data arrives |
| ⋮ menu | Per-View actions: Open, Settings, View activity, Auto-sync, Rename, Duplicate, Reset, Delete, and Automations. Apply template, Save as template, and Summary appear when enabled for your workspace. |
The Auto-sync column appears only when it is enabled for your workspace.
Select one or more Views with the checkboxes and the section header turns into a toolbar with Enable auto-sync, Disable auto-sync, and Delete selected views. Delete selected views is disabled when every View is selected.
View status indicators
Most of the time a View row shows no icon—that means it's healthy and up to date. Two indicators can appear when something needs attention:
| Indicator | Where it appears | What it means |
|---|---|---|
| Red error icon | View name column | The pipeline failed on its last run. Open the View to see which task errored. |
| Orange warning icon | Auto-sync column (next to ON/OFF) | A data update is pending for the View. The tooltip reads "Data may be inconsistent. Check Dataflow Monitor to manage Pending data updates." See Monitor. |
The Auto-sync column itself shows plain ON or OFF text. There is no icon for Auto-sync OFF; read the text.
View Auto-sync
Auto-sync ON means the View's pipeline re-runs automatically when new data arrives in the dataset.
Auto-sync OFF means new data does not trigger a pipeline run automatically. Use the per-View toggle in the ⋮ menu, or the bulk Enable auto-sync and Disable auto-sync actions.
When you select a single View, the panel header shows its name with its column, row, and task counts and a Data sync: ON/OFF indicator.
Note: Auto-sync here refers to View-level automation—whether this View's pipeline responds to new data. It is separate from the dataset-level Update Method (Combine vs. Replace) and from Export Auto-sync. Each operates independently.
The preview grid
The Preview grid, nested inside the Overview section, shows the raw source rows from your dataset. Unlike Views, the Preview reflects the original data before any pipeline transformations are applied.
The section header shows the column and row count as a persistent badge, such as 4 Columns | 4 Rows.
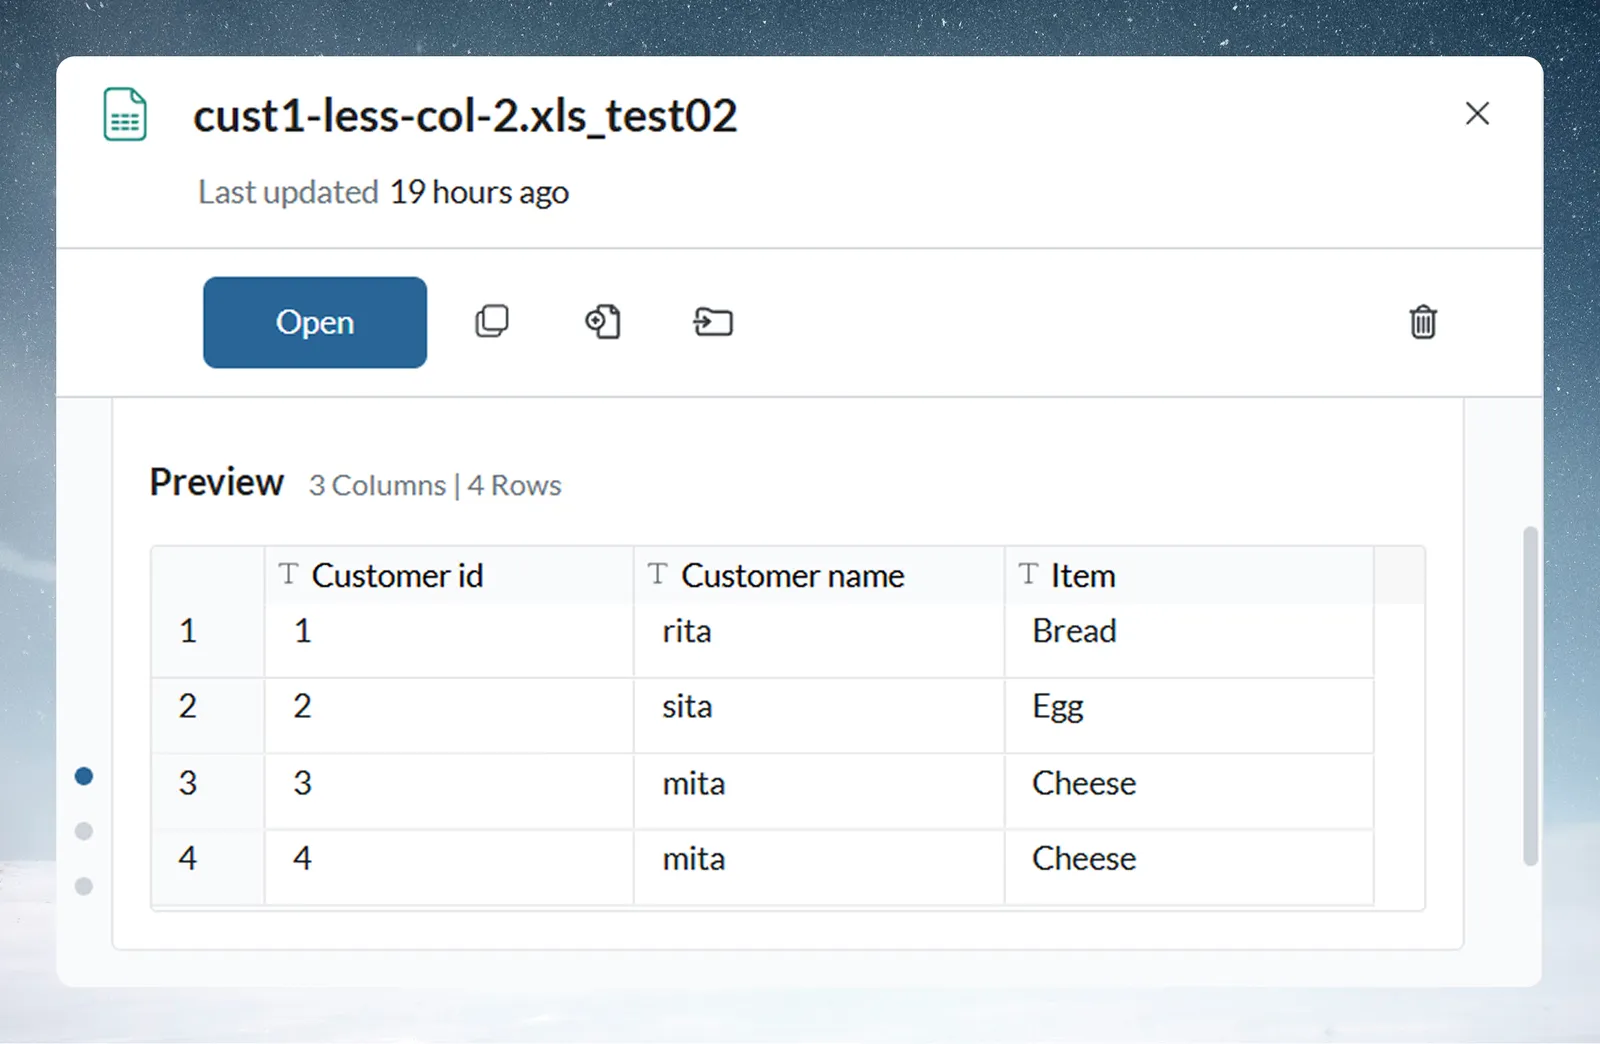
- Row numbers are shown on the far left.
- The grid has a fixed height inside the panel. To see all rows in a batch, click the batch name in the Batches section to open a full-screen preview.
Tip: If your View is returning unexpected results, check the Preview first. It shows what the pipeline is working with—if the source data looks wrong here, the issue is upstream of the pipeline.
Section 2: Settings
The Settings section controls how new data is incorporated into the dataset, what schema the dataset uses, and whether cell editing is enabled.
A Data settings button in the section header opens the Data Preview modal for the dataset. It appears only for file-based datasets that can be reprocessed. The modal covers the delimiter and quote character, column headers (initial rows to skip, which row holds the column names), the date format for each date column, and a review of rows that require attention (Discard all / Restore all).
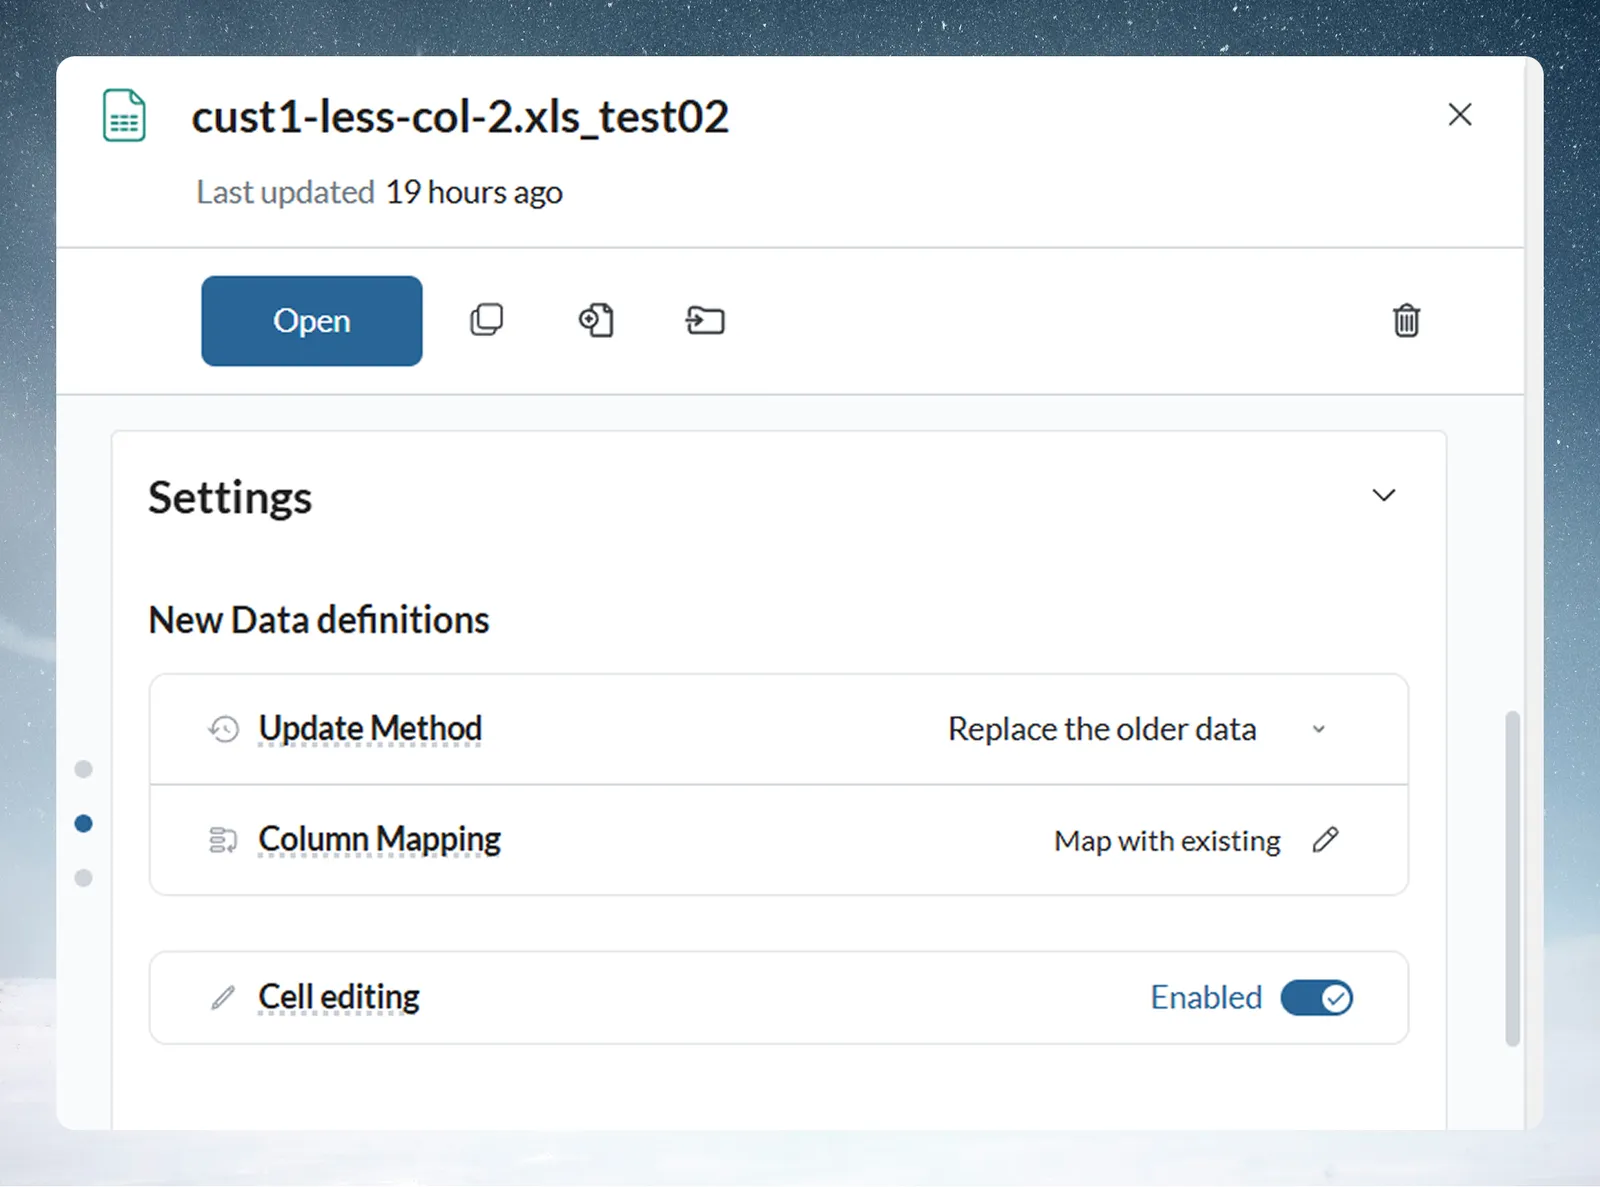
New data definitions
These settings control what happens when you add new data to the dataset via Add or Replace Data. They appear for file-based and third-party datasets. For third-party datasets the card sits under a Retrieve latest data button, which asks for confirmation and then refreshes the dataset.
Change Update Method directly from the dropdown in the panel; it saves immediately. The Column Mapping row shows Map with existing or Create new, and its pencil icon opens the full settings dialog. The Column Mapping row is hidden for third-party datasets.
Update method
| Option | What it does | Best for |
|---|---|---|
| Combine with older data (default) | New data is appended as a new batch. All previous batches are preserved. | Incremental loads—daily sales, event logs, transaction feeds |
| Replace the older data | New data replaces the existing batch. Previous data is deleted. | Full snapshots—weekly inventory exports, complete dimension refreshes |
Column mapping
| Option | When to use it |
|---|---|
| Map with existing columns (default) | Your new file has the same column names as the original upload. Mammoth matches them automatically, so no action is needed. |
| Create new column mapping | The source file's column names have changed completely and you want Mammoth to treat the new structure as the definitive schema, discarding the old one. |
Changing how new data is combined or mapped
You may want to change these settings before uploading a new batch—for example, switching from "Combine" to "Replace" for a periodic full refresh, or adjusting what happens when the incoming file has a column in a different format.
Prerequisite: You have Edit-level access to the dataset.
To change the column mapping or the type-mismatch behavior, click the pencil icon in the Column Mapping row. This opens the Combine / Replace Settings dialog.
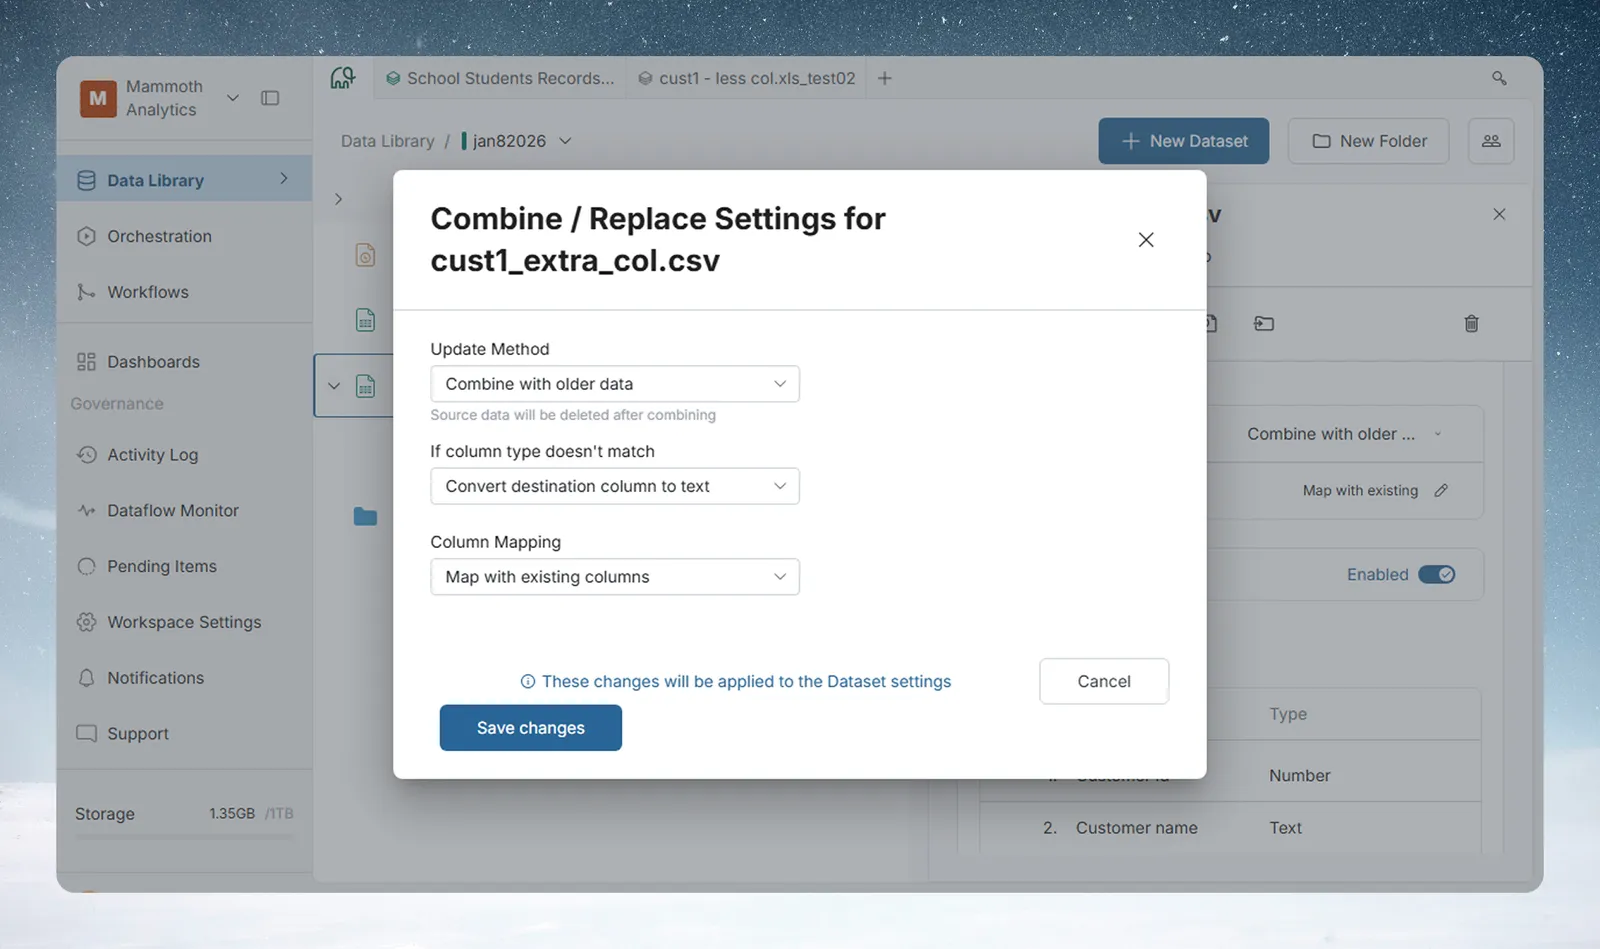
Update Method controls what happens to your existing data when you load new data:
- Combine with older data: new data is added as an additional batch alongside the existing one. Use this when you're adding new records over time (for example, monthly sales files).
- Replace the older data: new data completely overwrites the existing batch. Use this when each upload is a full, current snapshot (for example, a weekly inventory export that supersedes the previous one).
If column type doesn't match controls what Mammoth does if the incoming file has a column in a different data type than the schema expects:
- Convert destination column to text: Mammoth changes the schema column to Text to accept all values without data loss.
- Convert incompatible values to null: the column type stays as-is; any incoming values that don't fit are stored as null.
- Do not update the dataset: the load is cancelled entirely if any type conflict is detected. Use this when type-correctness is critical and you'd rather fail loudly than load dirty data.
Column Mapping controls how incoming columns are matched to the schema:
- Map with existing columns: Mammoth matches columns by name. The schema stays unchanged.
- Create new column mapping: Mammoth rebuilds the schema from the incoming file. Use this when the source has been restructured. A mapping list appears where you can set the incoming names (aliases) that feed each destination column, switch individual columns on or off, and tick All destination columns must be mapped so new data is added only when the column count matches.
Changes made here apply to the dataset's settings going forward. Click Save changes to apply them before your next upload.
Expected result: The Settings section shows the new values.
Cell editing
The Cell editing row shows Enabled or Disabled. Switching it opens an Enable Cell Editing or Disable Cell Editing confirmation. When it is enabled, users can click any cell in a View built on this dataset and edit the value inline.
Note: Cell editing is a dataset-level setting. When enabled, it applies to all Views built on this dataset.
Before you enable it: turning Cell editing on re-runs every pipeline on the dataset, and it's recommended only for datasets under roughly 500,000 rows. Once a cell has been edited, you can't disable Cell editing again until all edited cells are removed.
Properties
For datasets that connect to an external source, the Settings section also lists Properties: the Connection, the Query (editable), the Datapull type for SFTP sources, and, for webhook datasets, the Webhook URL, an API key, and a Secure header toggle.
Dataset recipe
A dataset created from messy data or a PDF interpretation shows a Dataset recipe block. It holds a summary of the recipe, an edit pencil (disabled when the recipe isn't editable), and, where relevant, how many other datasets were created together with this one and a View recipe link.
Schema
The Schema sub-section lists every column in the dataset. The header shows the column count (for example, 6 columns). The list is read-only; click the pencil icon next to the Schema header to open the Column Manager, where you rename, retype, reorder, add, and remove columns.
The Schema sub-section appears only for file-related sources, and only when it is enabled for your workspace.
Editing the schema in the Column Manager
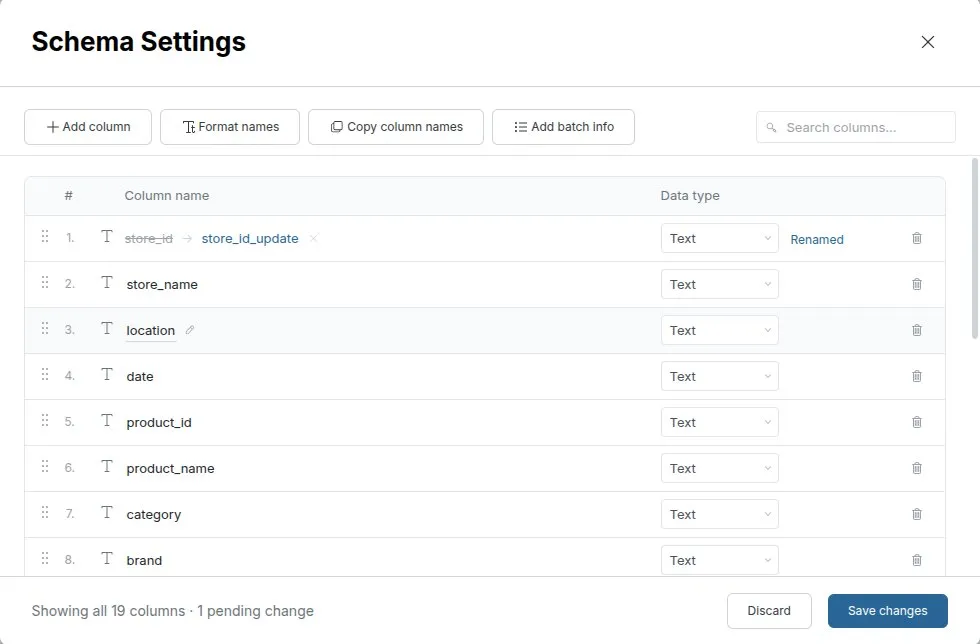
The Column Manager (titled Schema Settings) shows every column as a row, with a toolbar above it:
- Add column: introduce a new column.
- Format names: standardize names in bulk (see below).
- Copy column names: copy all names to your clipboard.
- Add batch info: add batch metadata as columns (see Add batch info to the dataset). All views of this dataset are affected.
- Search columns: filter the list by name.
On each row you can:
- Rename a column: edit its name. Empty or duplicate names block saving.
- Change a column's type: switch between Text, Number, and Date. Change this if Mammoth inferred the wrong type on upload (for example, a numeric ID that should be treated as Text). If a type change fails, a Failed to change type message lists the columns that kept their current type.
- Reorder columns: drag a row up or down.
- Remove a column: removing is reversible until you save; use Restore column to bring it back. If a column is used in tasks, a warning explains that deleting it may cause issues, and you can choose Delete anyway.
You can also select several columns at once (Select by filter, Invert selection).
Changes are staged, not applied immediately. The footer shows how many pending changes you have, with Discard and Save changes buttons. Nothing changes in the dataset until you click Save changes.
Renaming columns in bulk
If your source file uses inconsistent naming—all-caps, mixed separators, abbreviated labels—use Format names to standardize them in one step rather than renaming each column individually.
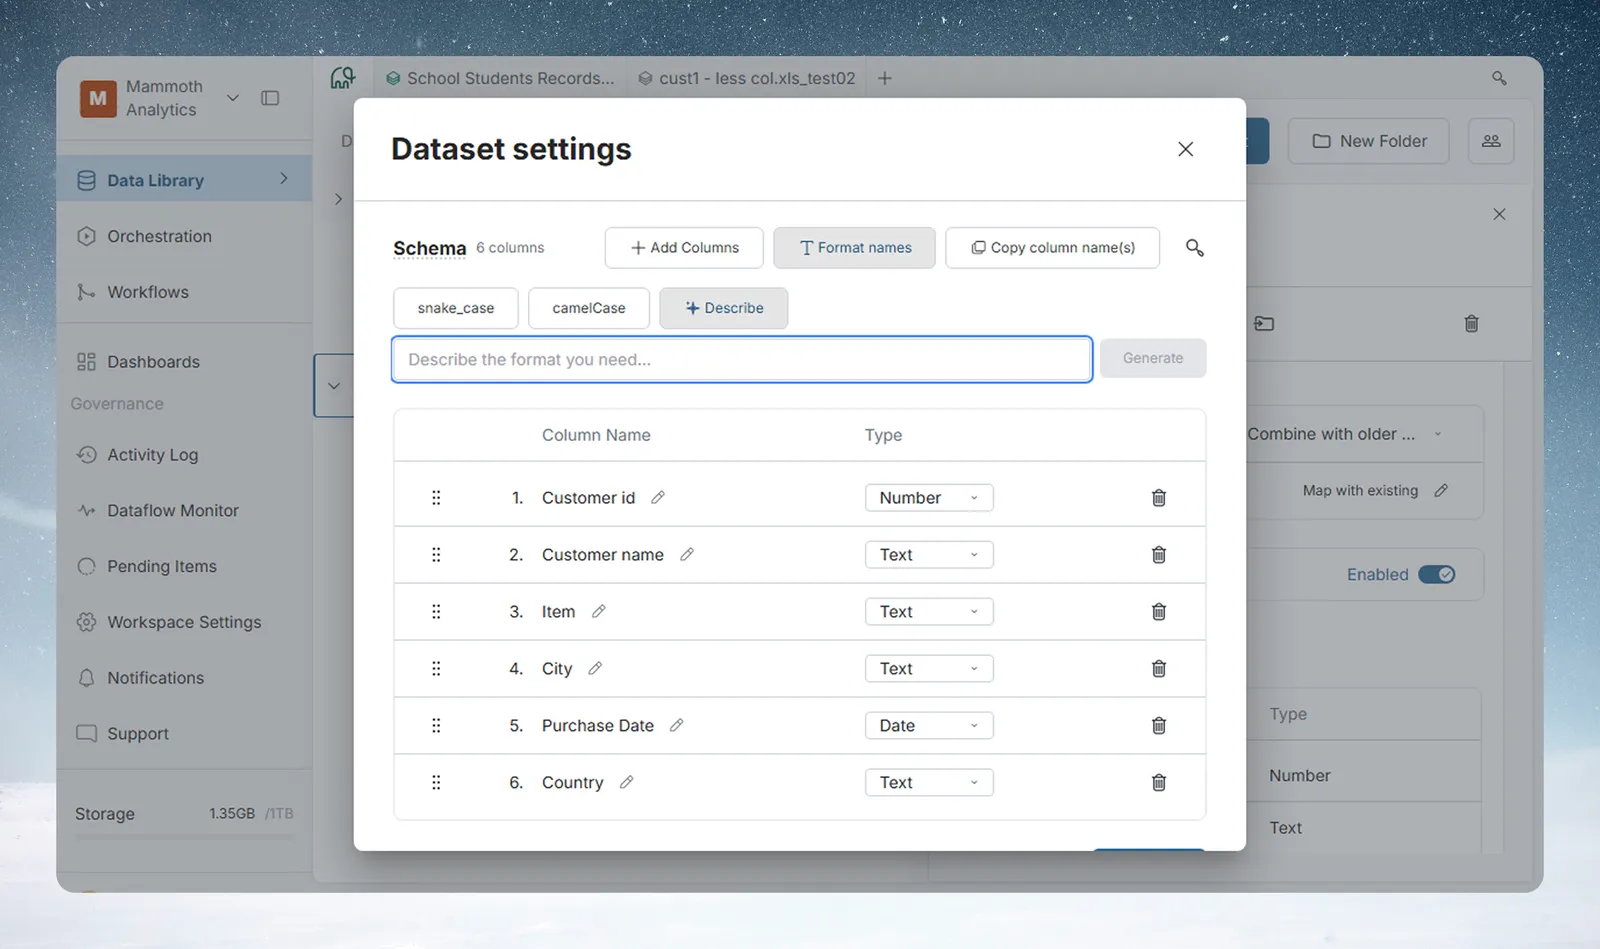
Click Format names to reveal these options:
- snake_case: converts all column names to lowercase with underscores (for example,
Purchase Date→purchase_date). Useful when downstream tools or SQL queries expect this format. - camelCase: converts all column names to camelCase (for example,
Purchase Date→purchaseDate). Common for JavaScript or API-connected workflows. - Title Case: converts all column names to Title Case.
- Describe: describe what you want in plain English in the Describe the format you need... field (for example, "Capitalize the Item column" or "Make all names lowercase and remove spaces") and click Generate. Mammoth uses AI to apply the transformation across all columns.
Tip: Use Copy column names if you need to paste the current column names into a formula, external spreadsheet, or documentation. It copies all names to your clipboard at once.
Section 3: Batches
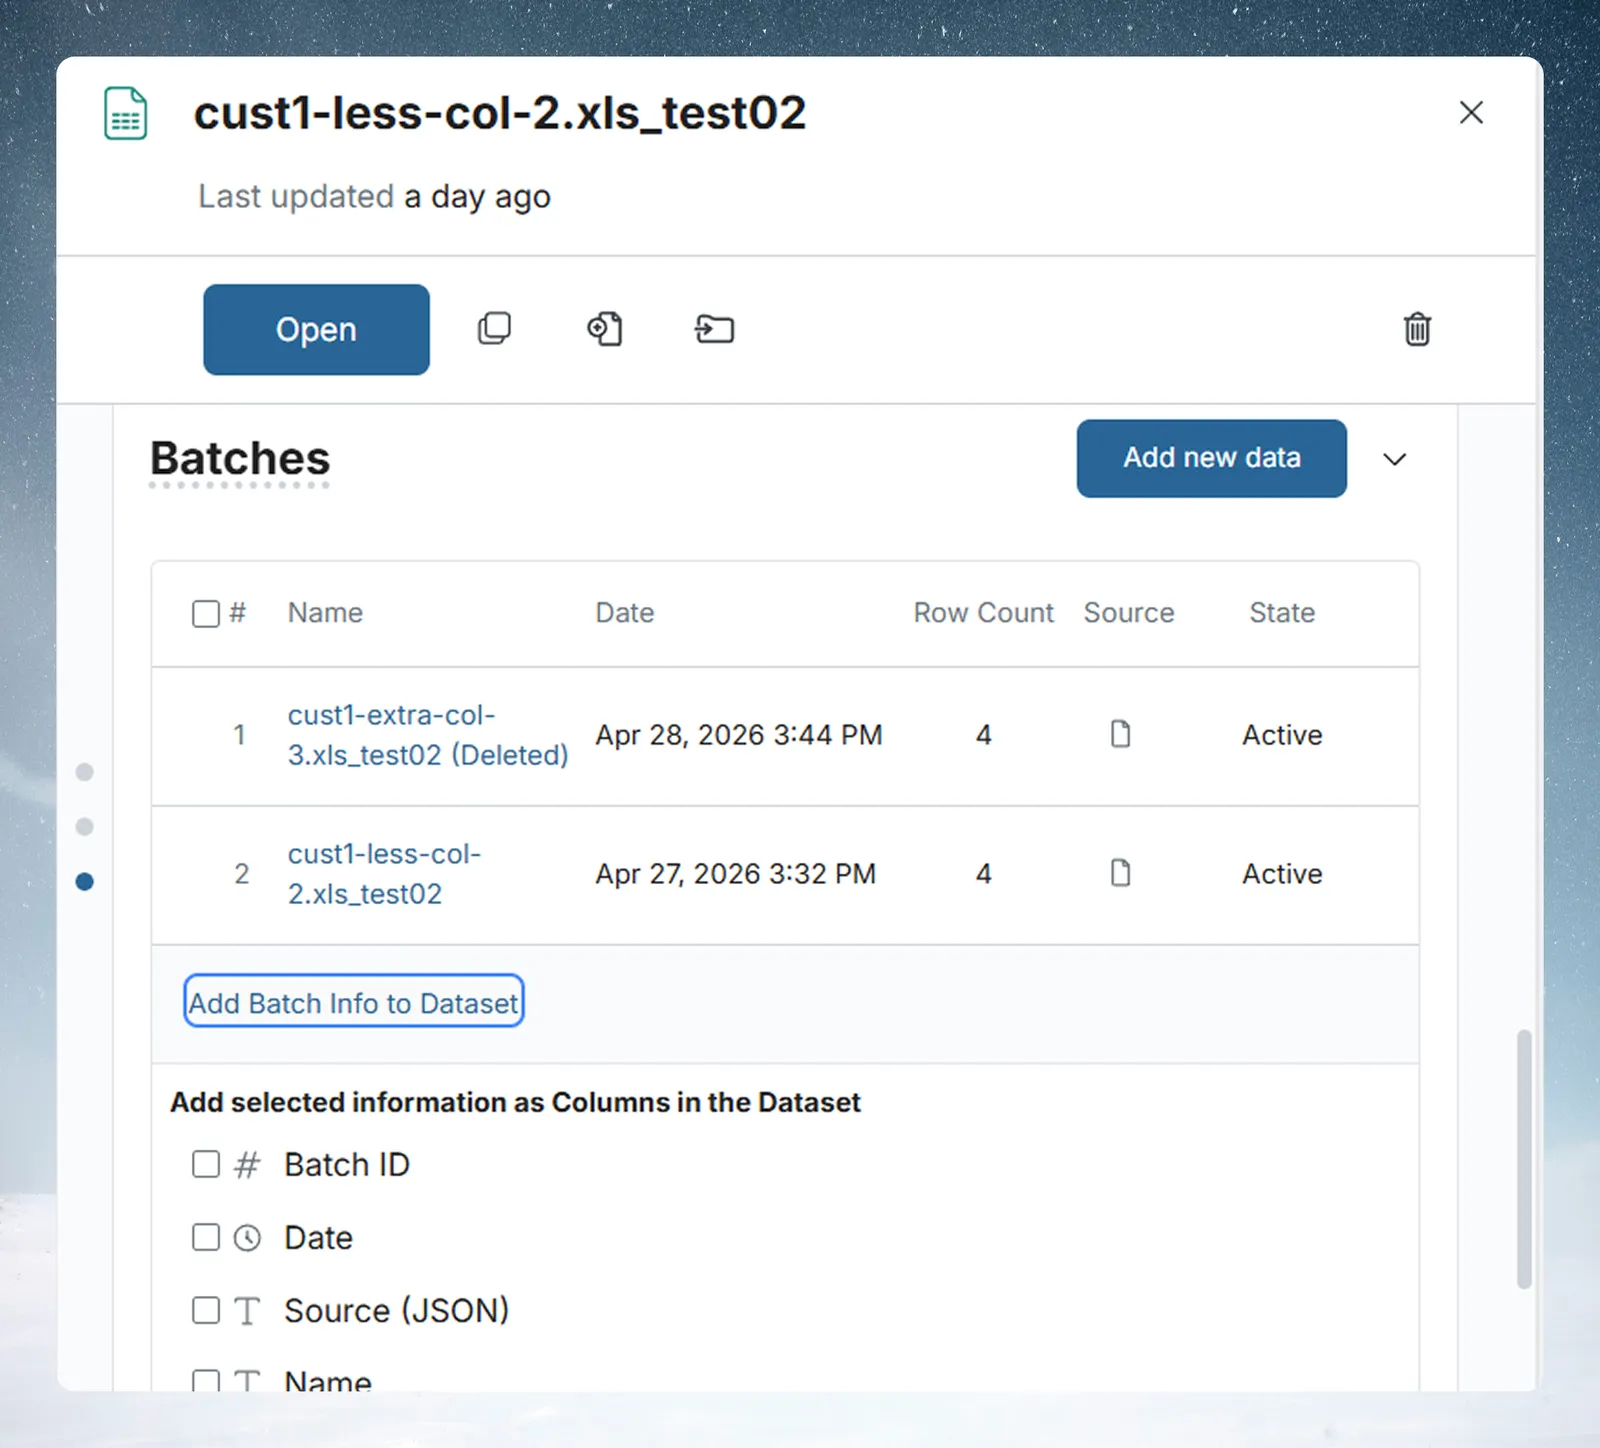
The Batches section lists every batch that belongs to the dataset, with the batch count in the header. Each file upload, API sync, or manual data load creates one batch.
Click Add new data (file-related datasets only) to append or replace data. This opens the Add or Replace Data workflow.
When an added batch needs review, a warning callout, Added batches require your input, appears in the panel with a Batch Settings button that opens the review. Such batches sit at the top of the table with a Pending state (click it to open Batch Settings) or Applying recipe while a recipe runs.
The batches table
| Column | Description |
|---|---|
| # | Checkbox with the batch's sequence number |
| Name | Source file name or connector identifier |
| Date | Timestamp of when the batch was created |
| Row Count | Number of rows in this batch |
| Source | Icon indicating source type (file, API, connector, etc.) |
| State | Current batch state (see below) |
Click a batch name to open a full-screen preview modal showing all rows in that batch. The table shows 10 batches per page.
Batch states
| State | Meaning |
|---|---|
| Active | Rows in this batch are live—included in all Views and pipeline runs |
| Suspended | Rows are excluded from Views and pipelines. The batch is preserved and can be unsuspended at any time. |
| Pending Delete | A retention policy selected this batch and is waiting for approval. Approve the row's Delete or Suspend button to carry it out. |
Suspending a batch is reversible. Deleting a batch permanently removes its rows from the dataset.
Batch actions
- Select batches: Use the checkboxes to select one or more batches, then choose an action from the toolbar that appears.
- Suspend / Unsuspend: Toggle a batch between Active and Suspended without losing the data. A confirmation says that suspending removes the batch from all associated views and unsuspending restores it.
- Delete: Permanently remove selected batches. A confirmation modal lists the batches before deletion. Some batches can't be deleted separately from their dataset yet, or aren't ready to delete; the panel tells you when that is the case.
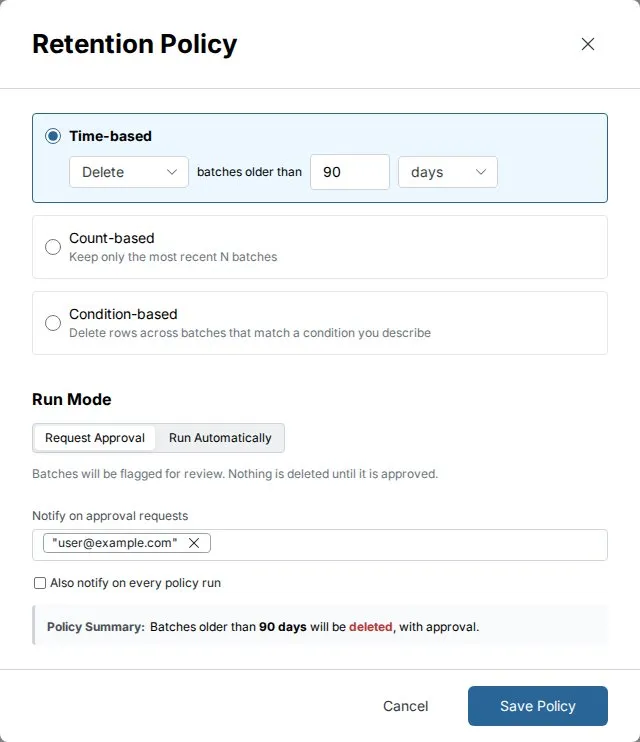
Retention policy
A retention policy deletes or suspends batches automatically, by age, by count, or by a condition you describe. When no policy exists, the Set up retention policy link at the bottom of the Batches section opens the policy settings. It is available on plans that include data retention. When a policy exists, a Retention Policy banner shows its status, a Run Policy button, and its last and next run. When a policy awaits approval, bulk Approve All and per-batch buttons appear. See Batch management for the details.
Add batch info to the dataset
The Add Batch Info to Dataset link at the bottom of the Batches section opens a column selector. It lets you import batch metadata as new columns on the dataset—once added, they flow into every View built on it, the same as any other column. The link is disabled when the dataset has no batches. Add batch info in the Column Manager offers the same choice.
Available metadata columns:
| Metadata column | What it contains |
|---|---|
| Batch ID | Internal identifier for the batch |
| Date | Timestamp of when the batch was created |
| Source (JSON) | Source details for the batch, as JSON |
| Name | Source file name or connector identifier for the batch |
| Row Count | Number of rows in that batch |
Click Submit to add the selected columns, or Cancel. Columns are prefixed with batch_, for example batch_Row Count. All views of this dataset are affected.
Once added, these columns appear alongside your data columns in every View and can be used in filters, formulas, and exports. This is useful when you need to trace which rows came from which upload, or when you want to filter data by batch date in a pipeline.
Section 4: Automations
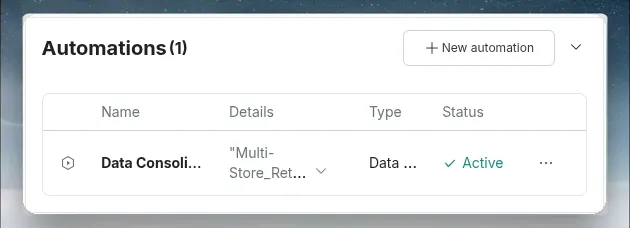
The Automations section lists every automation that's linked to this dataset, for example a scheduled refresh or a downstream automation triggered by new data landing here. The section header shows a count badge (for example, Automations (0)).
- New automation: Opens the create automation modal, limited to the automation types that apply to a dataset (Dataset Refresh for third-party datasets and Data Consolidation), to create an automation linked to this dataset. See Automations.
- If automations are already linked, each one appears as a row with its name, details, type, and status.
Empty-state suggestions
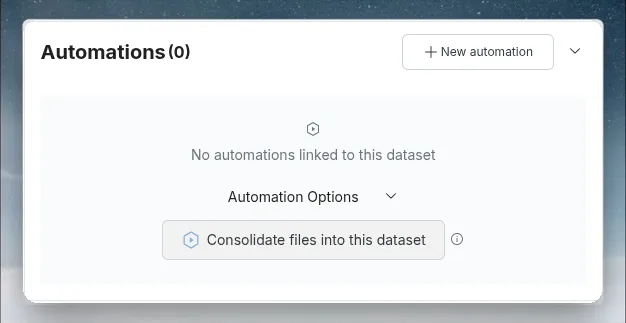
If no automations are linked to this dataset yet, the section shows No automations linked to this dataset and an Automation Options accordion. Each option is a button with an info tooltip:
- If the dataset is connected to a third-party source (API, database, cloud app), Set-up auto refresh pre-fills a Dataset Refresh automation for this dataset.
- Consolidate files into this dataset always appears and pre-fills a Data Consolidation automation with this dataset already selected as the destination.
Clicking either suggestion opens the Create Automation modal with the corresponding type and destination preset already filled in, so you only need to pick the remaining settings (such as the source folder or schedule) before saving.
See Automations for how automations work once created.
Understanding the data hierarchy
Every dataset in Mammoth follows this structure:
Dataset
  └── Batch(es)       ← individual data loads (each file upload = one batch)
  └── View(s)         ← transformation pipeline outputs built on the batches
       └── Pipeline tasks  ← filters, formulas, joins applied to produce the View
- Batches are the raw inputs: the individual data loads you can suspend, delete, or retire with a retention policy.
- Views are the processed outputs—shaped by whatever pipeline tasks you've built.
- The Preview grid inside Overview shows batch data (raw). When you open a View, you see pipeline-transformed data.
Related articles
- Add or replace data: Step-by-step guide to appending or replacing data in a dataset
- Parameters and snippets: Reusable values and logic blocks across pipelines
- Trash and recovery: How dataset deletion, restore, and the 30-day recovery window work