Getting started as a data analyst
This guide is for data and business analysts who spend most of their day in Excel and want to replace repetitive copy-paste work with automated pipelines, without coding. It is a 30-day plan: start with Day 1 below, then move to Week 1 and Month 1.
The guide covers your first 30 days with Mammoth, from uploading your first file to replacing manual workflows with automated pipelines.
The 30-day learning path
The plan has three milestones:
Day 1 → First transformation and first complete pipeline
Week 1 → Replace a manual workflow
Month 1 → Multiple automated workflows and a shared dashboard
Day 1: Build your first pipeline
Start by automating one repetitive task. Pick a file you work with regularly.
Upload your Excel or CSV file
Prerequisite: A Mammoth account and an Excel or CSV file.
Drag and drop your Excel file or CSV into Mammoth. The data opens in a spreadsheet-like interface.
Explore columns with Explore Cards
Click the Explore icon on a column to open its Explore Card. These interactive visualizations show you:
- Text columns: Bar charts displaying the most common values
- Numeric columns: Distribution charts revealing patterns and outliers
- Date columns: Timeline views showing data spread
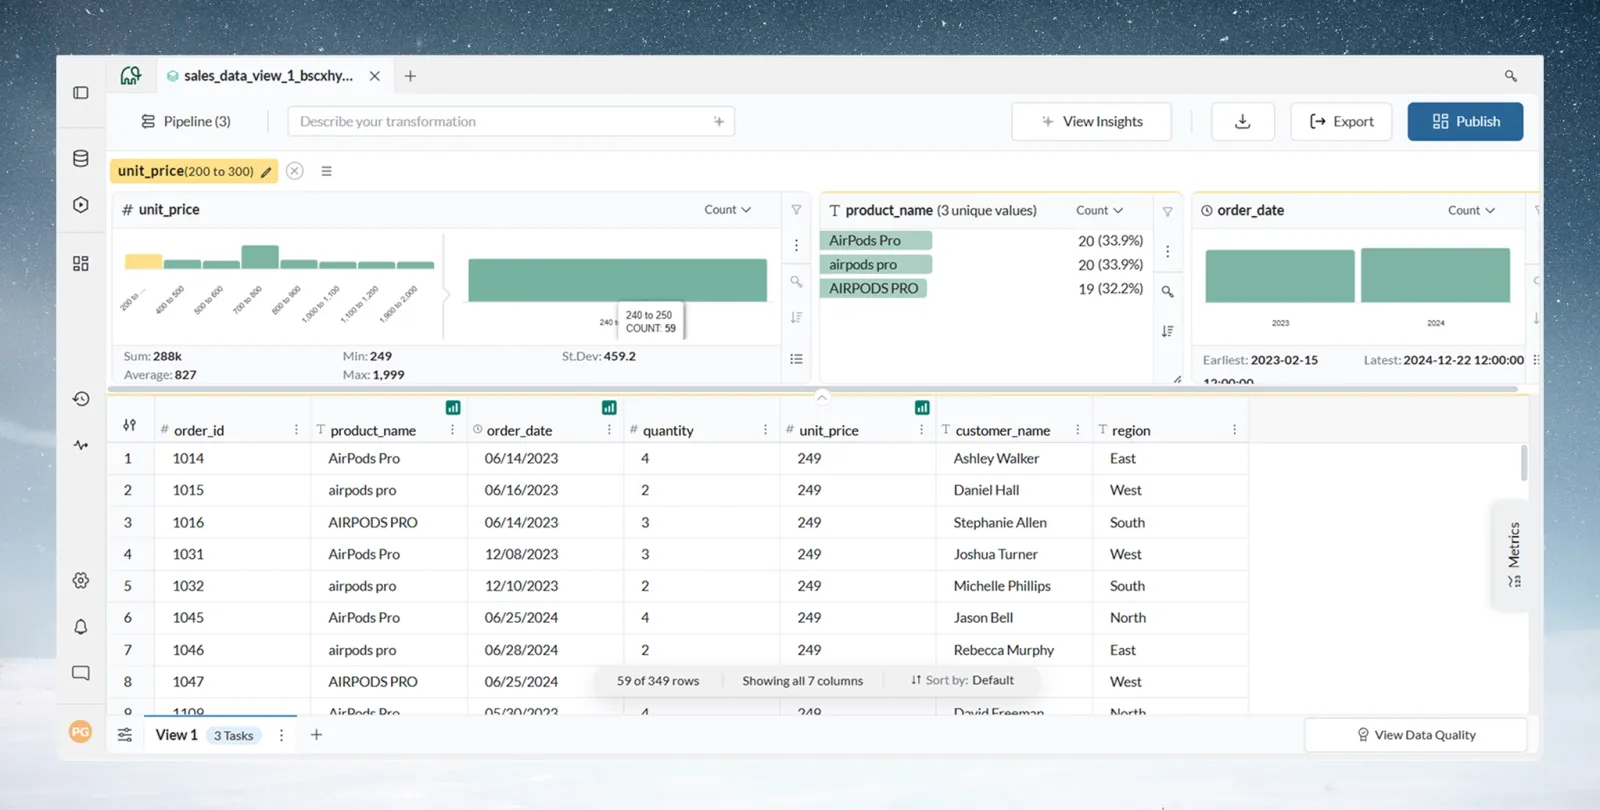
Explore Cards show data quality issues, patterns, and distributions without formulas.
Double-click any value in an Explore Card to filter your data. These quick filters help you investigate issues and can be converted into permanent pipeline tasks later.
Remove test rows with a Conditional Filter
The most common starting point is removing unwanted rows. This example excludes test data:
- Click the + button (tooltip Add a task) to open the transform picker
- Select Filter, Label & Replace → Conditional Filter, or search for it in the picker
- Choose your column (like "Status")
- Select "does not contain"
- Type "test"
- Click Apply
Expected result: The filter appears as a task in the Pipeline panel and runs on every future data refresh.
Your Excel process:
Open file → Apply filter → Copy visible cells → Paste to new sheet → Save as new file
Mammoth process:
Open View → Add Conditional Filter → Done
The Mammoth pipeline saves this logic, so next month's data uses the same pipeline.
Week 1: Replace a manual workflow
Choose the workflow that matches your situation.
Option A: Monthly report preparation (most common)
Current state: Monthly downloading, cleaning, combining, calculating, and formatting of data for reports.
Mammoth solution: One-time pipeline setup, then run and export each month.
Workflow steps:
-
Connect Your Data
Upload your Excel file or connect directly to your database with a Live Connection. With a Live Connection, a Dataset Refresh automation can pull new data on a schedule, so you don't download files manually. -
Build Your Pipeline
Add the transformations you typically do manually:- Conditional Filter: Remove test accounts or old data
- Bulk Replace: Standardize company names (Mammoth suggests groups of similar values)
- Convert Column Type: Fix dates and numbers that imported as text
- Math Functions: Calculate totals, percentages, growth rates
- Group & Pivot: Summarize by category or time period
-
Save as View
Your pipeline automatically saves. Every transformation runs the same way every time. -
Set Up Automation
Create a Dataset Refresh automation and choose your schedule. The pipeline runs automatically on every refresh.
Option B: Daily sales dashboard
Current state: Daily extracting from CRM, cleaning, pivoting, and emailing results.
Mammoth solution: Automated refresh with a live dashboard, so stakeholders see current data without waiting for your email.
Option C: Weekly metrics email
Current state: Weekly consolidating sources, calculating KPIs, and formatting for stakeholders.
Mammoth solution: A scheduled Messaging automation emails the view to stakeholders.
Essential transformations for business users
Start with these five transformations to automate most manual workflows.
1. Conditional Filter: remove unwanted data
Common uses:
- Filter to current year only:
Order_Date is later than 2024-01-01 - Remove test accounts:
Email does NOT contain @test.com - Focus on specific regions:
Region is East OR West - Exclude cancelled orders:
Status is NOT Cancelled
2. Bulk Replace: standardize messy data
Common uses:
- Company names with variations: "iPhone 15 Pro", "iphone 15 pro", "iPhone15Pro" → all become "iPhone 15 Pro"
- Product categories: many variations → a short list of standard categories
- Department names: "HR", "Human Resources", "HR Dept" → "Human Resources"
When you use Bulk Replace, Mammoth groups similar values and suggests standardization. You review and approve.
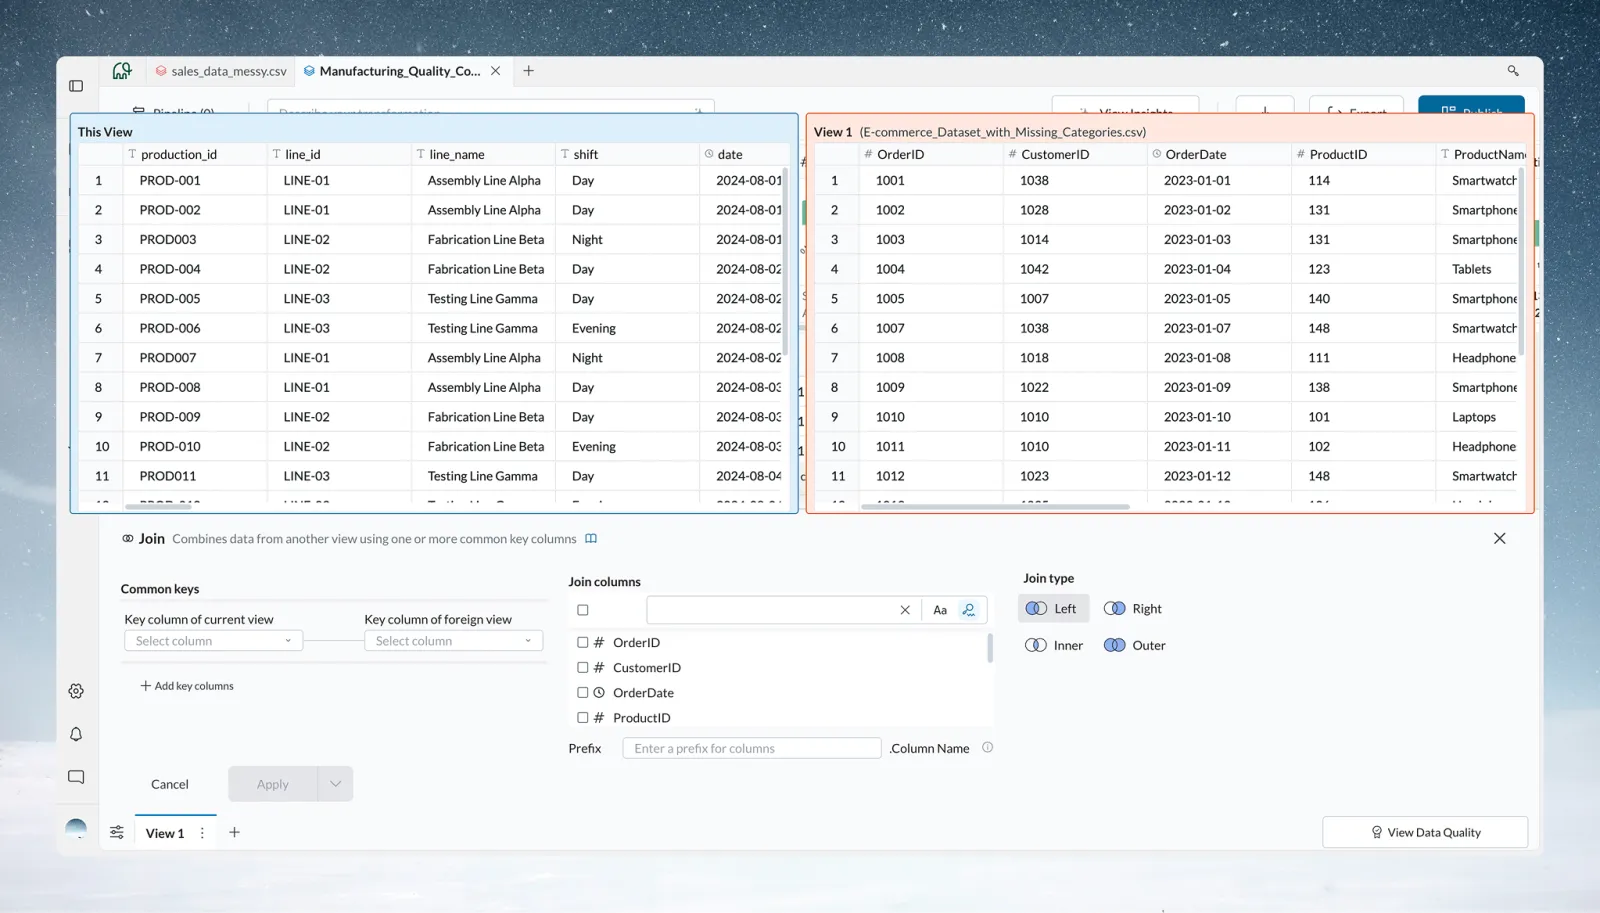
3. Join: combine data from multiple sources
Common uses:
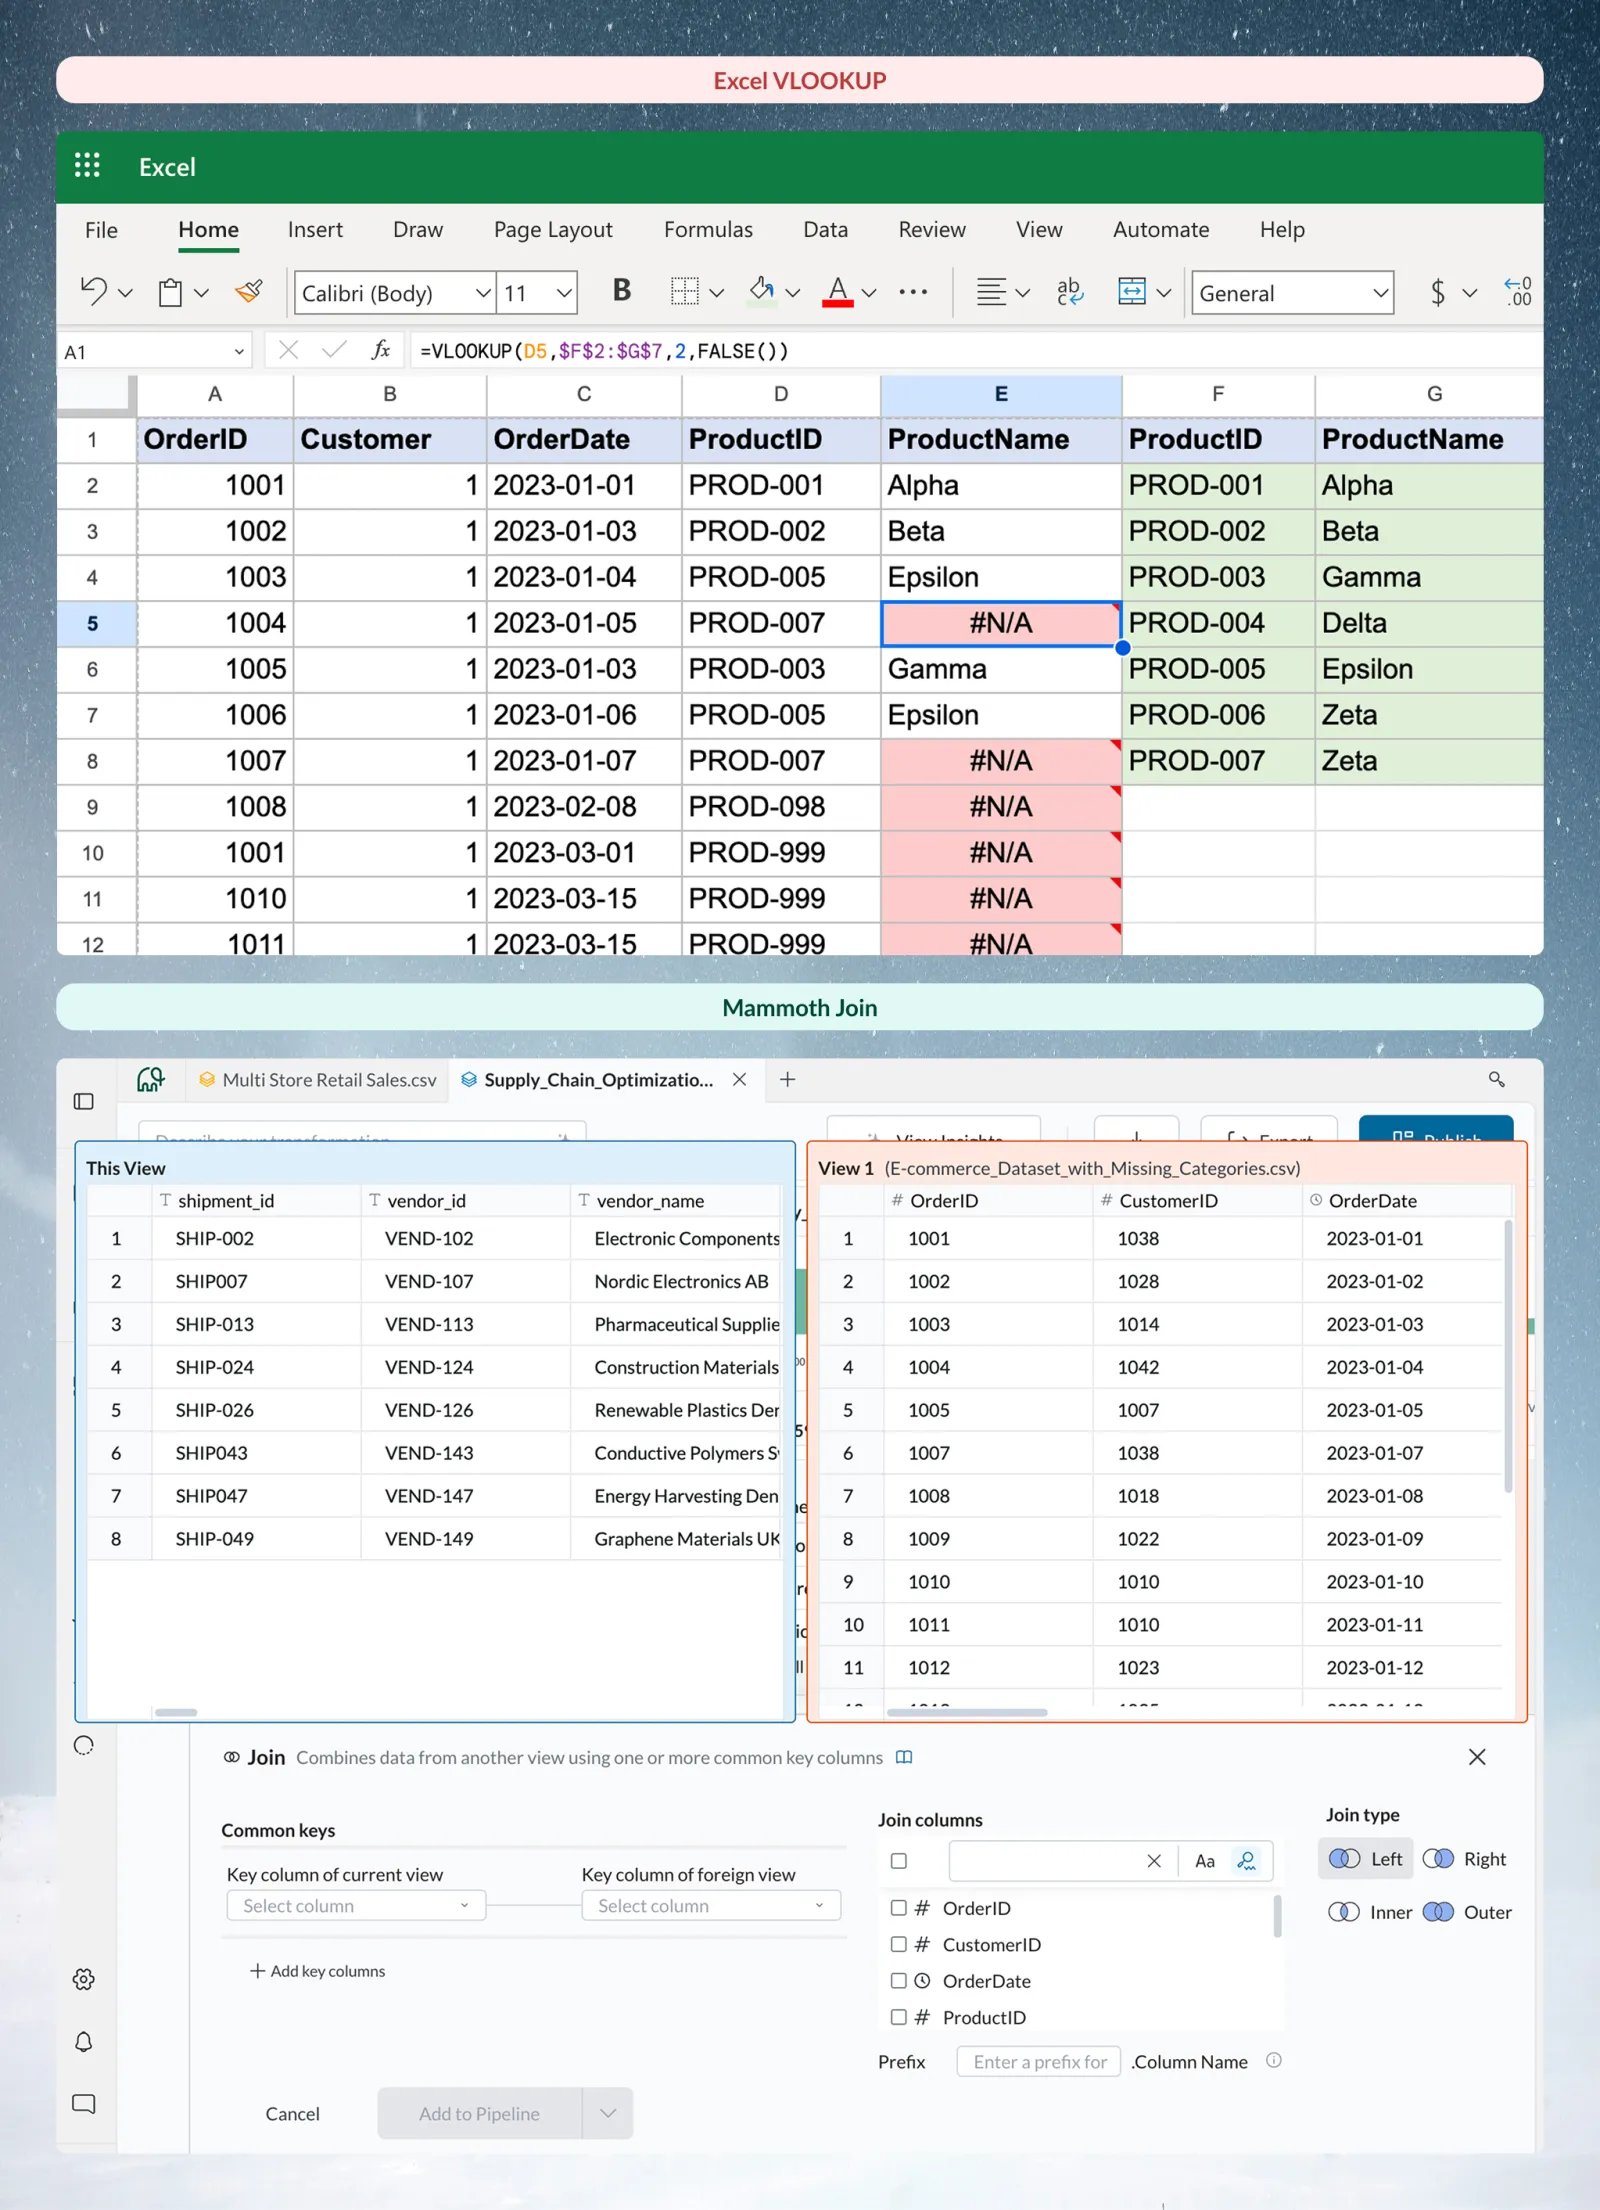
- Add customer names to order IDs: No more VLOOKUP formulas
- Enrich sales data with product details from master list
- Lookup pricing information for quotes
4. Math Functions: calculations
Common uses:
- Calculate profit margins:
(Revenue - Cost) / Revenue - Year-over-year growth:
(This_Year - Last_Year) / Last_Year - Running totals for cumulative analysis
- Percentage calculations for reporting
5. Group & Pivot: summarize data
Common uses:
- Sales by region showing geographic performance
- Monthly totals for trending analysis
- Category summaries for executive reports
- Top 10 customers for account management
View Insights and View Data Quality
Business analysts often need to answer one question before building anything:
“Can I trust this data, and what should I fix first?”
View Insights and View Data Quality answer this without manual checks or formulas.
View Insights: business-level observations
View Insights automatically surfaces meaningful observations that help business analysts understand how the data behaves and where analysis may be blocked.
Typical observations include:
-
Inconsistent naming that fragments analysis (for example, the same product appearing under multiple formats)
-
Sparse or uneven date coverage that prevents trend analysis
-
Customer purchase patterns indicating low repeat behavior
-
Pricing spreads that suggest review or standardization
-
Signals of missing or incomplete tracking
These insights allow analysts to quickly assess readiness, identify risks, and decide which transformations are required—before investing time in pipeline design.
View Data Quality: formal validation
View Data Quality provides a structured evaluation of dataset health using standard data quality dimensions.
The assessment covers:
-
Completeness: Identification of missing values
-
Validity: Verification of format and rule compliance
-
Uniqueness: Detection of duplicate identifiers
-
Consistency: Identification of value mismatches and variations
-
Accuracy: Flagging values outside expected ranges
-
Timeliness: Measurement of data freshness
Each view receives:
-
An overall Data Quality Score
-
Clearly categorized critical issues and warnings
-
Recommended actions to improve quality
This enables business analysts to validate data upfront, rather than discovering issues after dashboards or reports are built.
AI features for business users
Mammoth's AI features create transformations from a plain-language description, so you don't write syntax or code.
Describe your transformation (natural language)
Instead of clicking through menus, type what you want in the Describe your transformation box of the transform picker:
Type: "Remove orders from test accounts"
AI creates: Conditional Filter excluding test emails
Type: "Standardize company names"
AI creates: Bulk Replace with smart grouping
Type: "Calculate profit margin percentage"
AI creates: Math Function with correct formula
Create a dashboard with AI
Scenario: You need an executive dashboard showing sales performance.
AI approach: Describe the dashboard you want, such as "Create sales dashboard showing revenue by region", and Mammoth generates dashboard options from your data.
Month 1 milestones
Track your progress with this 30-day checklist:
Week 1 achievements
- First dataset uploaded or connected
- First pipeline created (3+ transformations)
- First manual workflow automated
- Improved data quality
Week 2 progress
- Second workflow automated
- First Join transformation (combining sources)
- First scheduled automation setup
- Shared first View with colleague
Week 3 expansion
- First Describe your transformation request used successfully
- First dashboard created
- Third workflow automated
Week 4 mastery
- Advanced pipeline (7+ tasks)
- Multi-source consolidation
- Dashboard shared with stakeholders
- Training colleague on first workflow
Common analyst scenarios and solutions
Scenario 1: "I have 12 Excel files to consolidate monthly"
Old way: Open each file, copy data, paste into master, delete headers, fix formatting, save.
Mammoth way: Upload files to same Dataset as Batches, View automatically combines them, run the pipeline, and export or create a dashboard.
Scenario 2: "My VLOOKUP keeps breaking"
Old way: VLOOKUP formula across sheets breaks when columns move, #N/A errors everywhere, long debugging sessions.
Mammoth way: Join transformation with a visual interface that matches rows by the columns you choose.
Scenario 3: "I need to send the same report weekly"
Old way: Download new data, run through manual steps, format for executives, email manually.
Mammoth way (automated): Schedule dataset refresh, pipeline runs automatically, dashboard updates, automated email notification sent.
Scenario 4: "Data quality issues waste my time"
Old way: Discover issues after analysis started, backtrack to fix, rebuild analysis.
Mammoth way: Use View Insights to surface potential issues early and View Data Quality to formally validate data before building. Problems are identified upfront, recommended actions are provided, and fixes can be applied once and automated through pipelines.
Where to get help
In-app resources:
- Hover tooltips on features
- Describe your transformation generates transformations from descriptions
- The Help (book icon) in the Function Panel opens the documentation for that transformation
Documentation:
- Getting started guides, like this one
- Transformation function reference
- Common workflow examples
Support:
- Use the Support option in the sidebar to ask questions, report issues, or share feedback
Next steps after month 1
Once your first workflows are automated, here's how to continue growing:
Months 2 to 3: Intermediate skills
- Advanced Join patterns (multiple sources, complex conditions)
- Complex conditional logic with AND/OR operators
- Custom aggregations and calculations
- Dashboard interactivity and filters
Months 4 to 6: Advanced capabilities
- API integrations for real-time data
- Advanced automation, such as running Dataset Refreshes in a sequence
- Performance optimization for large datasets
Becoming a team resource
As you gain expertise, you can:
- Train colleagues on workflows you've automated
- Document best practices for your team
Next step
Follow the Quick start to upload a file and build your first pipeline, or read Core concepts.