Getting started as a manager
This guide is for managers of data teams. It covers how to set up a project, invite your team, standardize recurring workflows, review team activity, and share executive dashboards. You don't need to build pipelines yourself, because your team does that. Start with the Project Admin section below, then follow the first-48-hours plan.
The Project Admin role
When you create a project in Mammoth, you automatically become the Project Admin for that project. The role gives you management capabilities without requiring you to handle technical details.
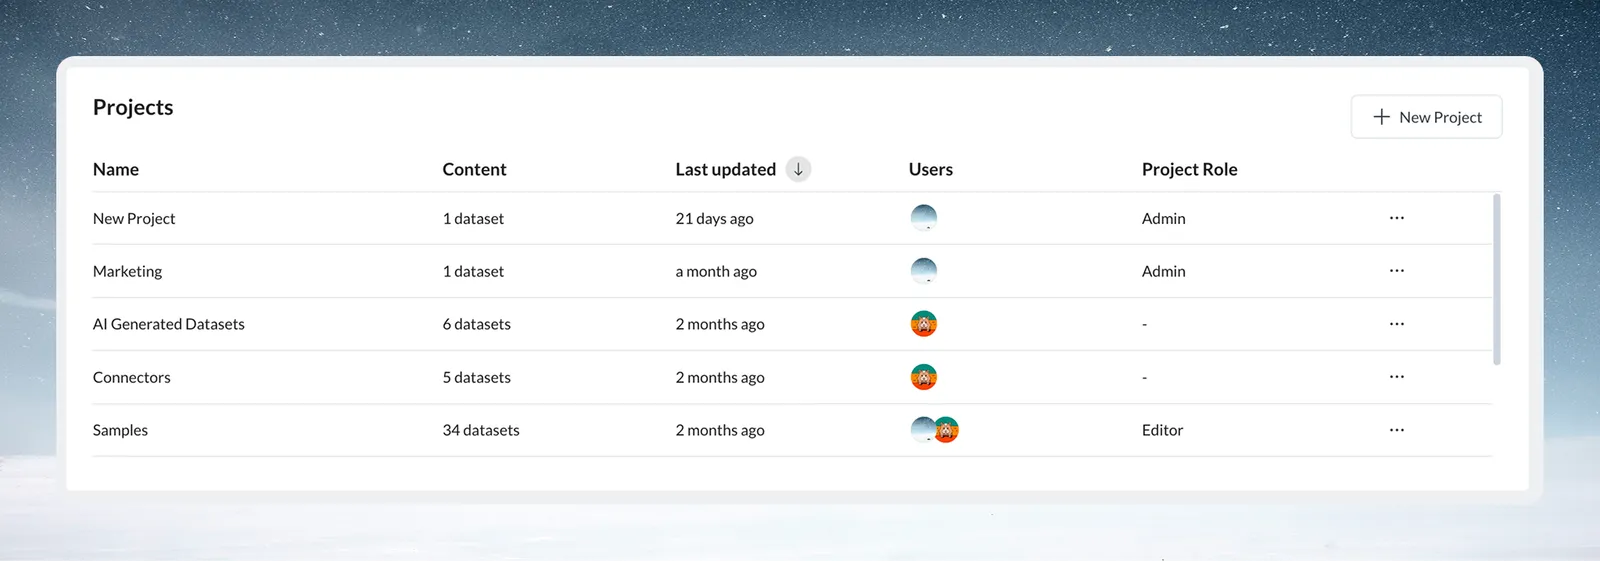
What a Project Admin can do
As Project Admin, you control your project's team, data access, and governance settings. You set the boundaries and your team works within them.
Core capabilities:
- Team Management: Add workspace members, invite external users, and remove access when someone leaves
- Access Control: Create and manage the Live Connections your team uses
- Activity Monitoring: See what your team is working on through the Activity Log (Monitor → Activity Log tab)
Project Admin versus Project Editor
This table shows what each role can do:
| Capability | Project Admin (You) | Project Editor (Your Team) |
|---|---|---|
| Add or remove project members | ✓ | ✗ |
| Rename or delete the project | ✓ | ✗ |
| Create, update, or delete Live Connections | ✓ | ✗ |
| Create or modify queries from Live Connections | ✓ | ✓ |
| Add, edit, or delete datasets, views, and pipelines | ✓ | ✓ |
Designate a backup admin from your team for business continuity. If you're unavailable, someone else can handle urgent team access needs.
Project Admins control who can do what, and Project Editors control how they do it.
Your first 48 hours as a manager
This plan sets up the foundation for your team rather than covering every feature.
Hour 1: Create a project and pick a use case
Prerequisite: A Mammoth account.
Create your first project
- Open the project selector in the Data Library and click New Project
- Name it something meaningful: "FP&A Monthly Reporting" or "Operations Analytics"
- Confirm to create the project
Expected result: The project opens and you are its Project Admin.
Platform hierarchy
Mammoth organizes data in this order:
- Workspace: Your subscription
- Project: Your team's work area
- Dataset: Where data lives after upload or connection
- View: Where your team transforms data
- Dashboard: What you share with executives
Managers mostly work at the Project level: managing team access, reviewing activity, and creating dashboards from the team's work.
Choose your first use case
Migrate one recurring process first rather than everything at once. Candidates:
- Monthly financial close report
- Weekly operations dashboard that requires manual updates
- Quarterly analysis that involves copying data between 5 spreadsheets
This process becomes the proof of value for wider adoption.
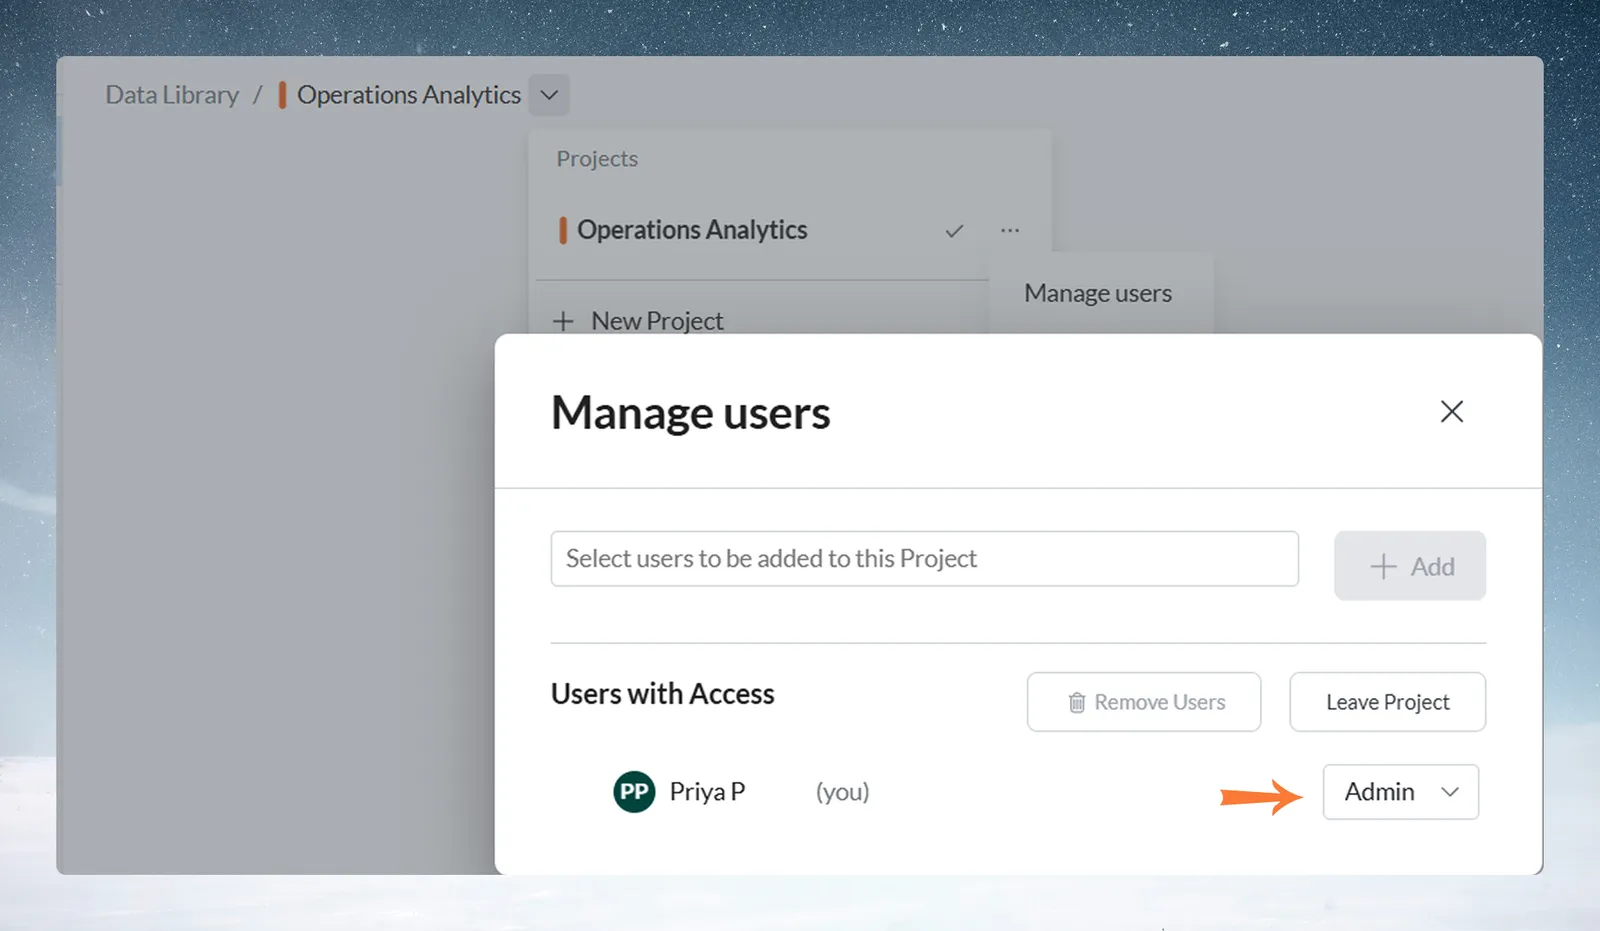
Hours 2 to 4: Invite your team and set permissions
Start small: Invite 1 or 2 team members first. They can help onboard the rest of the team.
- Click on your project's three dot menu
- Click Manage Users
- Select the workspace members to add
- Assign their role: Project Editor for most team members, Project Admin for backup admins
Expected result: The added members appear under Shared with, each listed by role.
Configure Project Settings
Set up governance from the start:
-
Open Project Settings from the project menu
-
The menu options depend on your role in that project:
Project Admins see the full set of options:
- Project Settings: rename the project, set a date format, and control who can access it
- Manage Users: add or remove workspace members and assign their project roles
- Leave Project
- Delete Project
Project Editors see only:
- Leave Project
You can change these settings at any time. Starting restrictive and loosening later is easier than revoking access afterward.
Hours 24 to 48: Observe a first team workflow
Watch how the platform works in practice:
- Have a team member upload a recurring data file (like last month's sales report)
- Watch them build a pipeline. Your goal is to understand the process, not to build it yourself.
- Review the Activity Log to see their actions recorded
- Schedule a brief team sync to discuss how this could standardize your recurring workflow
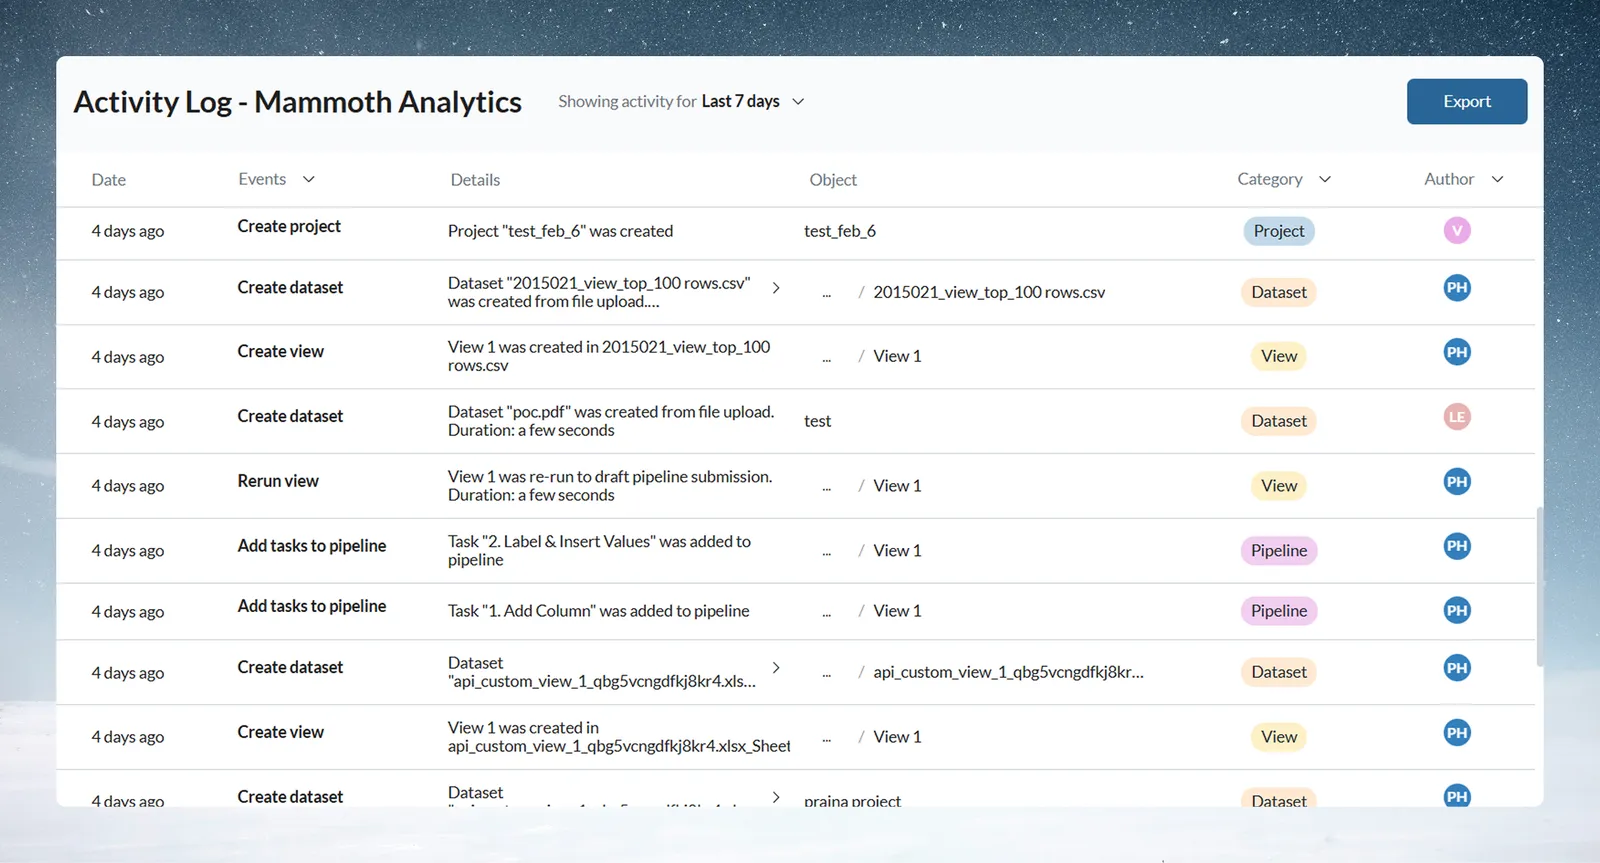
The aim is to understand how standardization works so you can replicate successful patterns across your team.
Team standards and governance
This section covers how to create consistency without managing each person's execution.
Process standardization framework
Use this five-part pattern for recurring workflows:
1. Identify repetitive workflows
Look for processes that happen monthly, quarterly, or on-demand regularly:
- Monthly close reports
- Weekly operations summaries
- Quarterly board presentations
- Recurring client deliverables
2. Document the current process
Spend time with the team member who does it today. Understand:
- Where does data come from?
- What transformations happen?
- What's the final output?
- How long does it take today?
3. Build a reference pipeline
Have your most technical team member create the reference version in Mammoth. This becomes your template.
4. Enable team replication
Other team members copy the reference pipeline and adapt for their specific needs. The core logic stays consistent.
5. Monitor adoption
Use the Activity Log weekly to see:
- Who's using the reference pipeline?
- Where are people deviating? (might reveal improvements)
- Are people still doing manual processes?
Governance configuration
Set boundaries that protect data while your team works independently.
Access control for projects
Project access is role-based and limited to invited members only.
-
Project Admin: Full permissions, including managing members and project settings
-
Project Editor: Can work with project data but cannot manage members or create Live Connections
Users added to the project have an assigned role (Admin or Editor). The project's Who can access setting controls whether everyone in the workspace, selected people, or only you can access it.
Connector restrictions for projects
Connector availability is managed at the project level by Project Admins.
To create a new connection (Project Admin only):
-
Click New Dataset
-
Select Connectors
-
Click New Connection
-
Configure and save the connection
Once created, the connection becomes available within the project and can be used by Project Editors to create datasets.
If a connector has not been created or enabled, project members will see a prompt instructing them to contact their Project Admin to request access.
Only Project Admins create connections, so data source access stays controlled.
Executive dashboards for leadership visibility
Managers can generate dashboards from a View their team prepared, instead of asking the team to build presentation materials.
Why managers create dashboards
AI-powered dashboard creation lets managers:
- Answer executive requests without waiting for team availability
- Board presentation materials generated from your team's data
- Give stakeholders self-service access, which reduces ad-hoc data requests to your team
Create a dashboard from a View
Prerequisite: Your team has prepared the data in a View.
- Click Create to open What do you want to build?
- Pick the lane: With my data builds from a dataset (or starts blank), and With a shape starts from a template, a report you already send, or one of your existing dashboards
- Choose your team's prepared data and review the starting points Mammoth suggests from your columns and dates, or describe what you want
- Pick a format: Dashboard, Slides, Doc, or Q&A
- Refine if needed
- Share using Sign-in required or Anyone with the link (see the next section)
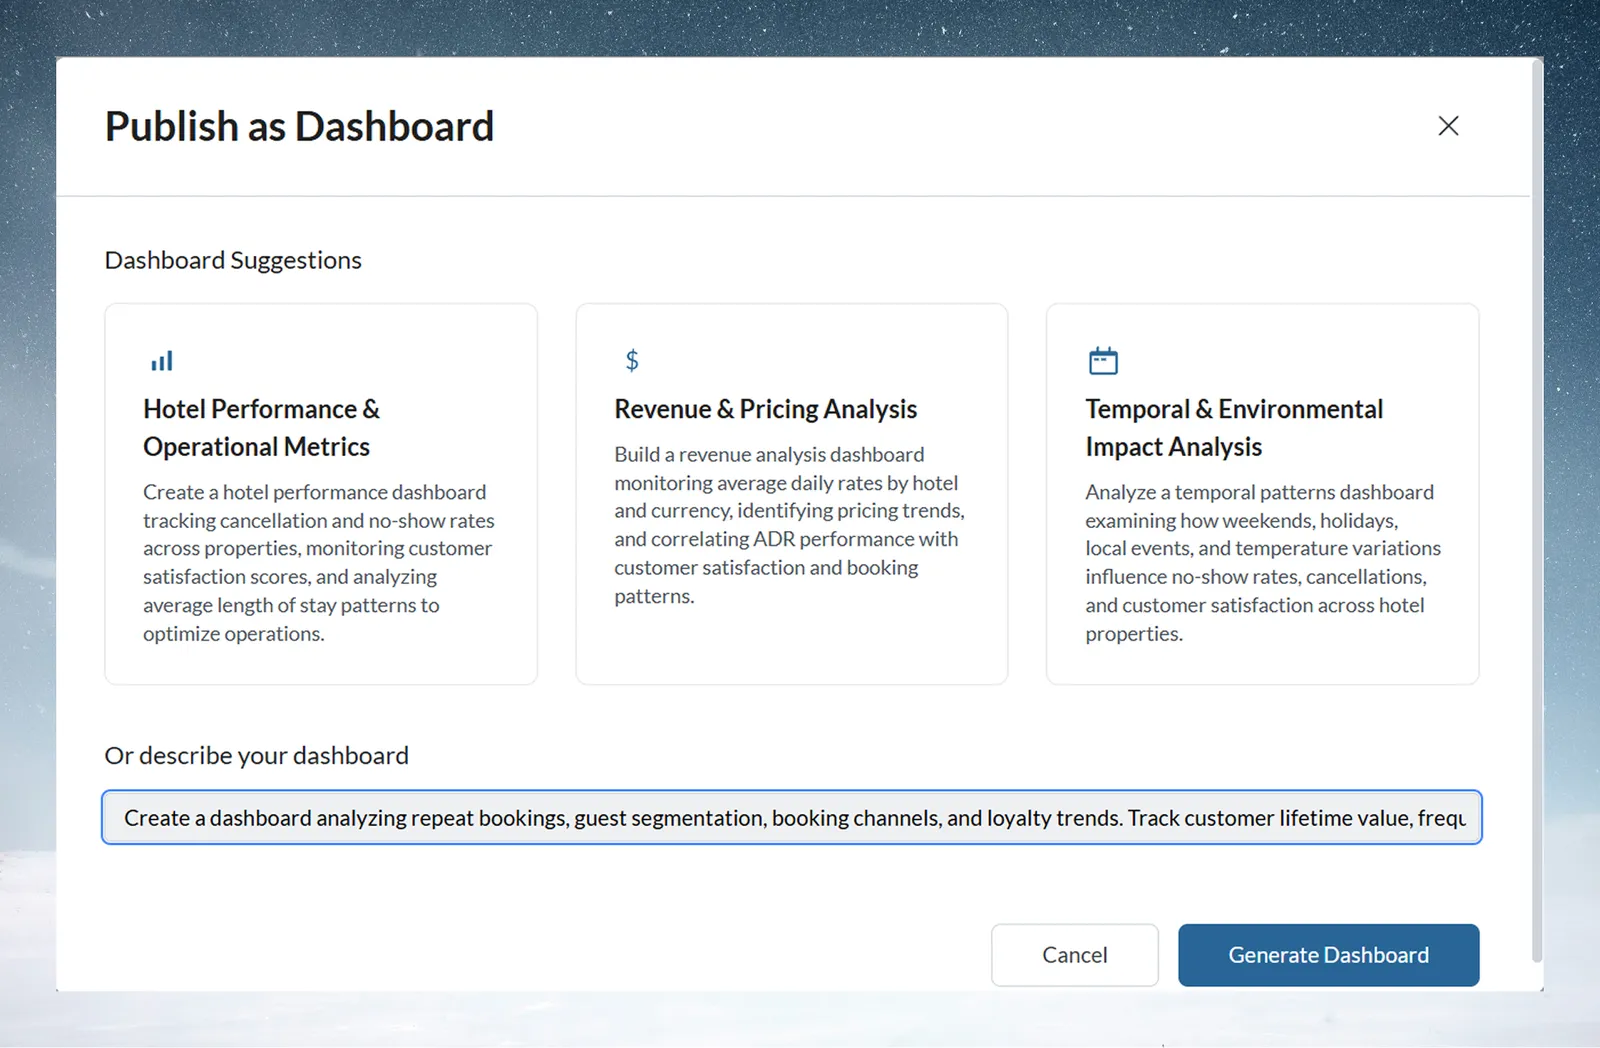
Expected result: A dashboard you can share.
Dashboard sharing options
In the Share dialog, choose who can open a dashboard:
Anyone with the link
- No sign-in needed
- Suited to: Board members, external partners, public reporting
- Use when: Content is appropriate for public view
Sign-in required
- Your project, plus people outside it you invite, must sign in to Mammoth
- Suited to: Internal team dashboards, department KPIs
- Use when: Content is internal-only and viewers have Mammoth accounts
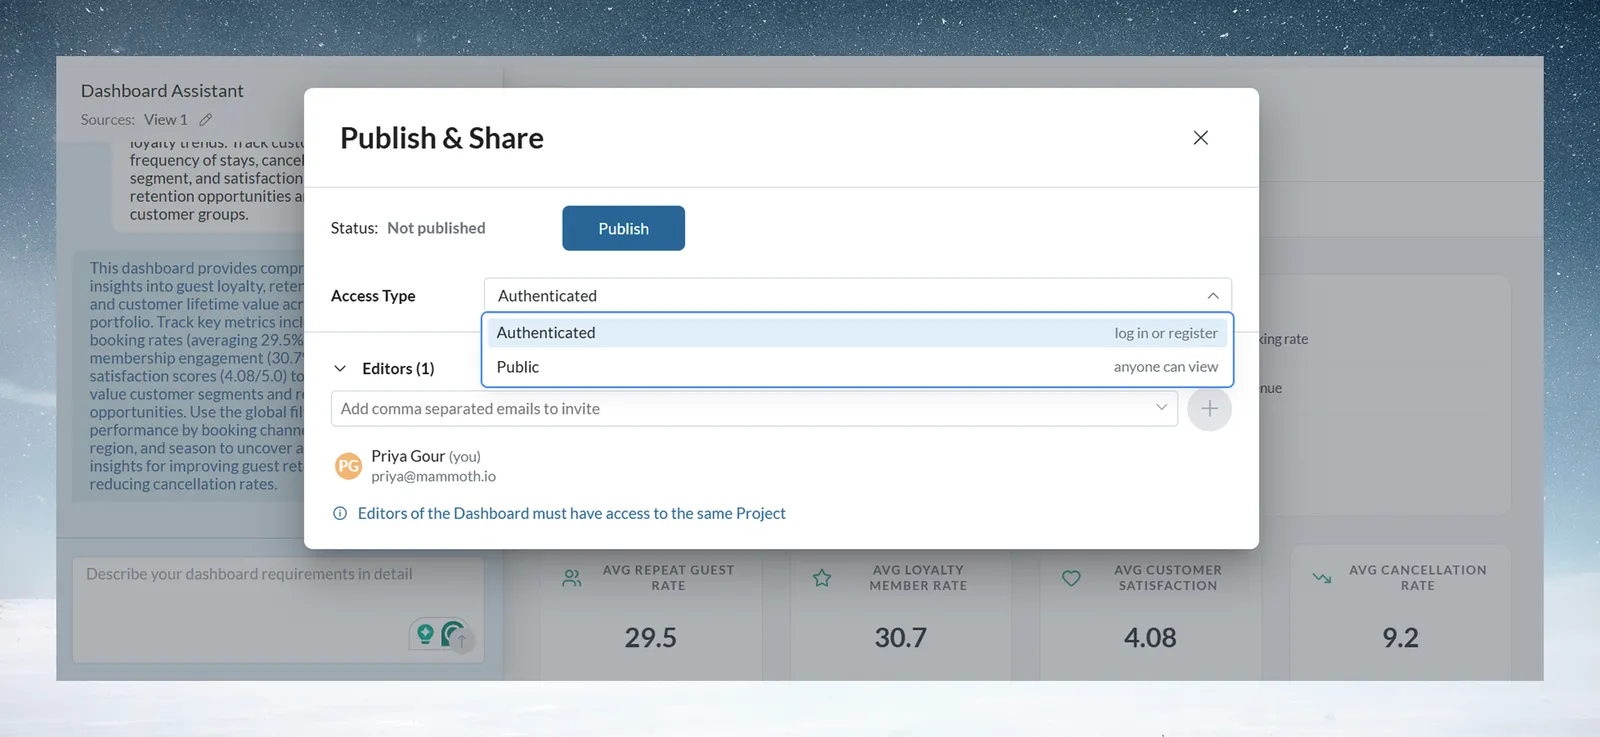
For board presentations, use Anyone with the link and share the link only by secure email. Viewers need no sign-in, and you control who receives the link.
Dashboard use cases for managers
Board preparation: monthly financial overview
Traditional approach: The team creates slides with static charts.
Mammoth approach:
- Open your monthly financial View (team has prepared the data)
- Click Create and select the executive overview suggestion
- Generate the dashboard
- Share with Anyone with the link and send the link to board members
Expected result: The board sees live data, and metrics update when the data refreshes.
Executive requests: ad-hoc analysis without involving the team
Traditional approach: An executive asks "Show me regional performance trends", you interrupt a team member, and wait for a response.
Mammoth approach:
- Open relevant View
- Generate dashboard with prompt: "Regional performance with trend analysis"
- Share with Sign-in required (internal only)
- No team interruption
Cross-functional sharing: give operations current data
Traditional approach: Email weekly Excel reports → recipients manually update their trackers → data becomes stale immediately.
Mammoth approach:
- Create dashboard once from operations View
- Share with Sign-in required and invite the operations team
- Data updates when the View refreshes
- No weekly email or manual updates are needed
Monitor team activity with the Activity Log
The Activity Log shows workspace and project activity, helping managers understand usage patterns, and maintain governance oversight.
What the Activity Log shows
All key actions across projects and workspace settings are recorded automatically:
-
Dataset activities: Dataset creation, updates, combinations, and data additions
-
Pipeline activities: Task and action updates, automation changes, batch status updates
-
View & automation activities: View creation or reruns, automation updates
-
Workspace & project changes: User invitations/removals, role updates, project creation or renaming
Each entry includes the event type, affected object, author, category, and timestamp.
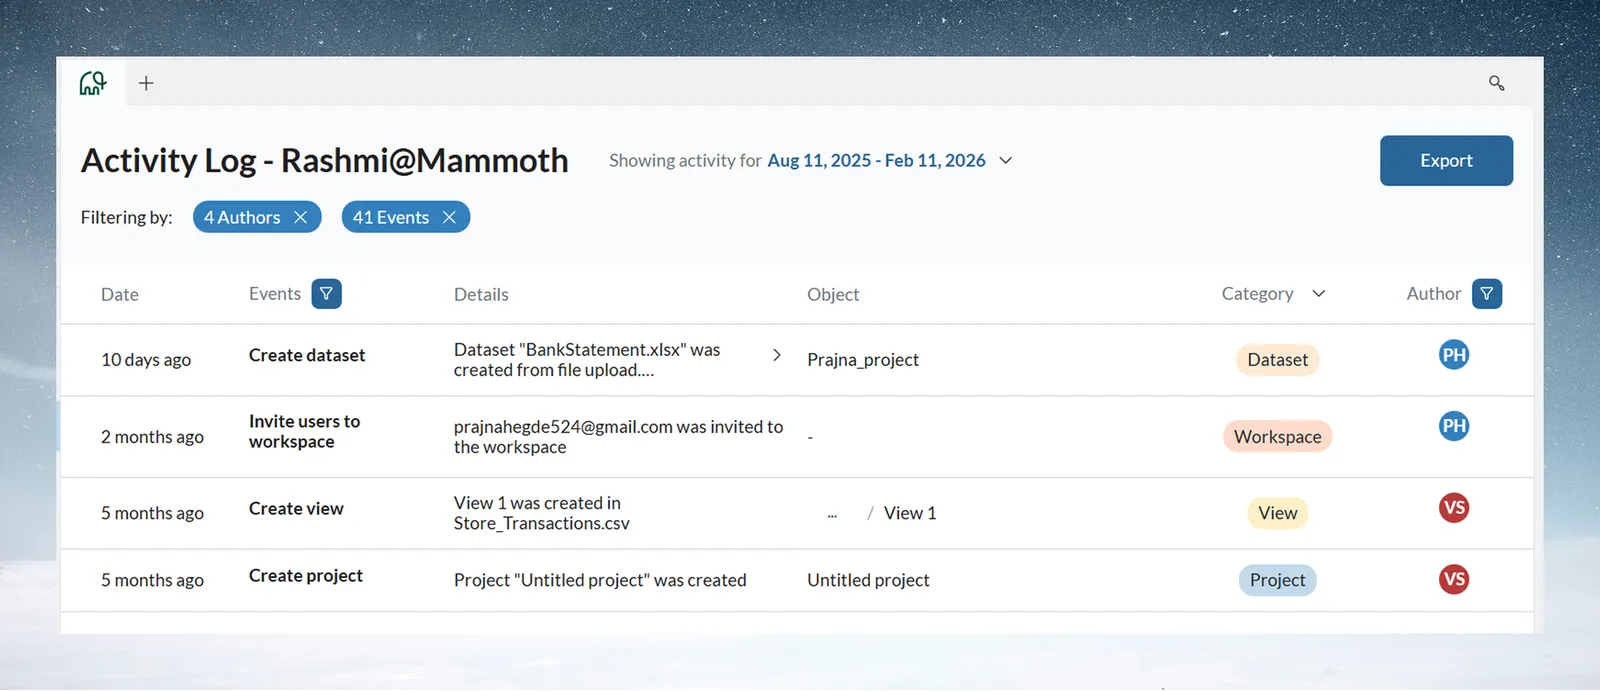
Weekly Activity Log review
Review team activity weekly.
Look for success patterns
- Pipeline replication: Multiple team members using reference workflows (the goal)
- Consistent naming: Team following conventions
- Dashboard creation: Team generating stakeholder-facing outputs independently
Identify training opportunities
- Repeated manual processes: Team member doing same steps weekly (candidate for pipeline)
- Complex pipelines rebuilt frequently: Might need template or training on best practice
- Export patterns: Heavy exports might indicate gaps in dashboard sharing
Acknowledge wins
When a team member replicates a reference pipeline or creates their first dashboard independently, acknowledge it.
Privacy and appropriate use of the Activity Log
The Activity Log shows what happened, not detailed data contents. You see:
- "Sarah created a Conditional Filter task on revenue column"
You don't see:
- The actual revenue values
- Row-level data details
The Activity Log supports monitoring process adoption, not reading team members' data. When you see repeated patterns, ask "How can I help?"
Common patterns indicating training needs
Pattern: Team member rebuilding similar pipelines from scratch repeatedly.
Opportunity: Create a reference template and conduct a short training session.
Pattern: Heavy export activity to Excel, minimal dashboard creation.
Opportunity: Dashboard training might be needed. Team member might not know this capability exists.
Pattern: Same dataset uploaded manually every week.
Opportunity: Set up a Dataset Refresh automation using a Live Connection.
Scaling to the whole team
Once your first 1 or 2 team members are working in Mammoth, expand in stages.
Months 1 to 3: expansion plan
Invite the remaining team members
Stagger onboarding:
- Weeks 1 to 2: Champions (1 or 2 people)
- Weeks 3 to 4: Early adopters (3 or 4 people)
- Weeks 5 to 8: Full team rollout
Early adopters can help train later team members.
Create a reference pipeline library
Document your team's most common workflows:
- Monthly financial close
- Weekly operations report
- Quarterly analysis template
- Customer data standardization
Each reference pipeline should have:
- Descriptive name
- Comments explaining business logic
- Example use cases
- Owner contact for questions
Establish knowledge sharing
Hold a monthly pipeline show-and-tell:
- A team member presents a workflow they automated
- Others ask questions and suggest improvements
Document team best practices
Write down what the team learns:
- Screenshot reference pipelines with annotations
- Create simple wiki page (or shared doc) with team conventions
- Update as team discovers better approaches
Collaboration across teams
Separate projects for different workstreams
Keep project-level isolation:
-
Project: “FP&A Monthly Close” (finance team)
-
Project: “Operations Weekly Reporting” (operations team)
-
Project: “Executive Dashboards” (leadership visibility)
Projects do not share datasets or connections directly. This keeps security boundaries and ownership clear.
Controlled data sharing between projects
When Project A requires data from Project B, use one of the supported sharing methods:
For regular, structured sharing (recommended):
-
Project B exports a View to a shared database (e.g., PostgreSQL, BigQuery)
-
Project A connects to that database via a Live Connection
-
Data updates can be scheduled via automation
For one-time transfers:
-
Export from Project B
-
Import into Project A
For read-only access:
- Share a Published View or Dashboard link
Direct cross-project dataset access is not supported. Sharing must use export or publication workflows.
Connector strategy across projects
Connections are project-scoped and must be created within each project.
Recommended approach:
-
Establish approved shared databases for cross-project data exchange
-
Use read-only credentials for production systems
-
Define department-level access controls within shared data infrastructure
This model keeps project isolation while allowing shared data.
Measuring team impact
Track metrics that matter to leadership. Record a baseline before you automate.
Time
- Before: How long monthly close took
- After: Time with automated processes
Quality
- Error rates: Manual errors before and after automation
- Rework: How often reports need corrections
Adoption
- Active users: How many team members use the platform
- Survey: Whether team members feel process standardization has improved their work
Capabilities to add after 3 to 6 months
Scheduled data refresh with automations
Schedule your data pipelines to run automatically:
- Daily: Operations dashboards update each morning
- Weekly: Management reports ready at the start of the week
- Monthly: Financial close data refreshed on schedule
Your team sets this up once, and it runs on its schedule.
Advanced collaboration features
- Pipeline templates: Use Save as template to keep successful patterns
- Dashboard templates: Standardized executive reporting formats
Integration with existing BI tools
If you use Tableau or Power BI for advanced analytics:
- Mammoth prepares and cleans data
- Export the prepared data to Tableau or Power BI for complex visualizations
Common manager questions
"How do I know if my team is actually using the platform?"
Check the Activity Log - this is your primary indicator:
- Look for pipeline creation in the first weeks
- Multiple team members should be creating datasets, Views, and pipelines
- Look for steady activity from most of your team
Measure displacement of manual processes:
- Are recurring reports now coming from Mammoth?
- Has Excel use decreased for data prep?
- Are team members mentioning it in status updates?
Talk to your team:
- Weekly 1-on-1s: "How's Mammoth working for you?"
- Monthly team meeting: "What workflows have you automated?"
- Anonymous feedback: Quarterly survey on adoption barriers
"What if a team member leaves? How do we preserve their work?"
All work remains in the project - it's not tied to individuals:
- Pipelines persist: Other team members can view, edit, maintain
- Datasets remain: Data doesn't disappear when someone leaves
- Dashboards continue: Shared dashboards keep working
Best practice for transition:
- Before departure: Review Activity Log to see their key contributions
- Assign pipeline ownership: Document who will maintain each workflow
- Knowledge transfer: Hand off complex pipelines
- Remove their access: Clean up permissions after departure
Tip: Assign backup owners for critical pipelines before anyone leaves. Don't wait for departures to create this documentation.
Next steps for managers
After this guide you should have:
- A project with you as Project Admin
- Team members invited with the right roles
- Governance settings configured
- Activity Log reviews scheduled
- A first executive dashboard
Next 30 days: Fully automate one workflow with your team, record the result, and share it with leadership.
Related guides: Quick start, Core concepts, and Getting started as a data analyst.