Reshape, Group & Pivot
The Reshape, Group & Pivot category has two functions for summarizing and restructuring your data.
Group & Pivot
Group & Pivot groups rows by one or more columns and calculates summary statistics. It also supports pivot output—turning unique values from a column into separate column headers, similar to a pivot table in a spreadsheet.
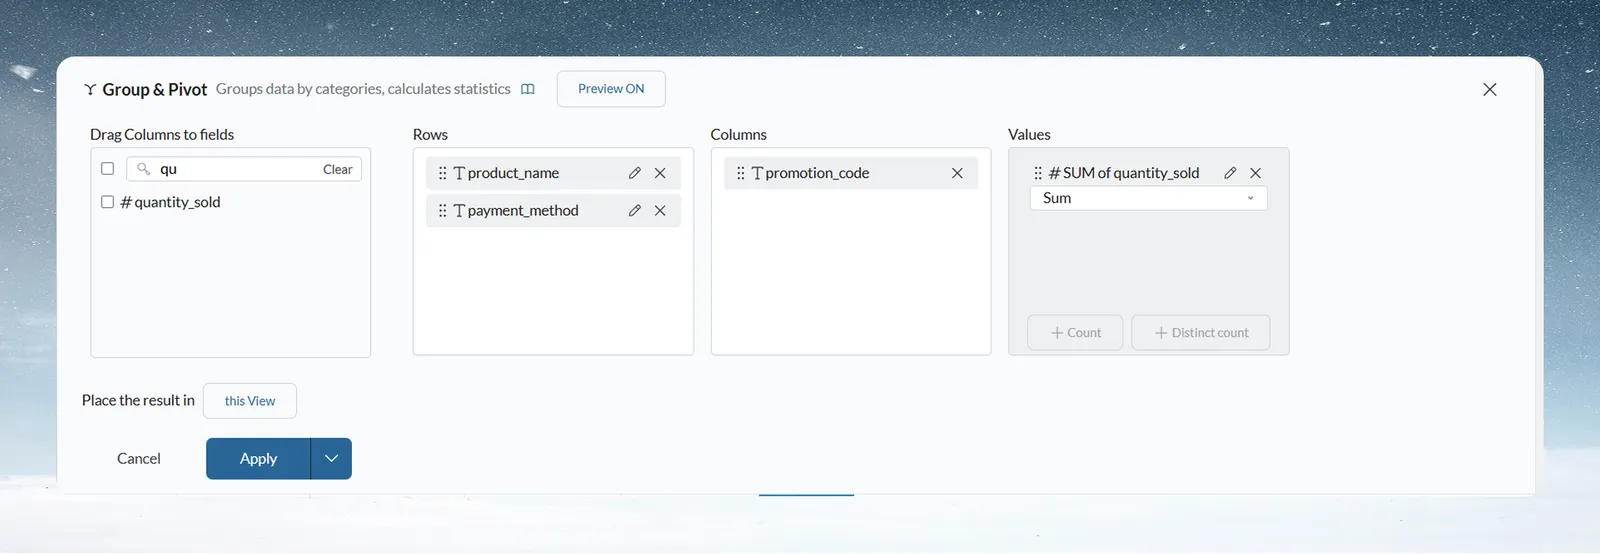
How to configure:
Drag columns from the list on the left into the three fields:
- Rows—the columns you want to group by. Each unique combination of values in these columns becomes one row in the result.
- Columns—a column whose unique values become separate column headers. This is what creates pivot output. Leave this empty if you want a grouped summary without pivoting.
- Values—the numeric columns to calculate. Choose an aggregation for each: Sum, Average, Min, Max, or Standard Deviation. Use + Count to add a row count, or + Distinct count to count distinct values; + Distinct count is available only while the Columns field is empty.
Preview—the preview is on by default. Use the Preview ON / Preview OFF toggle in the panel header to hide or show it.
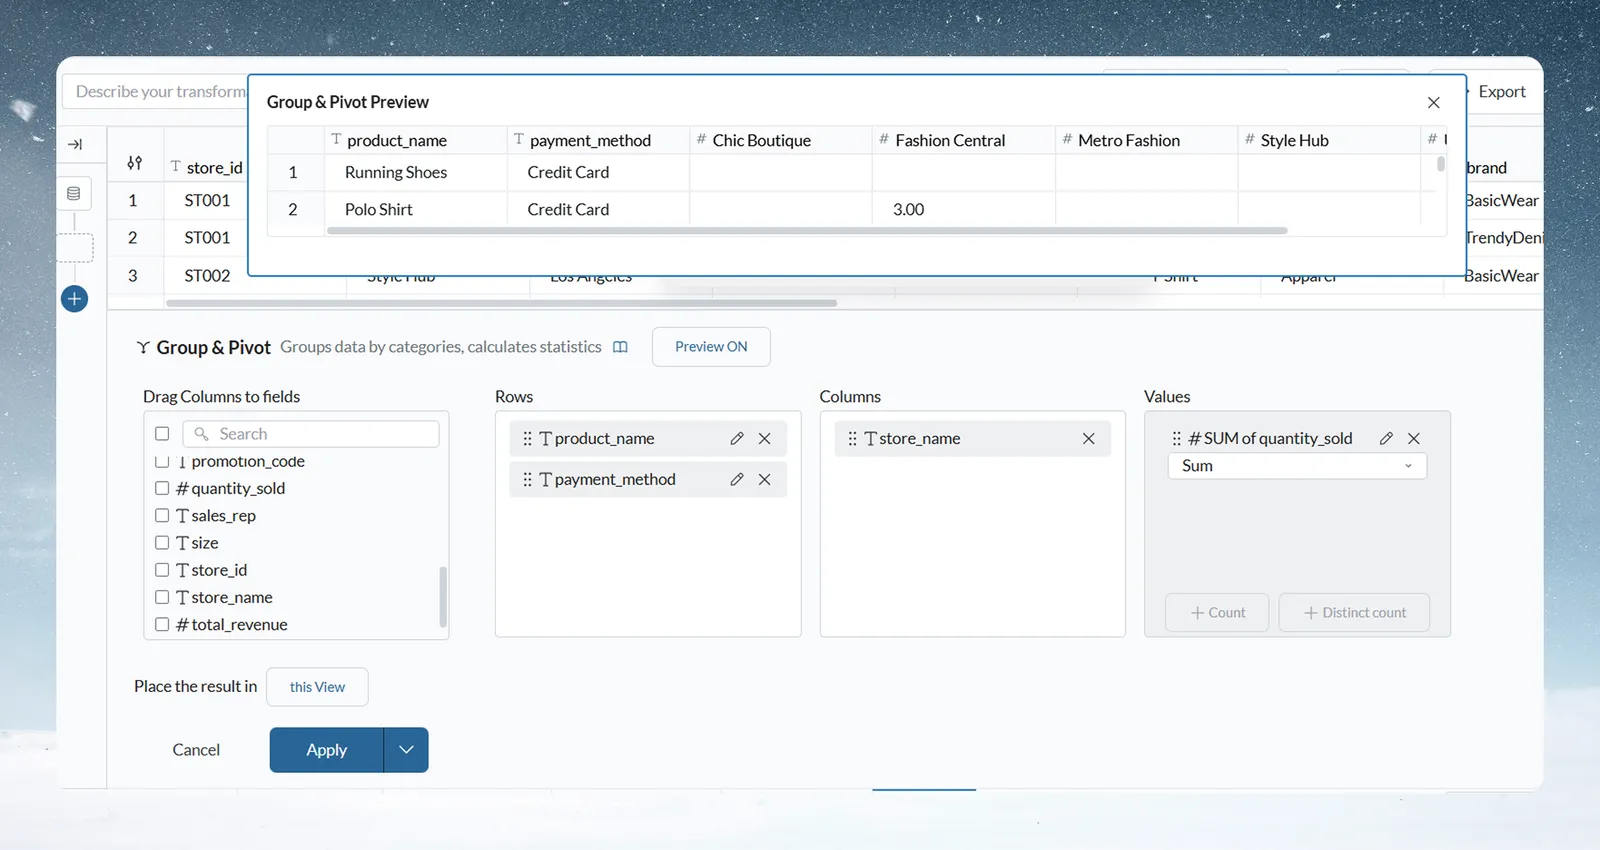
Where the result goes—by default the result stays in the current View. To send the output to a separate dataset instead, change Place the result in to New Dataset and give it a name.
Unpivot
Unpivot converts a wide table into a long table by rotating column headers into row values.
Use this when your source data has a separate column for each time period or category—for example, Jan_Sales, Feb_Sales, Mar_Sales as three separate columns—and you need a normalized format with a single Month column and a single Sales column instead. Normalized format is required for most grouping, joining, and analysis operations.
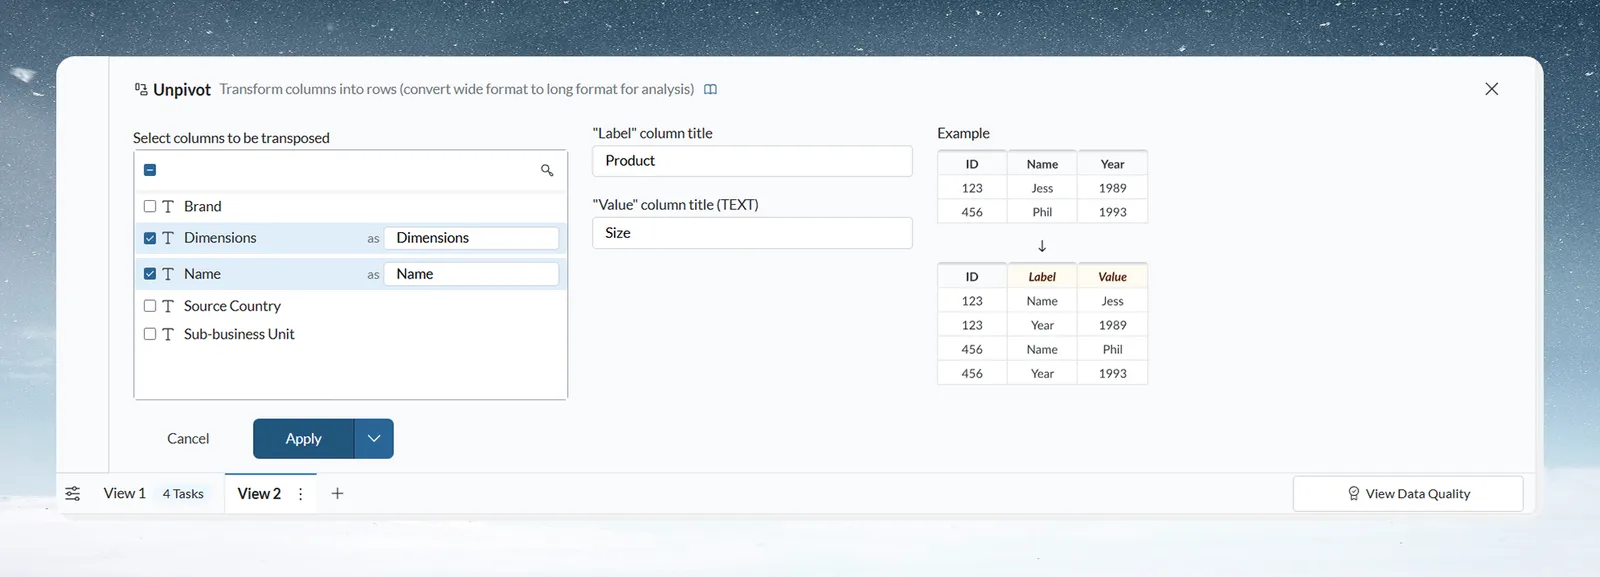
How to configure:
Under Select columns to be transposed, choose the columns you want to rotate into rows. Once you pick a column, only columns of the same type are offered. Name the "Label" column—this will contain the original column headers as values. Name the "Value" column—this will contain the original cell values. All other columns in the dataset are preserved and repeated for each rotated row.