Getting started as a technical user
This guide is for data engineers, BI developers, and analytics engineers who field frequent data requests from business users. It shows how to encode your logic as visual pipelines and templates that business users can run without writing code. Start with the technical assessment, then enable your first team member.
Who this guide is for
This path suits technical users who want to:
- Enable stakeholders to handle routine transformations independently
- Scale your expertise through reusable templates
- Spend less time on routine stakeholder support
- Maintain control through standardized processes and checkpoint approvals in pipelines
- Build reusable template libraries for consistent team execution
Goals by timeframe
Week 1: First team member enabled, template library started, advanced features validated
Month 1: Several team members handling routine requests on their own
Month 3: A standardized template library in regular use
The aim is to remove the repetitive requests that don't need your expertise, not all requests.
Technical assessment
Before investing in team enablement, validate that Mammoth meets your technical requirements.
Test 1: Run an advanced SQL query
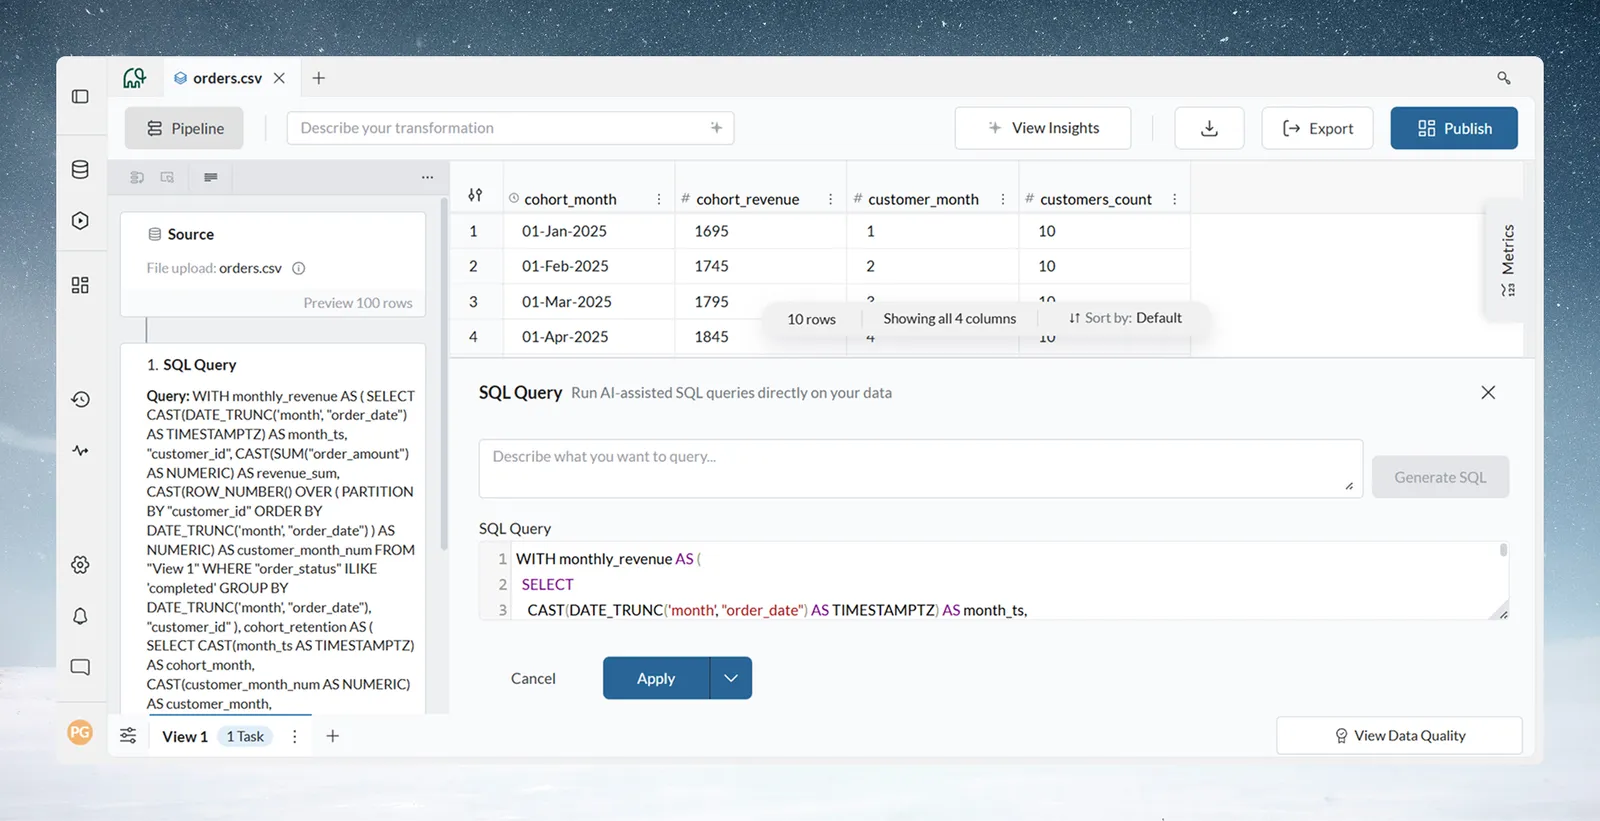
The AI SQL Query function runs SQL queries directly on your data. Try an analytical query like this one, adapting the view and column names to your data:
-- Your Test: Complex analytical query
WITH monthly_revenue AS (
  SELECT
    CAST(DATE_TRUNC('month', "order_date") AS TIMESTAMPTZ) AS month_ts,
    "customer_id",
    CAST(SUM("order_amount") AS NUMERIC) AS revenue_sum,
    CAST(ROW_NUMBER() OVER (
      PARTITION BY "customer_id"
      ORDER BY DATE_TRUNC('month', "order_date")
    ) AS NUMERIC) AS customer_month_num
  FROM "View 1"
  WHERE "order_status" ILIKE 'completed'
  GROUP BY DATE_TRUNC('month', "order_date"), "customer_id"
),
cohort_retention AS (
  SELECT
    CAST(month_ts AS TIMESTAMPTZ) AS cohort_month,
    CAST(customer_month_num AS NUMERIC) AS customer_month,
    CAST(COUNT(DISTINCT "customer_id") AS NUMERIC) AS customers_count,
    CAST(SUM(revenue_sum) AS NUMERIC) AS cohort_revenue
  FROM monthly_revenue
  GROUP BY month_ts, customer_month_num
)
SELECT * FROM cohort_retention
ORDER BY cohort_month, customer_month
Expected result: If the query runs successfully, the function covers your analytical requirements.
Test 2: Check large dataset handling
Prerequisite: A dataset with 100K+ rows.
- Upload a dataset with 100K+ rows
- Build a 5-task pipeline (Filter → Join → Group & Pivot → Calculate → Sort)
- Execute and observe responsiveness
Expected result: The pipeline executes without errors and the data grid stays responsive.
Week 1: Enable your first team member
Teach a team member to do the work instead of doing it yourself.
Select your first enablement target
Choose based on these criteria:
- High request volume: The person who asks you for help most often
- Strong motivation: Someone eager to learn and reduce their dependency
- Representative work: Their requests reflect common team patterns
- Excel proficiency: They understand data concepts, just lack transformation tools
Example: Sarah from Finance asks you monthly for performance reports by region. She knows Excel well and has asked if she could "learn to do this herself."
Create your first template
Turn a recurring request into a reusable template:
Step 1: Build the reference pipeline
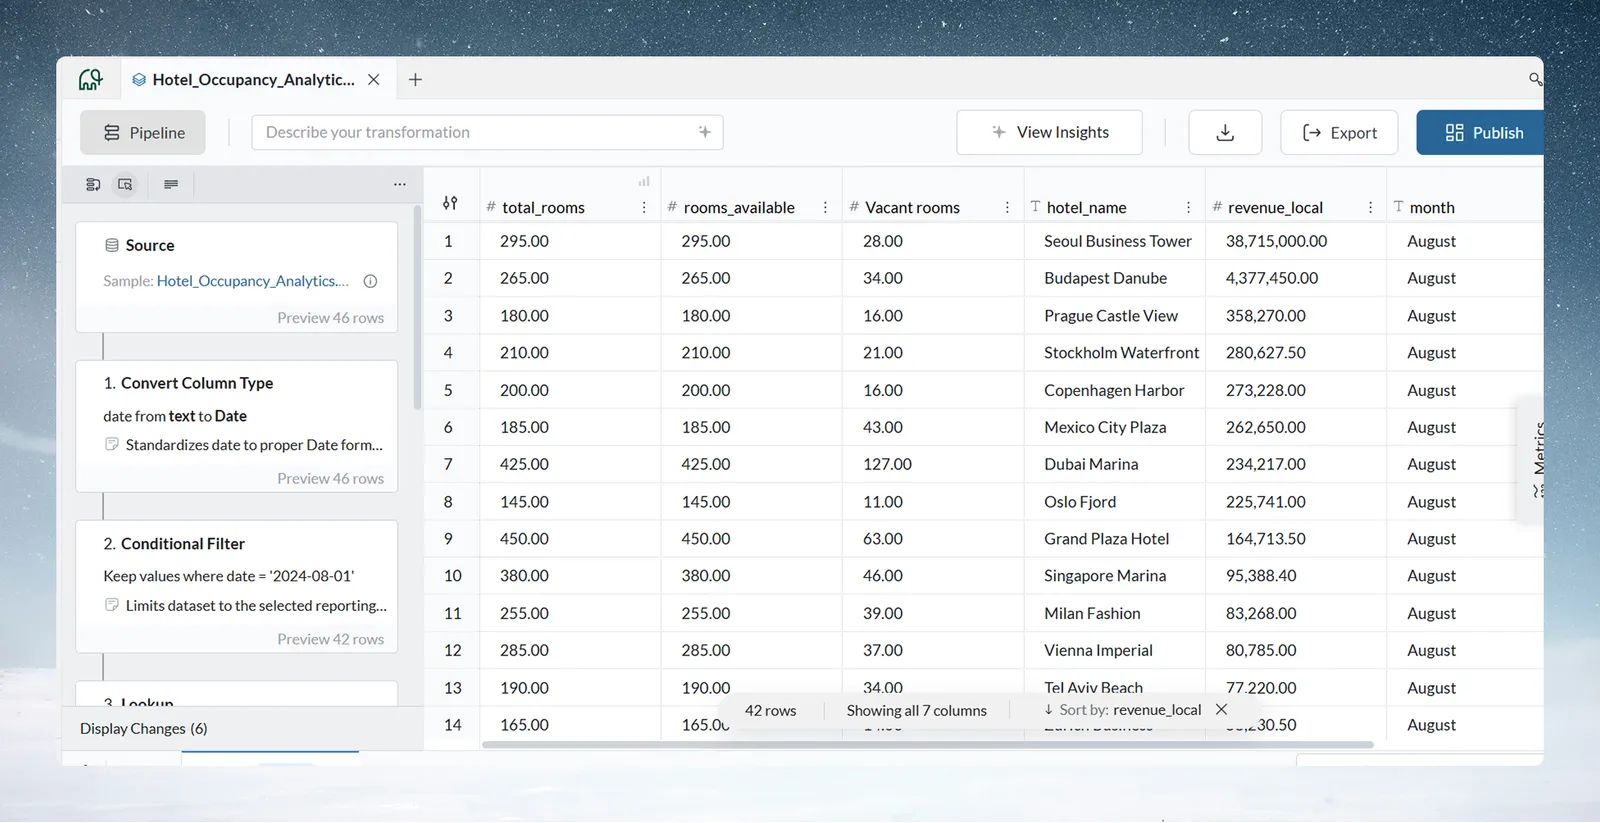
Using Sarah’s monthly performance report, adapted for Hotel Occupancy:
-
Connect to hotel occupancy dataset (File Connection)
-
Convert
datefrom text to Date (monthly reporting control) -
Filter for reporting month (
2024-08-01) -
Lookup enrichment (region → hotel_id) for dimensional reporting
-
Apply Math function :
Vacant rooms = total_rooms - rooms_occupied -
Group & Pivot to structure the monthly performance view (COUNT aggregation)
-
Sort by revenue descending
Step 2: Document each transformation
Add a note (Add note in a task's menu) to pipeline tasks explaining:
- What the transformation does
- Why it's needed (business logic)
- When to modify parameters (e.g., "change month filter here")
Step 3: Save as a template
Use Save as template in the pipeline's versions menu and name it clearly: Template: Hotel Occupancy Monthly Performance
You can also use Copy pipeline or Copy tasks to reuse tasks in another view.
Train your team member
Session structure:
-
Walk through the template
- Explain each transformation
- Show the business logic
- Demonstrate how to read the results
-
Guided practice
- "Now you change the month filter to last quarter"
- Watch them execute the modification
- Validate the output together
-
Independent verification
- "Run this yourself without me watching"
- Check for understanding, not perfection
- Answer questions as they arise
Success criteria: They can run the template independently and explain what each task does.
Advanced transformations for technical users
Beyond the point-and-click interface, Mammoth supports complex analytical workflows.
1. SQL Query with AI assistance
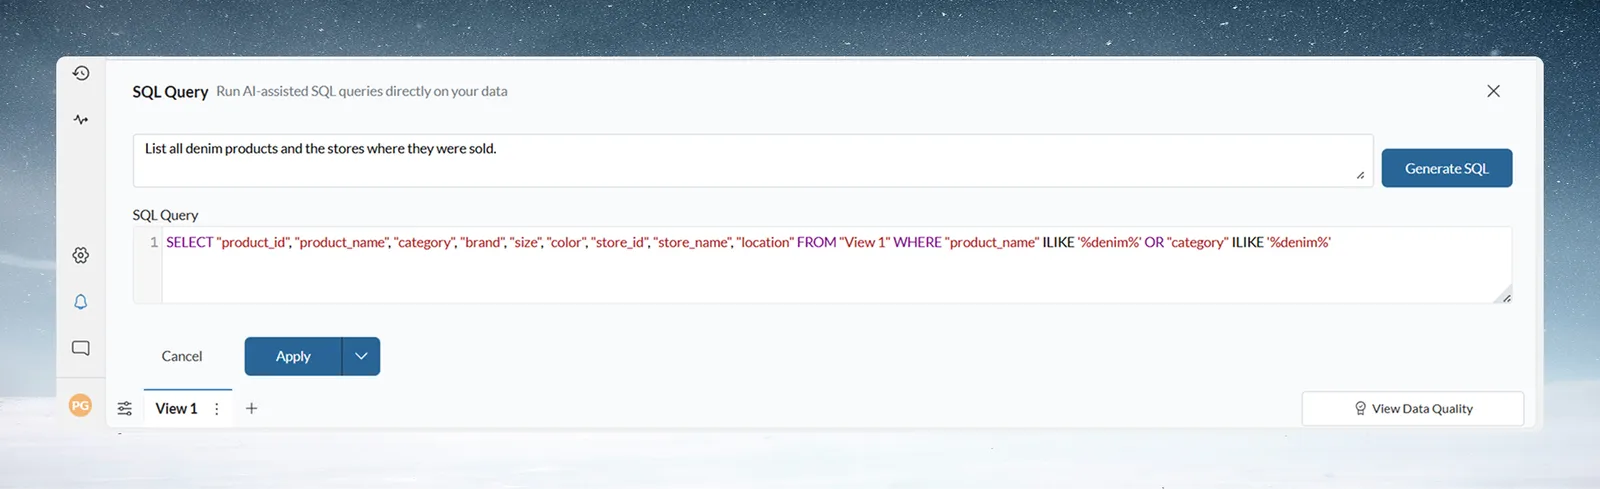
The SQL Query function runs SQL directly on your data, with optional AI-assisted query generation.
Write SQL directly, or describe your intent in the Prompt field, click Generate SQL, and let AI draft the query. Review and test generated queries before applying them.
-- Use Case: Complex analytical queries beyond UI functions
SELECT
    c.segment,
    DATE_TRUNC('quarter', o.order_date) AS quarter,
    COUNT(DISTINCT o.customer_id) AS active_customers,
    SUM(o.revenue) AS total_revenue,
    AVG(o.order_value) AS avg_order_value,
    PERCENTILE_CONT(0.5) WITHIN GROUP (
        ORDER BY o.order_value
    ) AS median_order
FROM orders o
JOIN customers c ON o.customer_id = c.id
WHERE o.order_status = 'completed'
GROUP BY 1, 2
HAVING SUM(o.revenue) > 10000
ORDER BY quarter DESC, total_revenue DESC;
AI capabilities:
-
Generate SQL from natural language prompts
-
Accelerate query drafting and iteration
-
Assist with joins, aggregations, window functions, and filters
When to use SQL Query
-
Complex joins and aggregations
-
Advanced analytical functions
-
Ad-hoc analysis
Best for: Users who want complete flexibility.
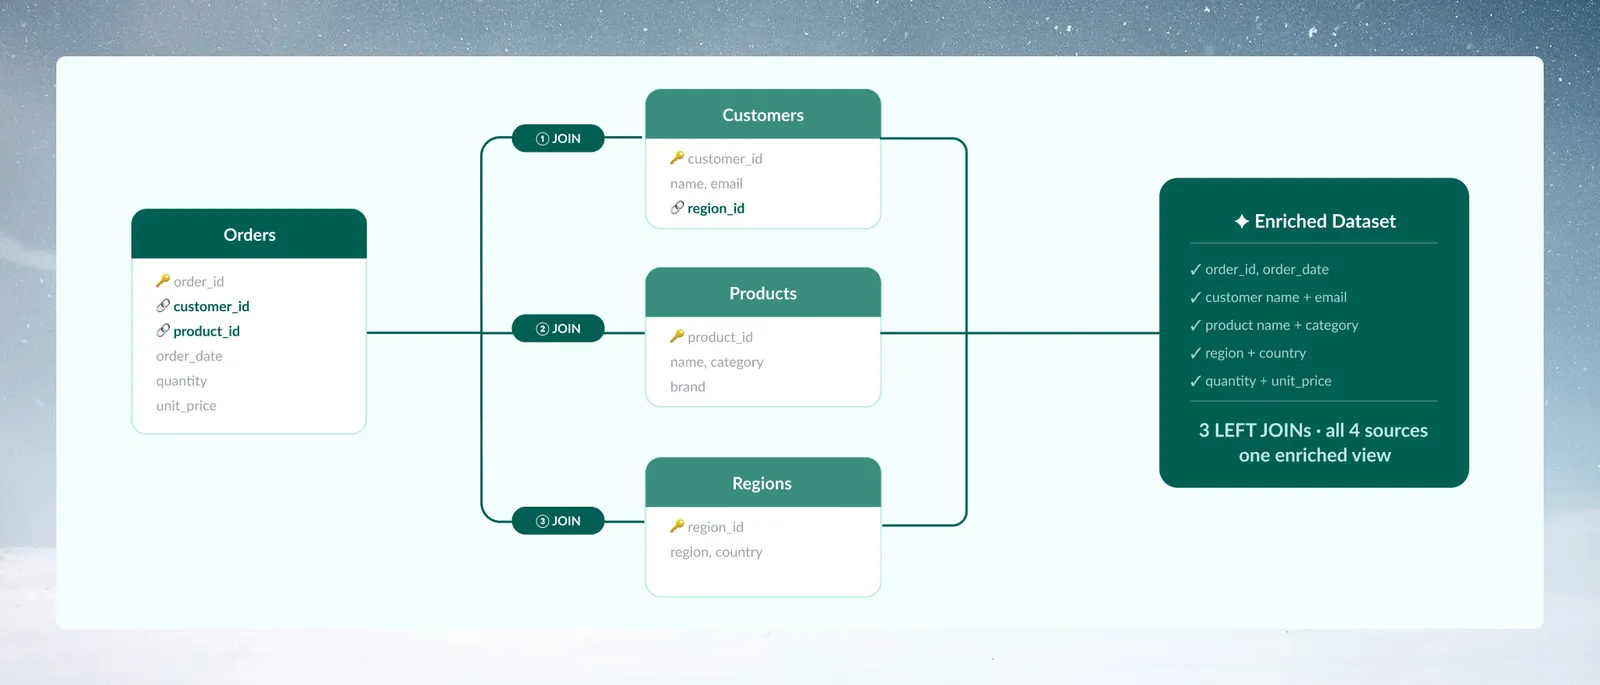
2. Advanced join patterns
Scenario: Multi-table consolidation across 4 or more data sources
Pipeline approach:
-
Join Orders → Customers (left join on customer_id)
-
Join Result → Products (left join on product_id)
-
Join Result → Regions (left join on customer.region_id)
Result: An enriched dataset with all dimensions
SQL approach:
3 nested joins in one query
Choose based on reusability (pipeline) or one-time analysis (SQL).
3. Window function: pipeline-based analytics
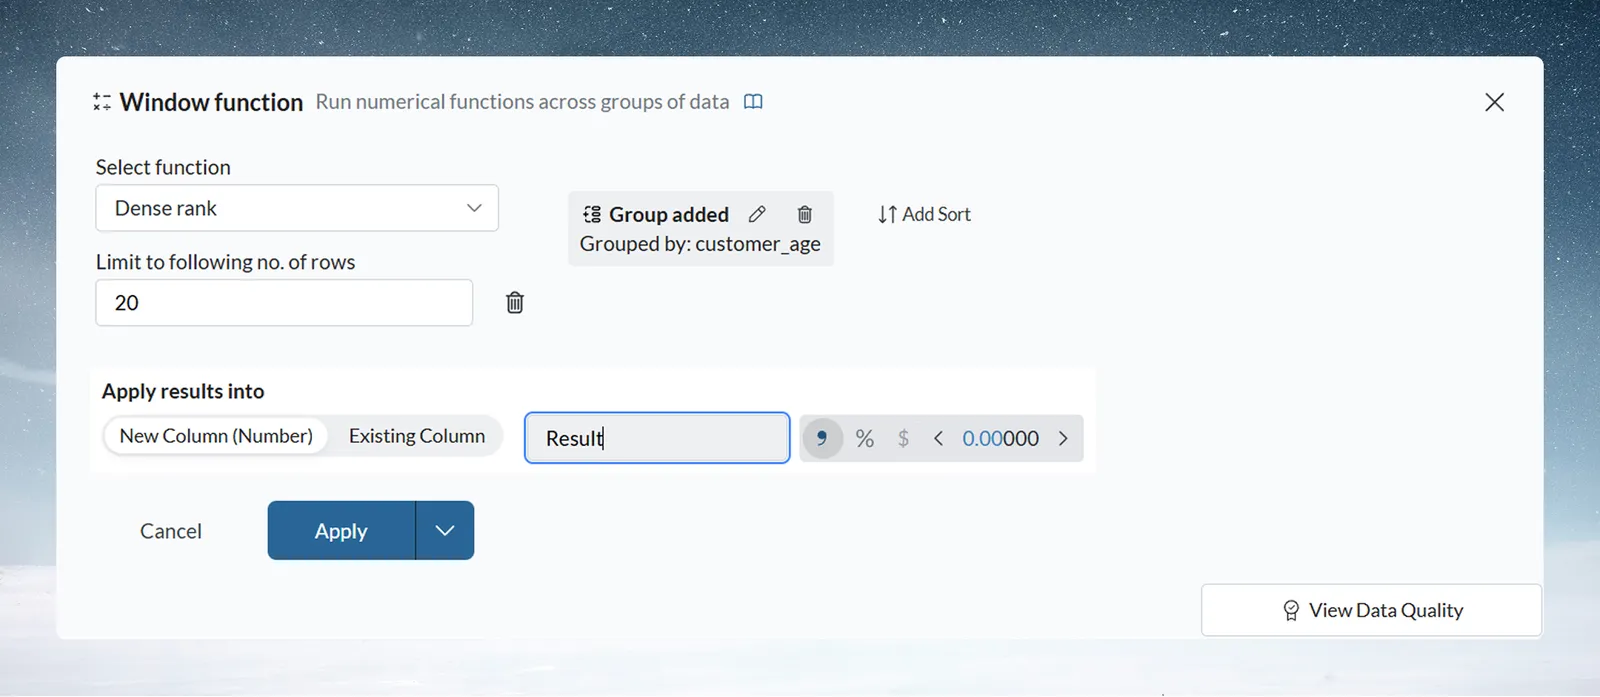
Apply ranking, trend, and moving calculations directly within the transformation pipeline, without writing SQL.
The Window function transformation lets you:
-
Select function (Row Number, Dense Rank, etc.)
-
Define Group By (partition logic)
-
Define Sort (ordering logic)
-
Apply results into a new or existing column
This creates modular, visible analytical tasks inside the pipeline.
Example: Ranking within groups
-- Equivalent SQL logic
ROW_NUMBER() OVER (
    PARTITION BY customer_id
    ORDER BY order_date
)
Example: Moving average
AVG(order_value) OVER (
    PARTITION BY customer_id
    ORDER BY order_date
    ROWS BETWEEN 2 PRECEDING AND CURRENT ROW
)
When to use Window function
-
Clear, task-by-task ranking logic
-
Repeatable workflows
-
Easier collaboration and review
Best for: Structured analytical workflows where visibility and maintainability matter.
4. Automations for end-to-end workflows
Automations can run a workflow from data refresh through transformation to delivery.
Nightly data pipeline example
Step 1: Create a Dataset Refresh automation
- Schedule: for example, nightly
- Source: Database via Live Connection (Salesforce, PostgreSQL, etc.)
Step 2: Add a pipeline to the Dataset
- Transformation tasks execute automatically after each refresh
- Example tasks: Filter → Join → Group & Pivot → Calculate
- Pipeline runs without manual intervention
Step 3: Configure export destinations
- Send transformed data to PostgreSQL, BigQuery, or other destinations
Step 4 (optional): Deliver by email
- A Messaging automation emails a view on a schedule
- CSV attachments are limited to 100,000 rows in total across all attached views (see limits and quotas)
Expected result: A data pipeline that runs without manual intervention.
For large datasets, use Draft Mode to batch your changes. Filter early in your pipeline to reduce data volume for subsequent transformations.
Building your template library
Templates scale your expertise across the organization.
High-value templates to create
1. Retail transactions report
Template: Store_Transactions_Analysis
Transformations (10 tasks):
- Filter to relevant departments and categories
- Calculate derived metrics (e.g. Total Value from Quantity and Price)
- Standardize categorical values using Bulk Replace
- Adjust and enrich date columns
- Extract date parts for time-based segmentation (e.g. Quarter)
- Normalize text fields to consistent casing
- Limit dataset scope before aggregation
- Apply conditional labels based on business rules
- Aggregate by key dimensions using Group & Pivot
- Rank records using Window Function for prioritization reporting
Dataset: Point-of-sale transaction data
Output: Aggregated, ranked, and enriched dataset ready for reporting
Advanced use cases
Scenario 1: Multi-source data consolidation
Problem: Several regional databases and SaaS tools need unified reporting
Solution:
- A Live Connection for each regional database
- Connectors for the SaaS tools (for example, Salesforce)
- Consolidation pipeline (standardize schemas across sources)
- Master dataset (single source of truth)
- Automated nightly refresh via an automation
Result: An executive dashboard with data from all sources
Team impact: Business users create their own analysis Views from the master dataset
Scenario 2: Customer 360 view
Problem: Customer data fragmented across several systems
Solution:
- Join pipeline combining the data sources
- Remove Duplicate Rows for unified customer records
- Scheduled refresh maintaining current state
Result: A single customer master dataset
Team impact: The sales team creates its own customer insights
Beyond month 1
Months 2 to 3: advanced patterns
- Custom transformation workflows for complex business logic
- Automation that runs related Dataset Refreshes in a sequence
- Performance optimization for large datasets
Months 4 to 6: organizational impact
- Best practices documentation
- Governance through project roles and pipeline checkpoints that pause for approval
- Internal training for new team members
Next steps
- Complete technical validation
- Identify your first team member to enable
- Create your first template
- Conduct a training session
- Monitor and support with regular check-ins
Related guides: Quick start, Core concepts, and Getting started as a manager.