Data quality issues
Mammoth can analyze a View and report quality issues before they affect your analysis. This guide explains how to interpret quality scores, understand what's wrong with your data, and apply the right fixes using Mammoth's built-in pipeline tools.
How Mammoth measures data quality
Mammoth uses the DAMA six-dimension quality framework to score your data across six dimensions. Each dimension is scored from 0–100%, and the overall quality score is a weighted average of the six.
| Dimension | Weight | What it measures |
|---|---|---|
| Validity | 25% | Share of columns without unexpected negative values, unexpected zeros, or future dates |
| Uniqueness | 25% | Share of identifier columns whose values are unique |
| Completeness | 20% | Share of columns without missing values |
| Consistency | 15% | Share of text columns without case variants of the same value (such as Active, ACTIVE, active) |
| Accuracy | 10% | Share of numeric columns without outliers |
| Timeliness | 5% | How recent the newest date is compared with how fresh the data is expected to be |
Dimensions are scored per column, not per row, so one problem column lowers a dimension's score by a share of the columns checked.
Quality score thresholds
| Score | Label | Meaning |
|---|---|---|
| 95–100% | Excellent | Data is ready for analysis and reporting |
| 80–94% | Good | Minor issues present; suitable for most analysis with awareness |
| 60–79% | Fair | Meaningful issues that may affect analysis accuracy; review recommended |
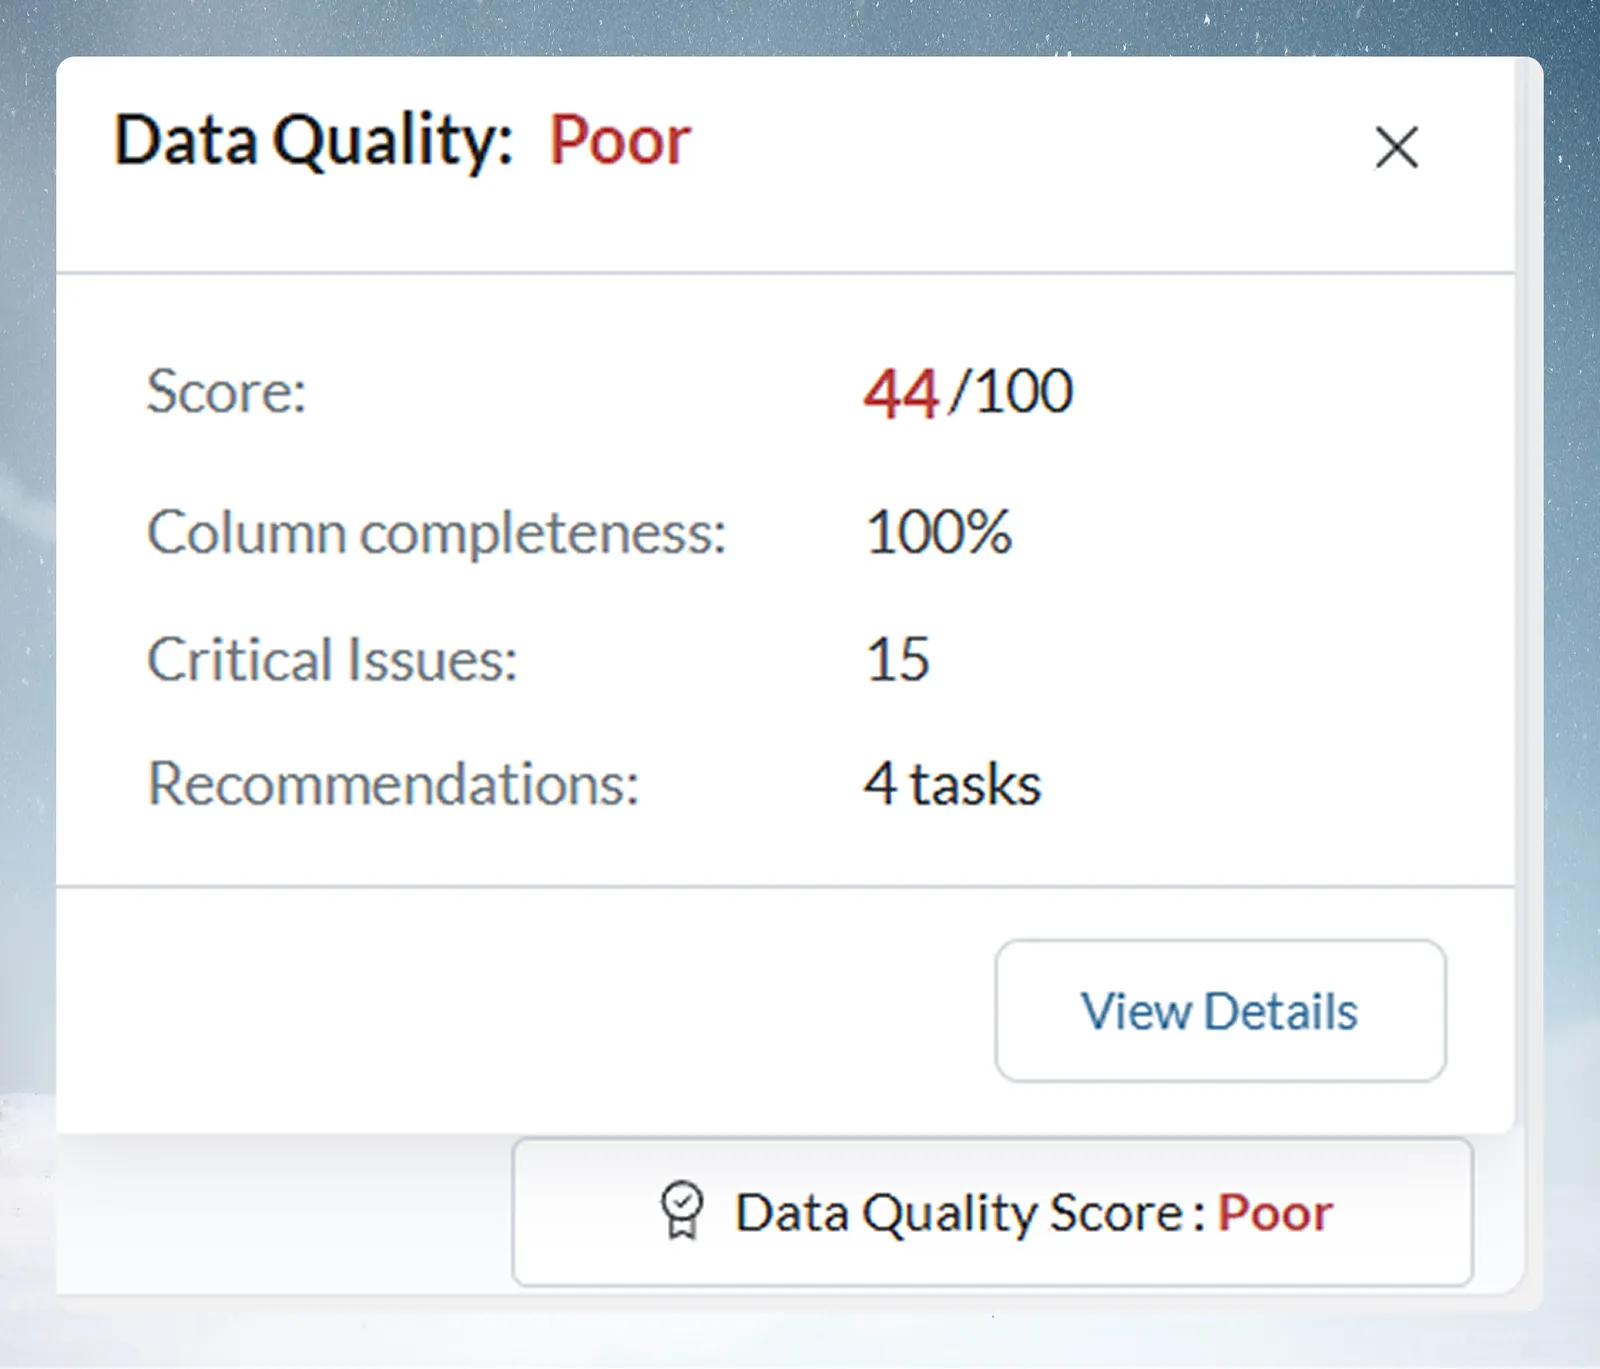
| Below 60% | Poor | Significant issues; analysis results may be unreliable |
Viewing the data quality report
- Open a View
- Click View Data Quality to run the analysis
- The report opens with these sections:
- Overview—the Data Quality Score, the score for each dimension, and column completeness
- Issues and Monitoring—the issues found, which columns are affected, and how each was detected
- Improvement Actions—recommended fixes, each with an Add to Pipeline button (or Add all to Pipeline)
Fixing common data quality problems
Duplicate rows
Symptom: The Uniqueness dimension shows a low score, or you see repeated rows when browsing data.
Cause: Duplicates most commonly enter Mammoth data when:
- A source system exports the same records multiple times
- A scheduled refresh runs more than once before deduplication
- Multiple source files are combined without deduplication
Fix in Mammoth pipeline:
- Add a Remove Duplicate Rows step after your data source
- Under Evaluate duplicates from, choose which columns decide whether two rows are duplicates (e.g., transaction ID, or customer ID + date)
- Apply the step—check the row count before and after to confirm duplicates were removed
Missing values (nulls)
Symptom: The Completeness dimension shows a low score. Issues and Monitoring lists the columns with missing values.
Cause: Null values typically come from:
- Source system records with optional fields left empty
- Join operations where the right-side record has no match (left join nulls)
- Import errors where certain cells were skipped
Fix options:
| Strategy | When to use | Pipeline step |
|---|---|---|
| Replace nulls with a default value | Numeric fields where 0 is meaningful; text fields where a placeholder is acceptable | Fill Missing Values—choose the column and how to fill it |
| Remove rows with nulls | Analysis requires complete records; null rows are not meaningful | Conditional Filter—keep only rows where each critical column has a value |
| Leave nulls in place | Null genuinely means "not applicable" for this record | No action needed; document the null semantics in the dataset description |
Best practice: Before removing null rows, check what percentage of your data they represent. If more than 5–10% of rows would be removed, investigate the source system first—high null rates often indicate a data collection problem, not a Mammoth problem.
Data type mismatches
Symptom: Date columns show as text, or numeric columns contain strings, so sorting, filtering, and calculations behave unexpectedly.
Cause: Type mismatches occur when source data doesn't match the expected format:
- Dates formatted as text (e.g.,
"January 15, 2024"instead of2024-01-15) - Numeric fields with currency symbols or commas (e.g.,
"$1,250.00") - Boolean fields imported as
"Yes"/"No"strings instead of true/false
Fix in Mammoth pipeline:
- Add a Convert Column Type step
- Select the column with the type mismatch
- Choose the target type
- For dates, specify the format the text is written in
- For numeric columns with currency symbols: first add a Find & Replace step to strip the non-numeric characters, then convert
Outliers
Symptom: The Accuracy dimension flags outliers in numeric columns. Aggregate analysis shows averages distorted by extreme values.
Accuracy never drops below 60%, because outliers need a person who knows the data to judge them.
Cause: Outliers can be legitimate extreme values (a very large transaction) or data errors (a row with 99999 entered as a placeholder for missing data).
Fix options:
| Strategy | When to use | Pipeline step |
|---|---|---|
| Remove outlier rows | Values are data entry errors or test data | Conditional Filter—keep rows where the column is below an upper bound (investigate to determine the appropriate threshold) |
| Cap outlier values | Extreme values are real but should be limited for analysis | Add Column with a Math Function—cap values at a limit you choose |
| Flag and retain | Outliers are real and meaningful but should be marked | Add Column with a Conditional Filter or Math Function to build a flag column, or keep the rows and filter in the dashboard |
Before removing outliers: Review the actual values to determine whether they are errors or genuine extremes. Removing valid outliers can make analysis misleading. Consult your data owner before discarding records.
Inconsistent formatting
Symptom: The Consistency dimension shows issues. Category columns have case variants of the same value (e.g., Active, ACTIVE, active). Other columns have variations such as "US", "USA", "United States".
Fix in Mammoth pipeline:
- Standardize text case: Add a Text Formatting step and use Change text case—choose lower case, Capital Case, or UPPER CASE to normalize the column
- Standardize category values: Add a Find & Replace step—replace
"USA"and"United States"with"US"(repeat for each variant) - Clean up whitespace: Add a Text Formatting step with Normalize whitespace to remove extra spaces that cause values to not match
Quality score is low but I don't know why
If your quality score is below 80% and the dimension breakdown isn't immediately clear:
- Open Overview and find the lowest-scoring dimension
- Open Issues and Monitoring to see which columns are affected and how each issue was detected
- Check the affected columns in your data to see examples of the issue
- Open Improvement Actions for recommended fixes, and use Add to Pipeline to apply one
Applying multiple fixes
For datasets with multiple quality issues, apply fixes in this order for best results:
- Type fixes first—fix type mismatches before anything else; many other issues (null counts, outlier detection) depend on the correct type being set
- Deduplication second—remove duplicates before filling nulls, so you don't create artificial completeness
- Null handling third—once duplicates are removed, assess which nulls to fill vs. remove
- Value standardization last—clean up formatting and category values after the structural issues are resolved
Review the Data Quality report again after each group of fixes to confirm scores are improving.
Still not resolved?
If data quality issues persist after applying fixes, or if the Data Quality Report shows issues you can't trace to the source:
- Download a sample of the raw source data and compare it directly to what Mammoth imported
- Check whether a recent pipeline change introduced the issue (review the pipeline steps)
- Contact support@mammoth.io with your workspace name, dataset name, and a description of the specific quality issue