Numeric column cards
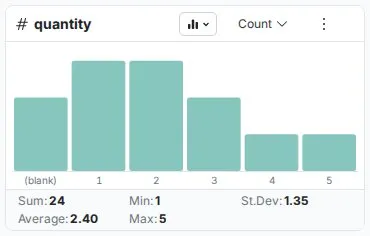
Numeric column cards are Explore Cards that show a bar chart with automatic range grouping and a five-statistic summary. They reveal distribution shape, outliers, and data quality issues. Add a numeric column to the Explore panel to see one.
What numeric Explore Cards show
Vertical bar chart layout
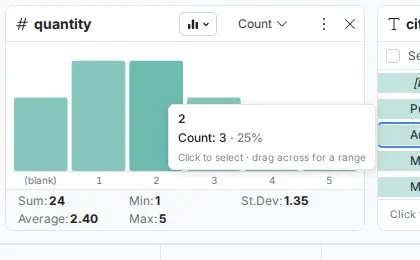
Numeric columns display as vertical bar charts where each bar represents a range of values and its height shows how many records fall within that range.
- Bars extend upward, height proportional to frequency
- Range labels sit on the X axis below each bar (e.g., "100 to 200", "200 to 300")
- Blank values appear as a
(blank)entry - Hover any bar to see a tooltip showing the exact range, its count and its share of the rows, e.g. "100 to 200", with the hint "Click to select, drag across for a range"
- Statistical summary below the chart
Five essential statistics
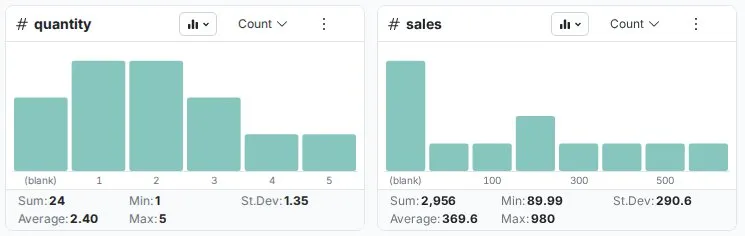
Below each chart, five statistics are calculated automatically:
| Statistic | What it tells you |
|---|---|
| Sum | Total of all values—useful for revenue, quantities, weights |
| Average | Arithmetic mean—your "typical" value |
| Min | Smallest value in the column |
| Max | Largest value in the column |
| St.Dev | Standard deviation—high means wide spread, low means consistent values |

Columns view and list view
Numeric Explore Cards have two views, which you switch with the chart type dropdown in the card header:
- Columns—the default vertical bar chart, best for seeing distribution shape
- List—shows the same ranges as a list, useful for reading exact counts per range
Card controls
Numeric Explore Cards have these controls: the aggregation menu in the card header, the chart type dropdown, the More options menu (⋮), and, in list view, Search values and Sort by above the list.
Show values by and granularity
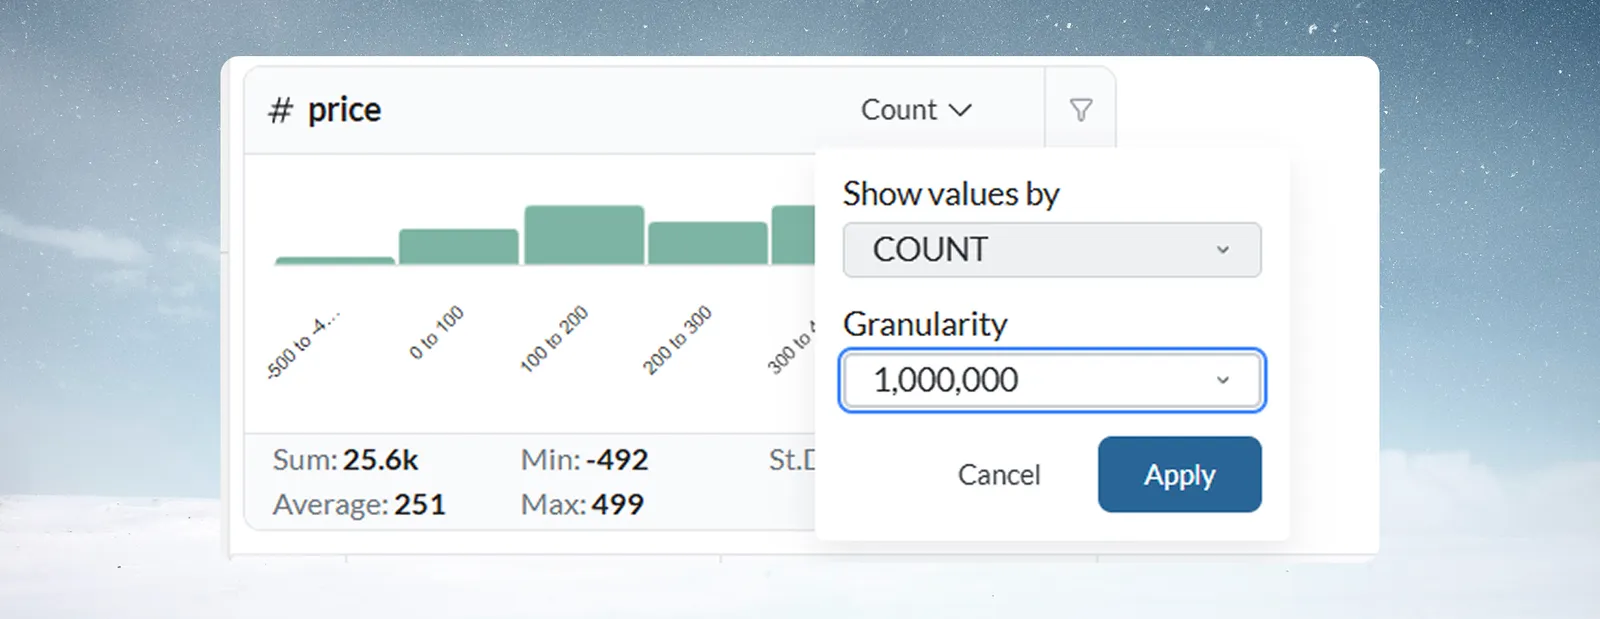
Clicking the aggregation menu in the card header (it reads Count by default) opens a panel with two settings that are applied together:
Show values by—controls what the card measures for each range. By default it shows COUNT (number of rows), but you can switch to the aggregation of any numeric column in your dataset—for example Sum of revenue or Average of order value. Supported functions:
| Function | What it shows |
|---|---|
| COUNT | Number of rows per range (default) |
| SUM | Total of the selected numeric column per range |
| AVG | Average of the selected numeric column per range |
| MIN | Smallest value of the selected numeric column per range |
| MAX | Largest value of the selected numeric column per range |
| STDDEV | Standard deviation of the selected numeric column per range |
| DISTINCT_COUNT | Number of distinct values of the selected column per range |
Granularity—controls the range size used for grouping. The current granularity is shown in the dropdown (e.g., "100" means bars represent ranges of 100 units). You can change this to a finer or coarser grouping, in powers of ten.
Once you've set both options, click Apply to update the card, or Cancel to discard changes.
More options menu (⋮)
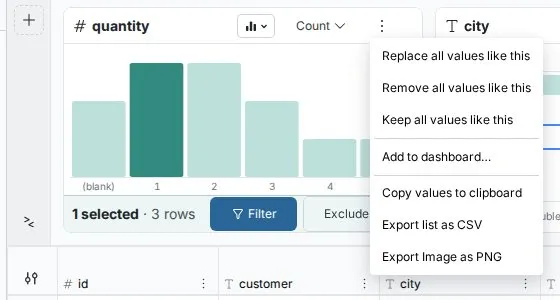
The More options button in the card header opens a menu. The first three actions appear only when you have selected one or more bars (or list rows) and you can edit the workspace. The full list is:
- Replace all values like this—opens Label & Insert Values with the selection filled in as the condition
- Remove all values like this—opens Conditional Filter set to remove records in the selected ranges
- Keep all values like this—opens Conditional Filter set to keep only records in the selected ranges
- Add to dashboard…—adds the card to a dashboard, when your role allows editing dashboards in the project
- Copy values to clipboard—copies the list of ranges and counts
- Export list as CSV—exports ranges and counts as a CSV file
- Export Image as PNG—exports the chart as a PNG image (chart views only), useful for reports and presentations
Search and sort
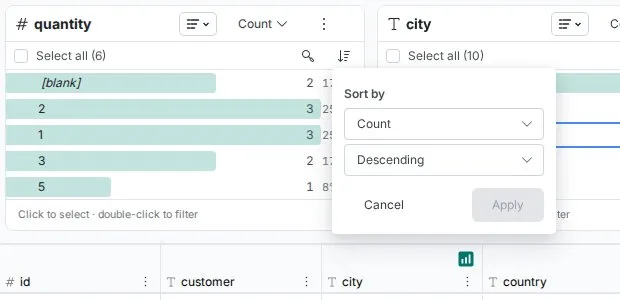
Search values—available above the list in list view, lets you find a specific range. Most useful when a column has many distinct ranges.
Sort by—available above the list in list view only. Choose what to sort by, then Ascending or Descending, and click Apply:
- The card's measure (Sum, Count, etc.)
- The column's values—numeric order
Automatic grouping
Mammoth automatically selects a grouping granularity based on your data range, so you don't need to configure bins.
Automatic granularity selection
Mammoth picks the bucket width on a logarithmic scale based on the column's range (max − min): one power of ten below the range's order of magnitude. The bucket width is always a power of ten, and it grows automatically as the range widens. A column where every value is the same gets 0.1-wide buckets, and ranges under about 1 get finer buckets still:
| Approximate data range | Auto bucket width | Example ranges | Typical use |
|---|---|---|---|
| ~1–3 | 0.1 | 0.0–0.1, 0.1–0.2 | Percentages, yield rates, ratios |
| ~3–32 | 1 | 0–1, 1–2, 2–3 | Small whole-number counts |
| ~32–316 | 10 | 0–10, 10–20, 20–30 | Ages, temperatures, small counts |
| ~316–3,162 | 100 | 0–100, 100–200 | Sales amounts, order quantities |
| ~3,162–31,623 | 1,000 | 0–1k, 1k–2k | Monthly revenue, transaction volumes |
| ~31,623–316,228 | 10,000 | 0–10k, 10k–20k | Annual revenue, enterprise metrics |
| ~316,228–3,162,277 | 100,000 | 0–100k, 100k–200k | Large enterprise/aggregate totals |
The pattern continues for larger ranges (each tenfold increase in range gives a tenfold wider bucket). The transition points are approximate because Mammoth rounds to the nearest power of ten.
You can override automatic selection at any time using the aggregation menu in the card header. When a filter reduces the data range, the automatic granularity is recalculated for the remaining rows.
Distribution patterns to recognize
Normal distribution
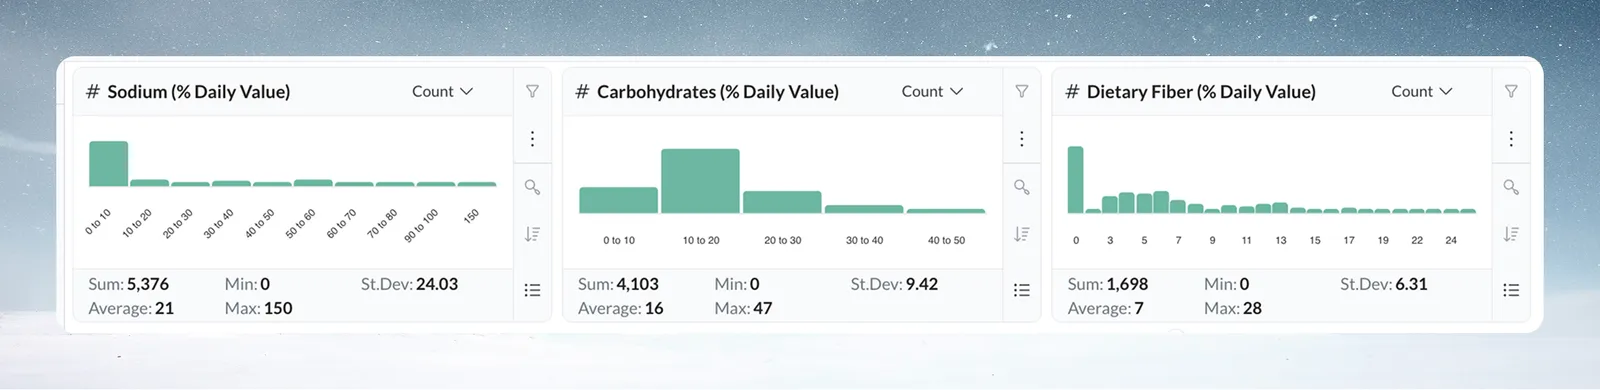
Most values cluster in the middle with fewer at the extremes. Tallest bars in the center, tapering toward the edges. Common in employee salaries, product weights, manufacturing measurements. An abrupt drop at either edge may indicate missing data rather than natural distribution.
Skewed distribution
Values concentrate heavily at one end with a long tail in the other direction. Common in customer transaction amounts (many small, few very large) and support ticket response times. The tail often contains values worth investigating.
Bimodal distribution
Two separate clusters of tall bars with a visible gap between them. Common in datasets mixing two distinct populations—for example SMB vs Enterprise deal sizes, or day-shift vs night-shift temperatures. Usually signals a segmentation opportunity.
Spotting data quality issues
Outlier detection
A bar far separated from the main distribution is the most common quality signal. For example, a price column where most values sit between $10 and $100 with one isolated bar at $10,000 likely indicates a data entry error or a special case needing validation.
To investigate, hover the outlier bar to see the exact count, then click it to select it and use Filter to examine those specific records.
Values outside expected business range
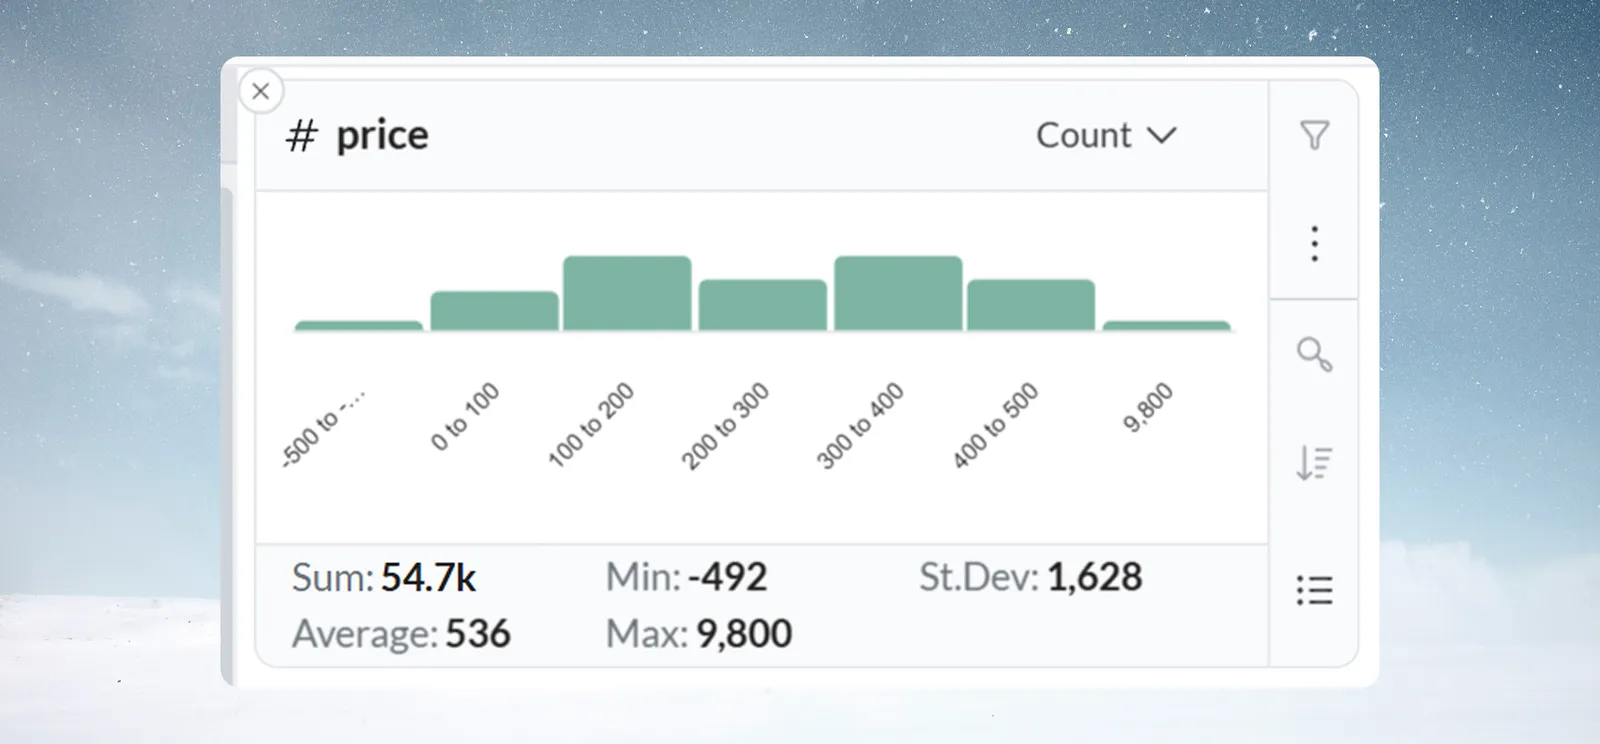
The card displays the full distribution of your data including negative values—the card itself does not flag any value as invalid. Whether a value falls outside an acceptable range is a business judgment, not something Mammoth determines automatically.
Examples of what to look for:
- Negative values in columns where they make no business sense (e.g., product prices, order quantities)
- Values far above a known maximum (e.g., ages above 120, percentages above 100)
- Large clusters at a single suspicious value (e.g., 999, -1, 0) which may indicate a system default or placeholder
For each case, hover the bar to confirm the count, then investigate those records before deciding whether to filter them out.
Default or placeholder values
An unusual spike where a large share of records share one identical value—particularly zero, 999, or -1—often indicates a system default being used in place of actual data. The distribution makes this immediately visible as a disproportionately tall single bar.
Real-world examples
Manufacturing quality control
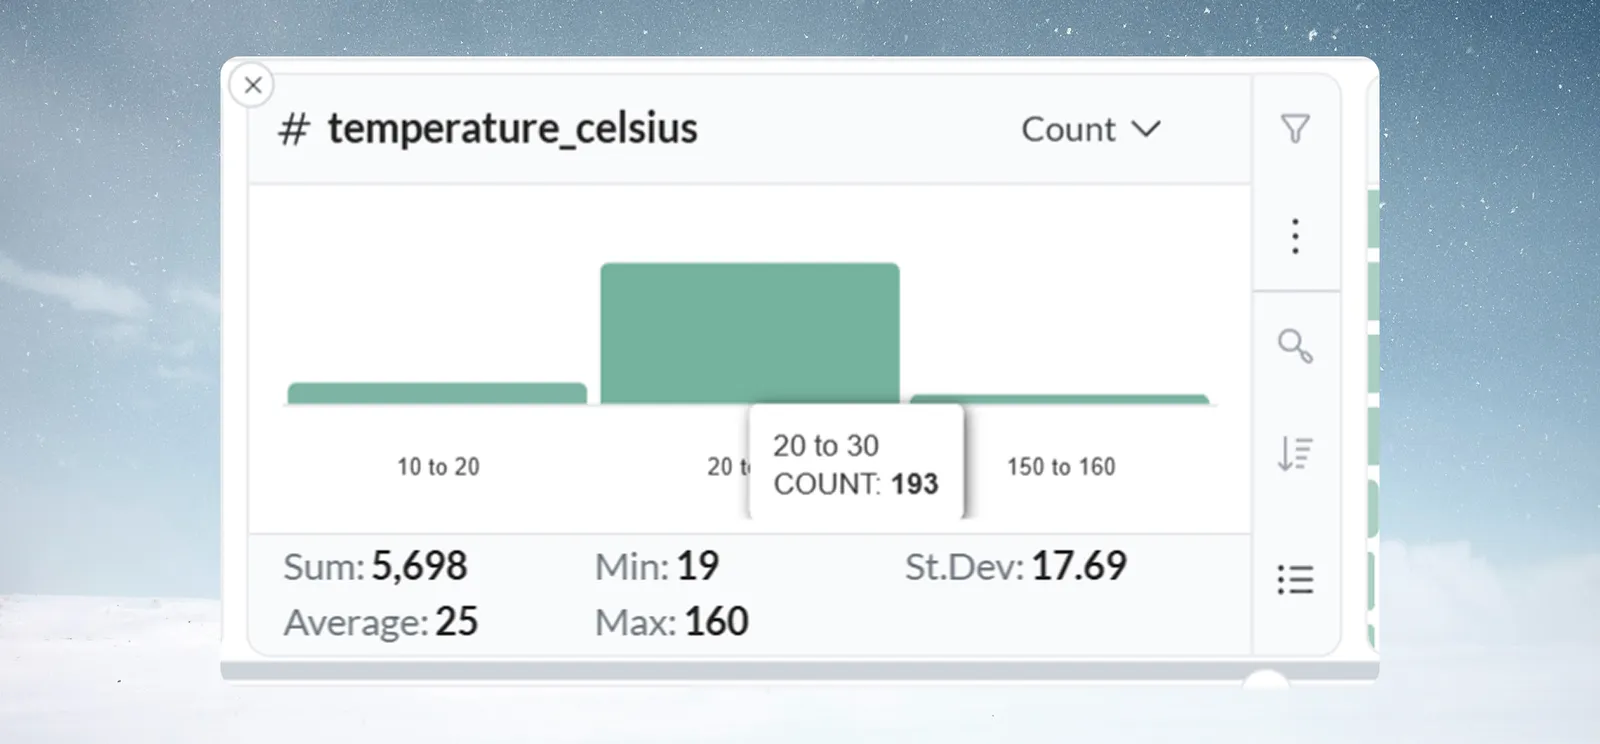
A production manager opens a View containing temperature sensor readings. The Explore Card shows a normal distribution centered at 22°C, with one isolated bar at 150–160°C.
Hovering the outlier bar shows COUNT: 3. Filtering to the bar reveals all three records are from the same batch. Investigation confirms a faulty sensor reporting furnace temperature instead of ambient. A Conditional Filter is added to the pipeline to flag readings above 50°C automatically.
Sales segmentation discovery
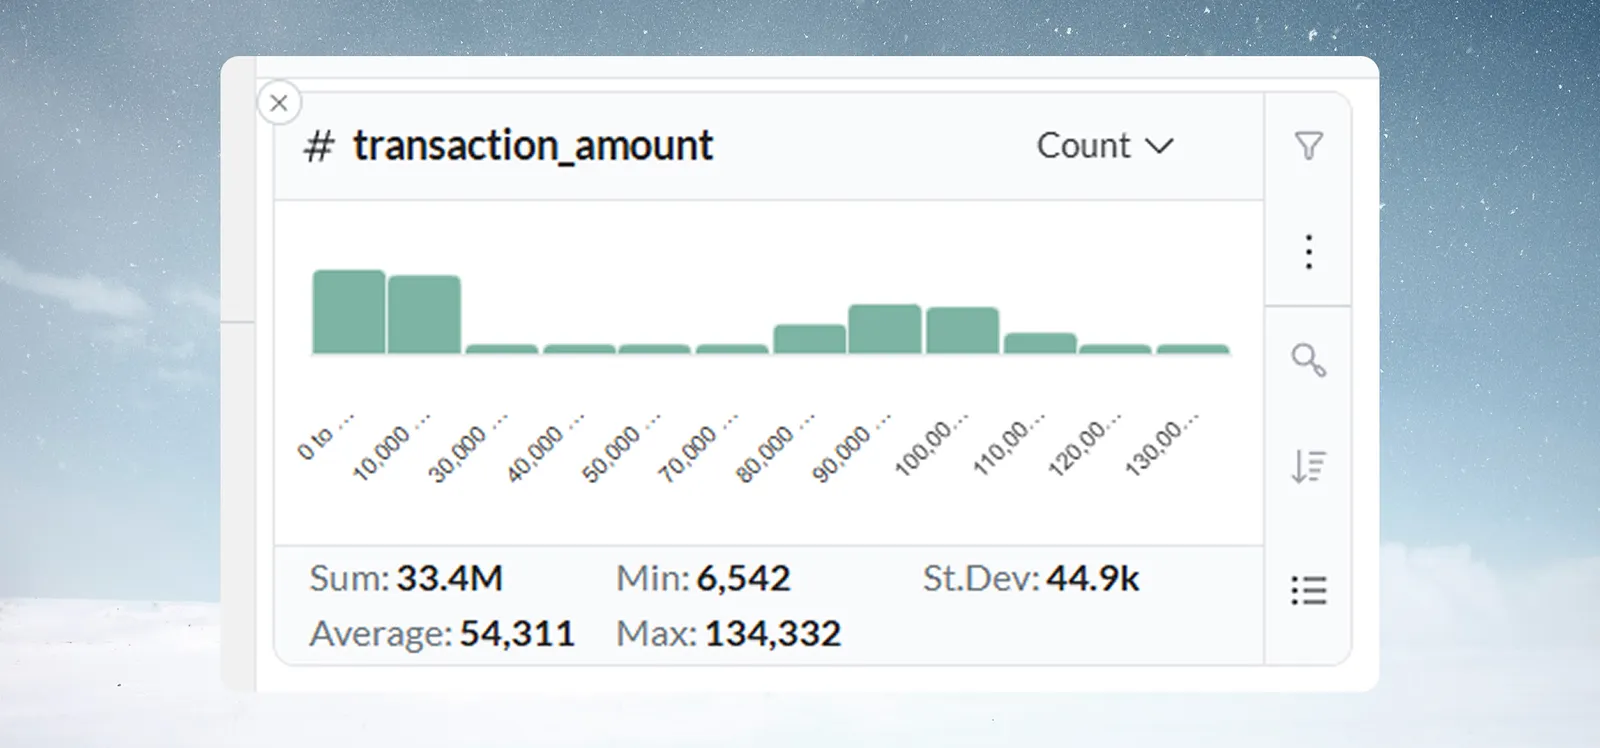
A sales analyst reviewing deal values sees a bimodal distribution in the histogram, with one cluster of smaller deals and another cluster of larger deals, and relatively few transactions in between.
This pattern highlights natural sales segments, allowing the team to quickly analyze SMB and Enterprise pipelines separately without writing a query.
Troubleshooting
Statistics don't update after filtering
- Check that the filter badge beside the Explore toggle shows the filter was applied
- Ensure you clicked Filter (or double-clicked a bar) rather than just selecting it, because selecting alone does not filter the grid
Too many bars, chart is hard to read
- Open the aggregation menu and increase the Granularity value (e.g., change from 10 to 100)
- A very large bar count may itself indicate data quality issues worth investigating
Distribution doesn't match expectations
- Check Min/Max for values outside the expected business range
- Look for a spike of identical values—may indicate a system default or placeholder
- Consider whether the data has seasonal or time-based patterns that a Date card would better reveal
Chart jumps to a coarser granularity than expected
- Automatic granularity depends on the range of the data currently counted, so it can change when a filter is applied
- Use the aggregation menu to set the granularity you want and click Apply
Statistics appear incorrect
- Verify the column data type is numeric—text-formatted numbers won't calculate correctly
- Check for hidden characters or currency symbols by examining the raw data grid