Transform and pipeline
Transforming data in Mammoth means building a pipeline: an ordered sequence of tasks that clean, reshape, calculate, and combine your data. You build it visually inside a View. Build it once and it re-runs every time the dataset refreshes, whether from a schedule, a file upload event, or a manual refresh.
This section is for analysts and operations teams who prepare data in Mammoth. If you are new, start with Understanding the pipeline, then follow Your first pipeline. You open the pipeline builder from the Pipeline panel inside any View.
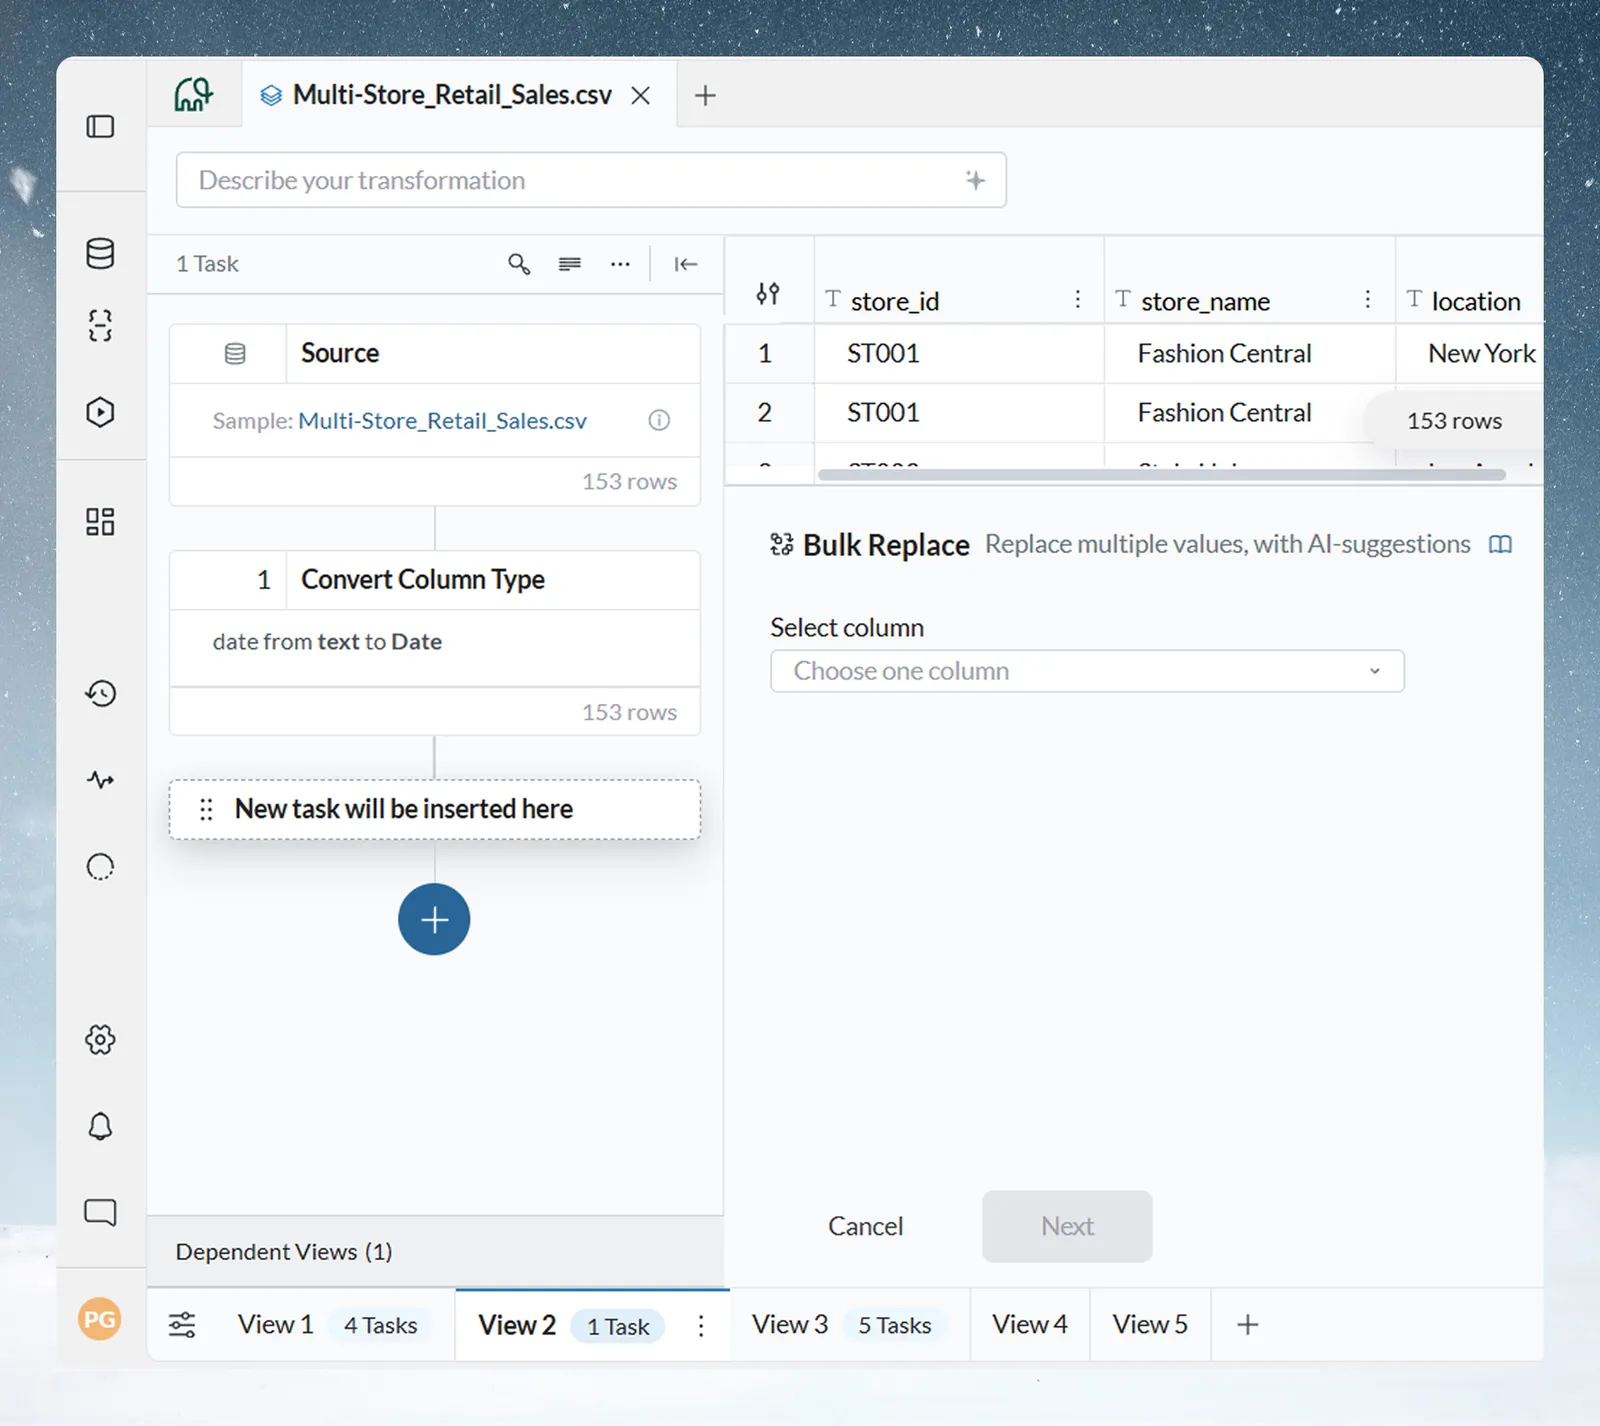
How pipelines work
A pipeline is a sequential list of transformation tasks. Each task is a discrete, reversible operation applied to the rows in your View. Tasks run in order from top to bottom, and the output of task N is the input to task N+1. The first item in the Pipeline panel is always Source, which represents the raw data coming in. The Source card appears automatically as soon as you add your first task to a fresh View.
RAW DATA
   ↓
[Task 1: Remove Duplicate Rows]
   ↓
[Task 2: Conditional Filter — keep rows where Status = "Active"]
   ↓
[Task 3: Edit Cells — standardize Region column values]
   ↓
[Task 4: Join — merge with budget data from another dataset]
   ↓
CLEAN OUTPUT
Because tasks are stored as instructions (not data copies), you can reorder, edit, or delete any task without losing your source data.
To add, edit, reorder, suspend, and copy tasks, see Understanding the pipeline.
Open the Transform menu
Open any View and click the Describe your transformation box in the action bar, or the blue + button (tooltip "Add a task"). The Transform menu opens with a search bar that reads "Describe your transformation" and a left navigation panel with seven categories. It opens on AI Powered by default, which shows five commonly used functions as shortcuts. The same functions are also available in their primary categories—AI Powered is a quick-access panel, not a separate set of exclusive functions.
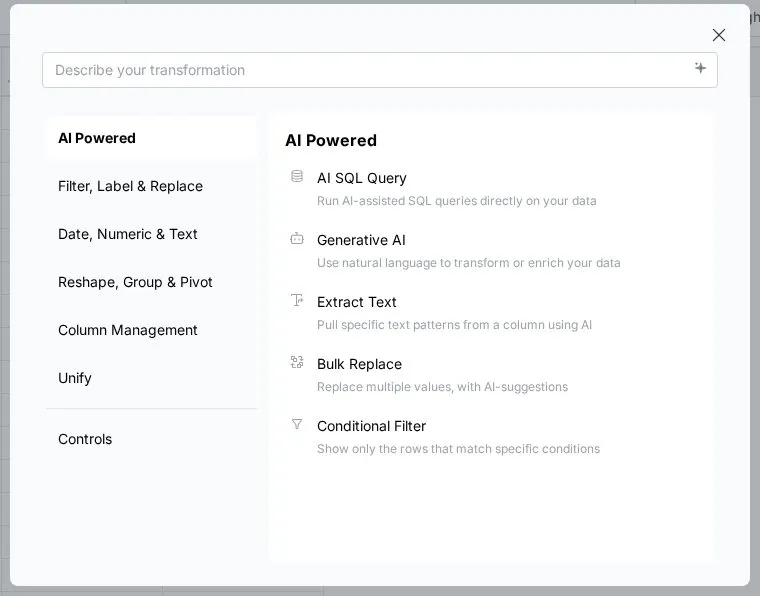
Types of operations
Mammoth provides 30+ transformation operations across seven categories. The Transform menu lists them in the same order:
| Category | Operations |
|---|---|
| AI Powered | AI SQL Query, Generative AI, plus shortcuts to Extract Text, Bulk Replace, and Conditional Filter |
| Filter, Label & Replace | Conditional Filter, Remove Duplicate Rows, Show Top/Bottom Rows, Edit Cells, Label & Insert Values, Fill Missing Values, Bulk Replace, Find & Replace |
| Date, Numeric & Text | Add/Subtract Date Values, Extract Date Part, Calculate Date Difference, Math Function, Window Function, Obtain Large or Small Values, Extract Text, Text Formatting, Extract JSON |
| Reshape, Group & Pivot | Group & Pivot, Unpivot |
| Column Management | Add Column, Copy Columns, Combine Columns & Text, Convert Column Type, Remove Column, Split Into Multiple Columns |
| Unify | Join (inner, left, right, outer), Lookup, Send to Dataset |
| Controls | Data Check, Checkpoint Alert |
See the Function reference for the complete list with descriptions, or go straight to a category:
- Filter, Label & Replace
- Date, Numeric & Text
- Reshape, Group & Pivot
- Column Management
- Unify
- Controls
AI-powered transformations
Several functions let you describe what you want in plain English and have Mammoth generate the transformation for you:
- Generative AI—writes new column values using a large language model (classification, enrichment, translation, summarization).
- AI SQL Query—converts a plain-language request into a SQL query and runs it against your data.
- Conditional Filter and Extract Text also include an AI-assisted generation bar—describe the rule and Mammoth builds it for you. Bulk Replace uses AI to suggest groupings of similar values.
Examples:
- "Remove all rows where the customer name contains a test email address" (Conditional Filter)
- "Extract the numeric dollar value from the Notes column" (Extract Text)
- "Classify this product description as Electronics, Apparel, Home, or Food" (Generative AI)
AI-generated logic produces the same reusable, auditable pipeline tasks as manual operations—you can inspect, edit, or override it before applying.
For details, see Generative AI and AI SQL Query.
Display changes vs pipeline tasks
There are two separate ways to modify a View, and it helps to understand both before you build your first pipeline.
Display Changes affect how data looks in your View—column names, column order, visibility, sorting, and number or date formatting. You make them from a column's 3-dot menu or by dragging columns. They do not transform the underlying data, and they are specific to the View you're working in.
Pipeline Tasks actually transform the data—filtering rows, calculating values, joining tables, cleaning text. They run automatically every time new data flows through the View.
There is no "Rename Column" pipeline task in Mammoth. To rename a column, double-click its header or open its 3-dot menu and select Rename Column. This creates a Display Change, and the new name appears in pipeline task dropdowns and exports.
See Rename, format, and sort columns for the full explanation.
Draft mode vs immediate execution
When you add a pipeline task, you can choose how it applies to your data:
| Mode | Behavior | Best for |
|---|---|---|
| Immediate | The task applies and the data grid updates instantly | Single tasks, small datasets, quick exploration |
| Draft mode | Tasks are queued and applied as a batch when you click Apply now | Testing logic with many tasks, large datasets |
Turn Draft mode on from the pipeline's More Pipeline options (...) menu. Pending changes are listed in the Review modal until you apply the batch. See Draft mode for the full workflow.
Pipeline management
Once a pipeline is built, it runs automatically each time the underlying dataset refreshes—whether triggered by a schedule, a file upload event, or a manual refresh.
You can:
- Reorder tasks by dragging
- Suspend and restore individual tasks without deleting them
- Duplicate a task for minor variations
- Copy a pipeline from one View to another
Working with multiple datasets
To combine data from two or more datasets, use a Join or Lookup task:
- Join—merges two Views by matching rows on a common key column. Supports inner, left, right, and outer joins.
- Lookup—fetches a value from another dataset based on a key, like VLOOKUP in Excel.
- Send to Dataset—routes the output of this pipeline into a new or existing dataset for downstream analysis.
Performance tips
- Apply filter tasks early in the pipeline to reduce the row count before expensive operations like joins and pivots.
- For large datasets, use Draft mode to batch test changes before applying.
- Use an Automation to keep source datasets current automatically rather than re-uploading manually.
For more, see Performance and Automations.
In this section
- Understanding the pipeline: add, edit, suspend, reorder and copy tasks, and use Draft mode.
- Rename, format, and sort columns: Display Changes versus pipeline tasks.
- Function reference: every Transform function with a short description.
- Filter, Label & Replace: filter rows, edit cells, fill missing values, find and replace.
- Date, Numeric & Text: date math, calculations, window functions and text extraction.
- Reshape, Group & Pivot: summarize with Group & Pivot and reshape with Unpivot.
- Column Management: add, copy, combine, split, convert and remove columns.
- Unify: Join, Lookup and Send to Dataset.
- Pipeline Controls: Data Check and Checkpoint quality gates.
- Conditional Highlights: color cells or rows by rule without changing data.
- AI SQL Query: turn a plain-English request into SQL.
- Generative AI: classify, enrich or translate values with your own AI key.
- Pipeline health and error states: diagnose and fix failing tasks.
- Column Menu: format, sort, freeze, rename and hide from a column header.
- Grid Operations: act on several selected columns at once.
- Format guide: format codes for Convert Column Type.