Dashboard filters
Filters let you and your dashboard viewers interactively slice data without changing the underlying charts. When the AI builds your dashboard it derives a few default filters from your data. You can add, edit, or remove filters at any time.
The filters bar is a section of the dashboard. To show or hide it, open the Design tab and use Sections (Filters bar).
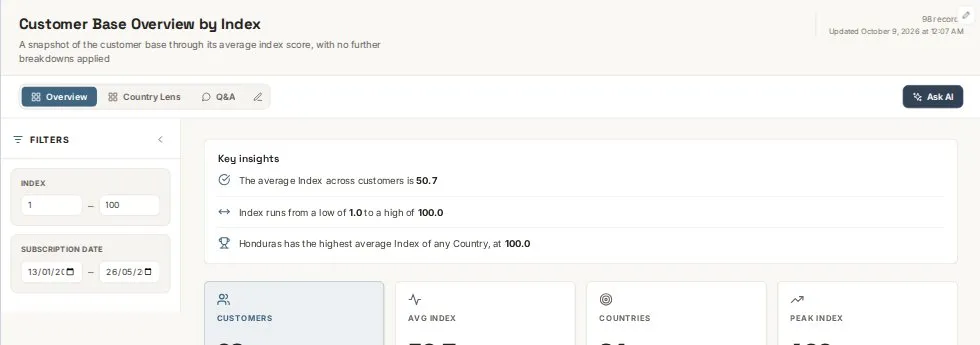
Filter controls
Each filter has a control, which sets how people pick values:
Dropdown
Pick a single value from a menu. Compact, best for one choice at a time (like Status or Type).
Chips
Removable pills that people tap to include. Best when there are only a handful of options.
Checklist
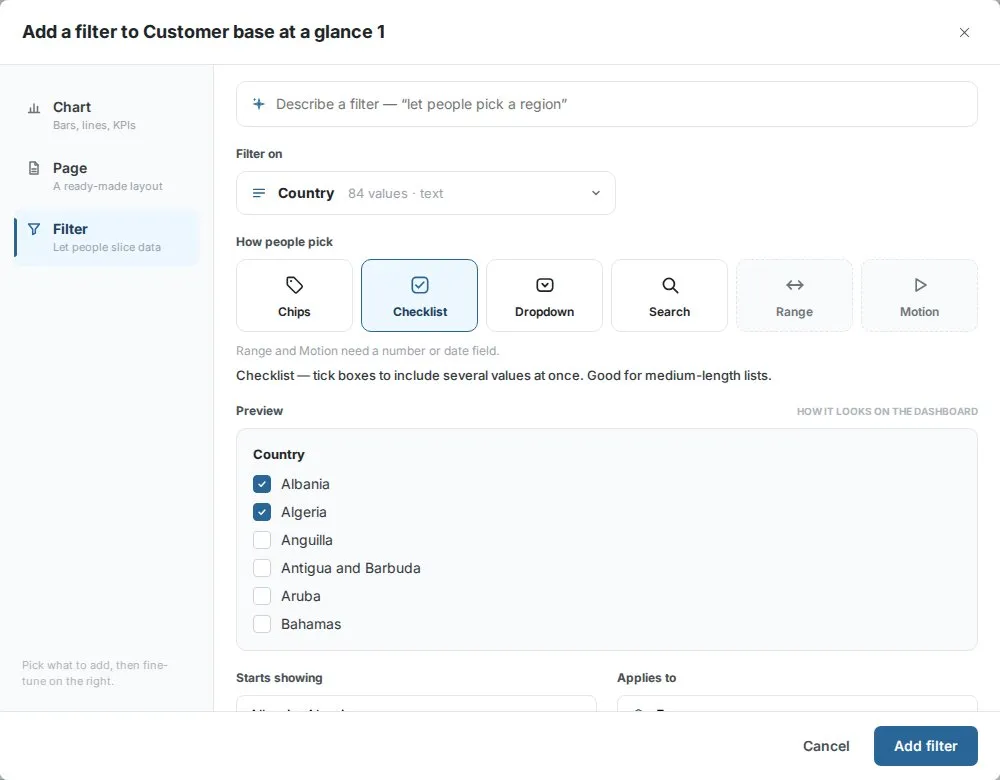
Tick boxes to include several values at once. Good for medium-length lists (like Region or Product Category).
Search
Type to find a value. Best when the list is long, like customer names or product IDs.
Range
Drag a minimum and maximum. Range works for number and date fields.
Motion
A playable timeline for a date field. Press play and the whole dashboard sweeps through time.
Range and Motion need a number or date field.
Adding, editing, and removing filters
There are two ways to change filters.
Ask the AI chat:
"Add a filter for product category"
"Remove the Revenue filter"
Use the Add menu:
- Click Add in the editor header, then choose Filter
- Describe the filter, or pick the Field yourself
- Choose the Control (Dropdown, Chips, Checklist, Search, Range, or Motion)
- Choose what it Applies to
- Choose what it Starts showing
- Click Add filter
To change a filter later, open it and click Update filter, or use Remove filter.
Starting values
Starts showing sets what viewers see first: All values, or preselected values. This lets a dashboard open pre-filtered to a time period, region, or other dimension.
Filter scope
You choose the scope of each filter:
- Every page—The filter applies to the charts on all pages
- This page—The filter applies only to the page it's on
How filters affect charts
When a viewer changes a filter:
- The charts in its scope update to show only matching data
- KPI cards recalculate their totals
See Multi-page navigation for how pages and filters interact.