Pipeline Controls
Controls are pipeline tasks that add quality gates and human touchpoints to your data workflows. Instead of letting a pipeline run silently from start to finish, Controls let you define what "good" data looks like and what should happen when data doesn't meet that standard—all without writing custom transforms.
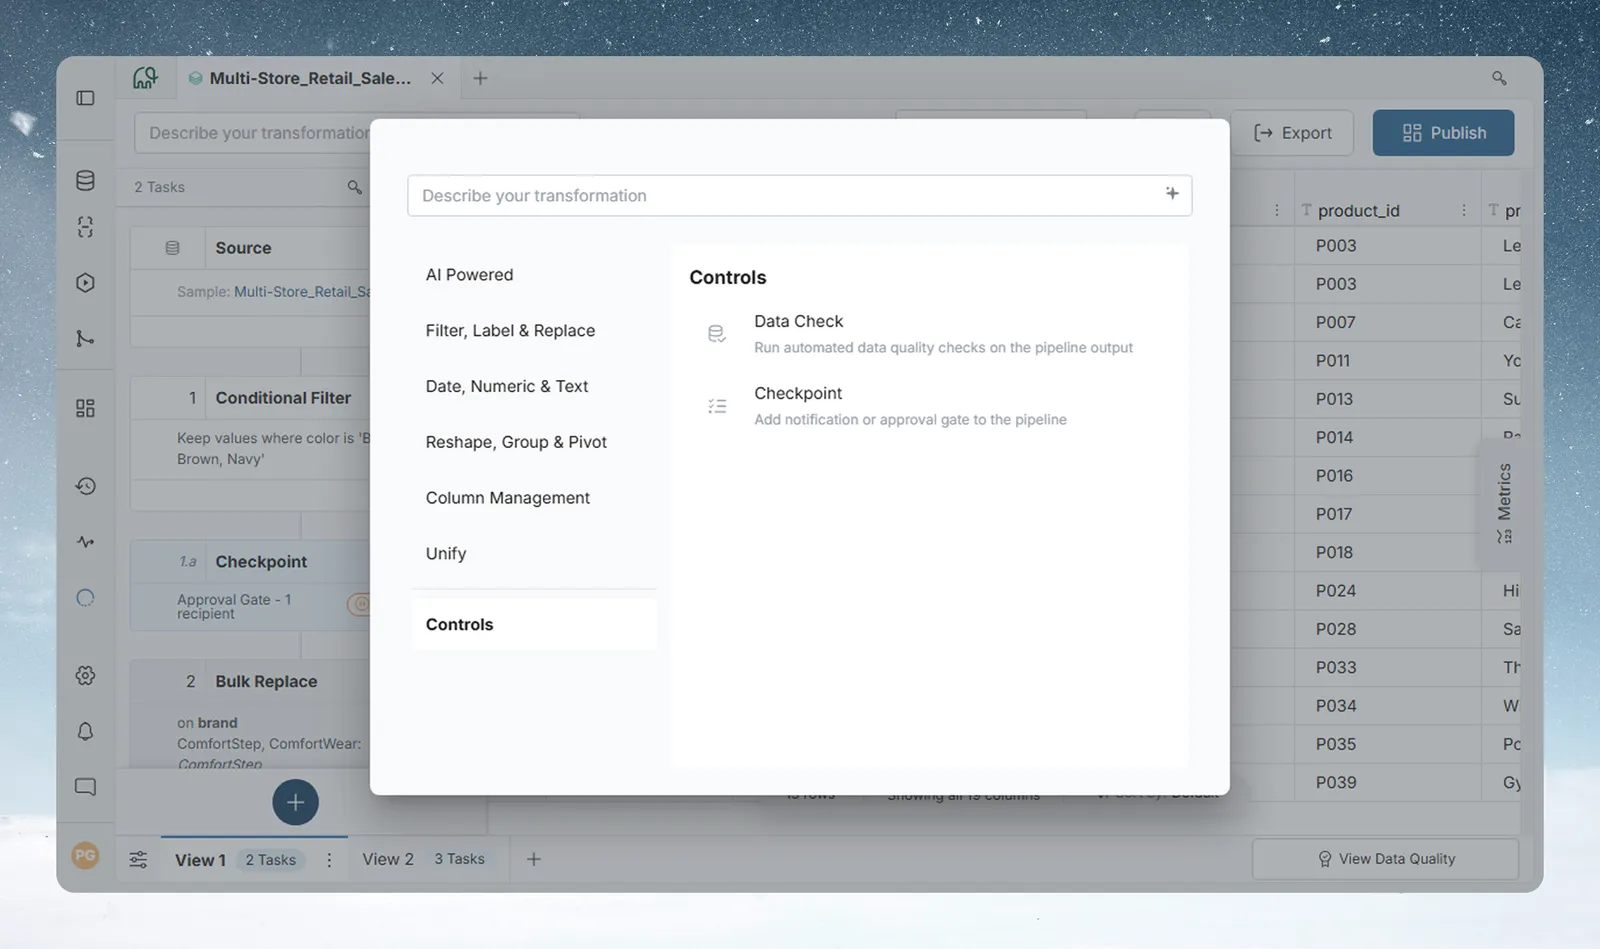
Mammoth has two Pipeline Controls, Data Check and Checkpoint. The table compares them.
Controls at a glance
| Data Check | Checkpoint | |
|---|---|---|
| What it does | Automatically validates your data against rules you define | Sends notifications and optionally pauses the pipeline for human review |
| When to use | When you need to catch bad data before it reaches downstream tasks | When a human needs to review data or approve before the pipeline continues |
| Fail behavior | Pause the pipeline or flag and continue | Notify only or pause for approval |
| Downstream effect | Optional email notification on failure; downstream tasks do not run if the pipeline is paused | Email notification (and optional webhook); pipeline pauses until approved |
| Partial rerun | Marked Bypassed if it sits before the task you rerun from | Marked Bypassed if it sits before the task you rerun from, unless it is already waiting for approval or approved |
When to use each
Use a Data Check when:
- You want automated, rule-based validation—no human needed
- You need to catch issues like empty columns, unexpected row counts, or values out of range
- A bad dataset should stop the pipeline automatically
Use a Checkpoint when:
- A person needs to review the data at a certain point before it continues
- You want a notification sent to your team when a critical pipeline task completes
- You need an audit trail showing that a human reviewed and approved the output
Use both together for high-stakes pipelines: add a Data Check after ingestion to catch obvious data quality issues automatically, then add a Checkpoint before the final output task so a team lead can review before the report goes out.
Data Check
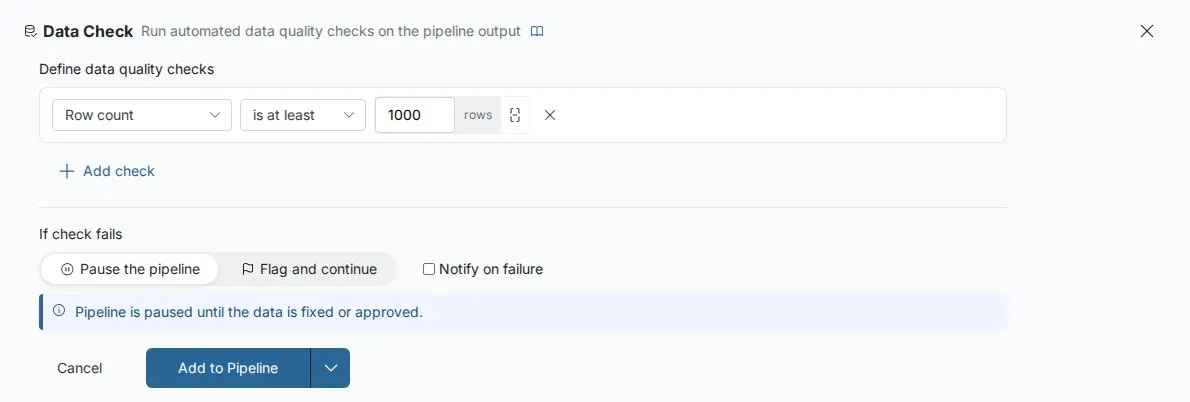
A Data Check is an automated quality gate attached to a pipeline task. After the task runs, the Data Check evaluates the output against rules you define—checking things like row count, null rates, or value ranges. If the output doesn't meet your standards, the pipeline either halts or continues with a flag, depending on your configuration.
3 essential checks for any pipeline
Not sure where to start? These three checks cover common data issues:
- Row count ≥ 1—catches empty output from an upstream failure
- Null percentage < 5% on your key identifier column—catches broken joins or missing source data
- Value range on your primary numeric column—catches sign errors, unit mismatches, or corrupt values
Add these after your first ingestion task to catch common pipeline failures early.
Adding a Data Check to your pipeline
- Open the Transform menu and choose the Controls category.
- Select Data Check.
- Choose a check type (see Check types below) and configure it. Use Add check to add more checks.
- Choose what happens if the check fails and, optionally, turn on Notify on failure.
- Click Apply.
The Data Check appears in the Pipeline panel and evaluates the output of the task before it.
One Data Check per task position. To validate multiple rules at the same position, add them as separate checks within a single Data Check using the Add check button inside the form—not by adding a second Data Check.
Check types
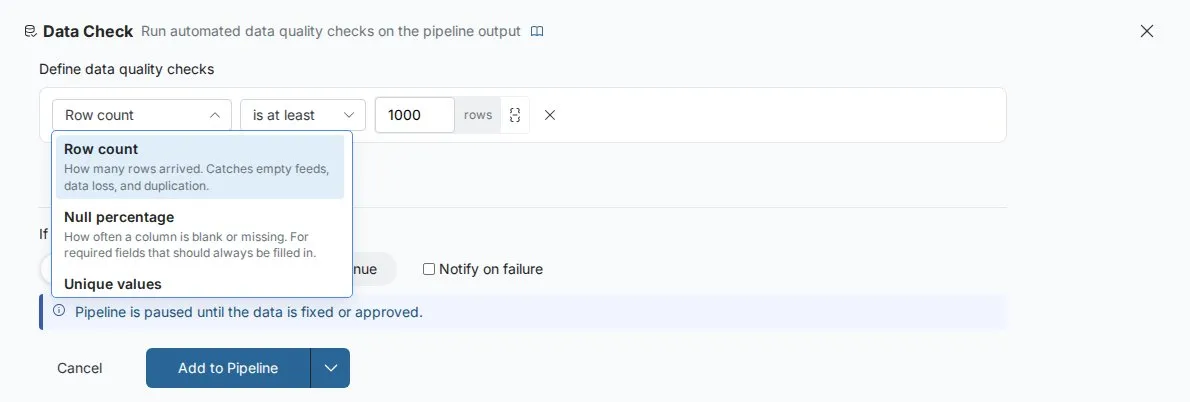
A Data Check can contain one or more checks, each targeting a specific quality rule. Choose the type from the tiles shown when you open the form, or from the type dropdown on each check.
Null percentage
The Null percentage check tests the percentage of null or empty values in a column.
| Condition | Meaning |
|---|---|
| is less than | Null % must be below the threshold |
| is greater than | Null % must be above the threshold |
| is exactly | Null % must equal the threshold exactly |
Parameters: Column name, threshold (a percentage)
Example: Ensure the customer_email column has fewer than 1% nulls after a data join—catching broken joins before they silently drop records.
Row count
The Row count check tests the total number of rows in the pipeline output.
| Condition | Meaning |
|---|---|
| is at least | Row count must be ≥ value |
| is at most | Row count must be ≤ value |
| is exactly | Row count must equal value |
| is between | Row count must fall within min–max range |
Parameters: Single value (for most conditions) or min/max (for "is between")
Example: Ensure a daily sales feed always has at least 1,000 rows—catching upstream data source failures before they produce empty reports.
Unique values
The Unique values check tests whether values in a column are unique. Empty values are not counted.
| Condition | Meaning |
|---|---|
| 100% unique (no duplicates) | Every value must be distinct |
| Uniqueness at least... | At least the percentage you enter must be unique |
Parameters: Column name, and a percentage for the second condition
Example: Ensure an order_id column has no duplicates after a join—catching fan-out issues that would inflate aggregation totals.
Value range
The Value range check tests whether values in a numeric column fall within acceptable bounds.
| Condition | Meaning |
|---|---|
| between | Column values must fall within min–max range |
| is at least | Column values must be ≥ value |
| is at most | Column values must be ≤ value |
| is positive | Column values must be > 0 |
| is negative | Column values must be < 0 |
Parameters: Column name, value or min/max range, and a tolerance dropdown: Fail if any row violates, Fail if > 1% violate, Fail if > 5% violate, or Fail if > 10% violate
The tolerance setting is useful for real-world data where a small number of edge-case values are acceptable. A 1% tolerance means the check passes if at most 1% of rows violate the rule.
Example: Ensure that transaction_amount is always positive with a 1% tolerance—allowing for rare credit/reversal entries without failing the entire pipeline.
Custom prompt
The Custom prompt check lets you write a data quality rule in plain language and have Mammoth generate the SQL for you.
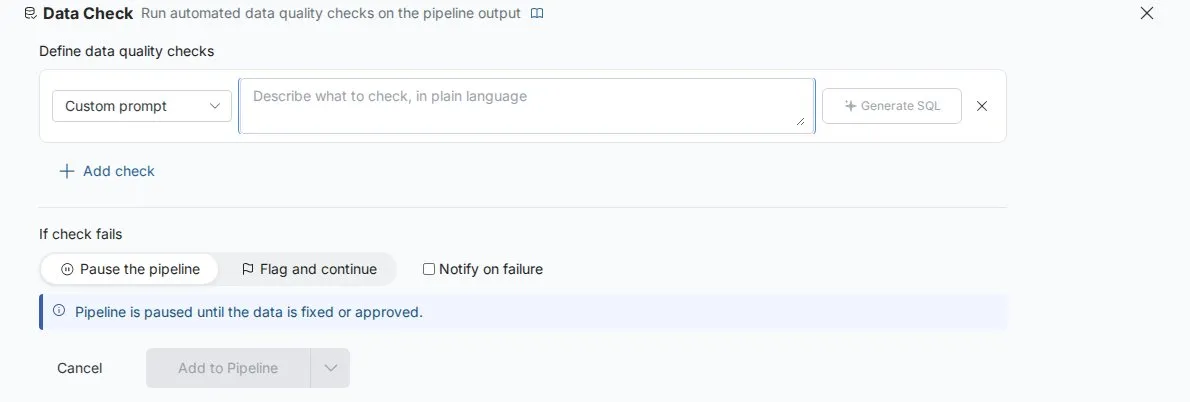
- Select Custom prompt as the check type (the tile is labeled Write your own rule)
- In the text box, type a plain-language description of your rule (e.g., "all prices must be positive", "revenue should not exceed 10 million")
- Click Generate SQL—Mammoth sends the description to an AI model and generates a SQL condition
- Review the Generated SQL shown below the text box
- Click Apply to save the Data Check
The generated SQL runs as a condition against the full pipeline output table.
Example: "the discount percentage should never exceed 100" → generates discount_pct <= 100
Multiple checks: Any vs. all
A single Data Check can contain multiple checks evaluated together.
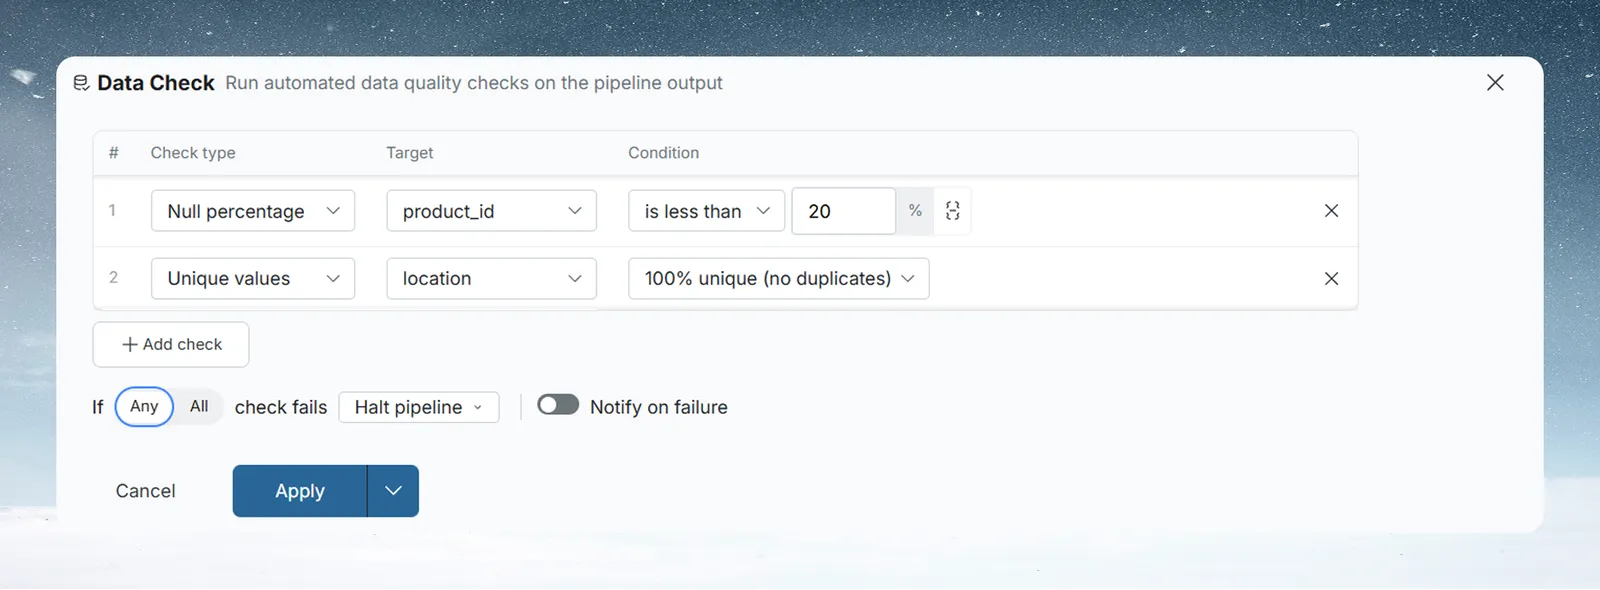
When a Data Check has two or more checks, the failure sentence reads If [Any | All] check fails. The Any / All toggle controls how results are combined:
| Setting | Behavior |
|---|---|
| Any (default) | The Data Check fails if any check fails—all checks must pass |
| All | The Data Check fails only if all checks fail—one passing check is enough to keep the pipeline going |
"All" is more lenient than it sounds.
"All" doesn't mean "all checks must pass." It means "all checks must fail" to trigger failure. Use Any (the default) if you want a single failed check to halt or flag the pipeline. Use All only when the checks are alternatives—where passing any one of them is acceptable.
Fail behavior
Set what happens when the Data Check fails:
| Setting | What happens |
|---|---|
| Pause the pipeline | Pipeline execution stops. Downstream tasks are blocked until the data is fixed or approved, or you change the check threshold, and the pipeline is rerun. |
| Flag and continue | The failure is flagged, but the pipeline continues running to completion. |
When to use pause: Use for financial reports, regulated outputs, or any pipeline where bad data reaching the final output is unacceptable.
When to use flag and continue: Use for operational data where analysts can work with partial data, or when you want to surface data quality as a metric rather than a blocker.

If Notify on failure is on, the email is sent regardless of which fail behavior is selected.
Email notifications
Select Notify on failure and choose recipients to send an email when the Data Check fails. At least one recipient is required.
The notification email includes:
- The View name, the project name, and a link to the View
- The position of the Data Check in the pipeline (for example, task 3 of 8)
- The status and details of each individual check, including the measured value
- Whether the pipeline was paused
Recipients are chosen from the project member list.
Parameter bindings
Instead of hardcoding threshold values, you can bind numeric check values to parameters—making the same pipeline reusable across different environments or execution contexts.
Example use case: A pipeline runs in both development (where you expect small test datasets) and production (where you expect full-volume data). Instead of maintaining two separate pipelines:
- Create a Number parameter
min_rows - In the Data Check, click the parameter icon next to the row count value
- Select
min_rowsas the bound parameter - Set
min_rows = 10for dev runs andmin_rows = 50000for production runs
The same pipeline, same Data Check, different effective thresholds per environment.
Understanding check results and status
After a pipeline run, each Data Check shows one of four statuses:
| Status | Meaning |
|---|---|
| Passed | The checks met the Any/All rule |
| Failed | The checks did not meet the Any/All rule |
| Not run | The Data Check has not run yet |
| Bypassed | The check was skipped during a partial rerun because it sits before the task you reran from |
Open the status to see the Data Check results, which show each individual check with its column, condition, result, and status. If a check references a column that is no longer available, the modal asks you to edit the Data Check to fix the configuration.
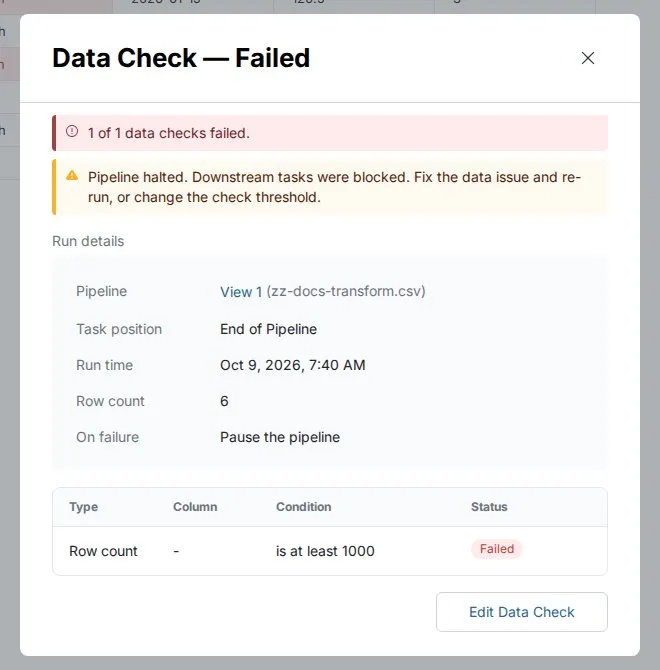
Pending data checks
When a Data Check fails, it appears in the Governance section of the Needs Attention tab in Monitor as Data check failed, with a summary such as 1 of 2 checks failed. Click Review to open the View.
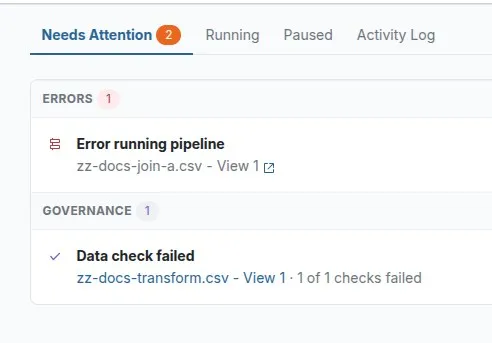
Once you've resolved the underlying data issue and rerun the pipeline successfully, the pending item clears.
Checkpoint
A Checkpoint pauses your pipeline at a specific task to notify your team or wait for explicit approval before continuing. Use it when a human needs to know that data has reached a certain state—or when a human needs to review and sign off before the pipeline proceeds.
Received an approval request? If you're here because you got an approval email, jump to Reviewing and approving a gate →
Alert versus Approval Gate
| Alert | Approval Gate | |
|---|---|---|
| What it does | Sends notifications and immediately continues the pipeline | Sends notifications and pauses the pipeline until someone approves |
| Requires action | No—pipeline continues automatically | Yes—a project member must click Approve and Continue |
| Use when | You want visibility without a manual step | You need a human review before data moves forward |
| Status after triggering | Sent | Pending (the status window shows Pending Approval) |
Adding a checkpoint to your pipeline
- Open the Transform menu and choose the Controls category.
- Select Checkpoint Alert.
- Under When the pipeline reaches this checkpoint, choose Notify only (an Alert) or Pause for approval (an Approval Gate).
- Select email recipients from the project members, and optionally add a webhook.
- Optionally click Add a message to include context in the email. The message is also shown to the approver in the status window for an Approval Gate.
- Click Apply.
The Checkpoint appears in the Pipeline panel, labeled with its type and the number of recipients (for example, Approval Gate - 2 recipients).
Configuring email notifications
Add one or more project members as notification recipients. They receive an email when the Checkpoint is triggered—either immediately (Alert) or when approval is needed (Approval Gate).
The email includes:
- The View name, the project name, and a link to the View
- The position of the Checkpoint in the pipeline (for example, task 4 of 8) and when it triggered
- Whether it is an Alert (Checkpoint reached) or an Approval Gate (Approval required)
- The custom message, if you added one
Configuring webhook notifications
Click Add webhook and enter a URL (must start with https://) to notify an external system (Slack, Teams, PagerDuty, a custom endpoint, etc.) when the Checkpoint triggers. Mammoth sends the request with a 10-second timeout.
The payload Mammoth sends is fixed—it is not user-configurable. Every checkpoint webhook sends this JSON body in a POST request:
{
  "checkpoint_id": 123,
  "checkpoint_name": "Finance team approval before final report",
  "checkpoint_type": "approval",
  "task_sequence": 4,
  "dataview_id": 654,
  "dataview_name": "View 1",
  "workspace_id": 22
}
checkpoint_type is "alert" or "approval".
Test payload editor: Click Payload under the webhook URL to open a payload editor, then click Test to send your draft from your browser to the URL and confirm it's reachable. The result shows Delivered · 200 or Endpoint returned an error. Test is available only when the payload is filled in. It accepts
{{pipeline_name}},{{pipeline_id}},{{checkpoint_type}},{{step_number}},{{step_name}},{{timestamp}},{{status}},{{project_name}}, and{{triggered_by}}as placeholder tokens, with a 10KB size limit and a 5-level nesting limit. Unknown tokens are sent as-is. This editor is for testing only—whatever you enter here is never saved and has no effect on what's sent when the Checkpoint actually triggers. The real trigger always sends the fixed payload shown above.
Either email or webhook (or both) must be configured—a Checkpoint with no notification method is not valid. If you turn on email, select at least one recipient.
Approval Gate: the full workflow
When a pipeline reaches an Approval Gate Checkpoint during execution:
- Pipeline pauses. Execution stops at the Checkpoint task. Downstream tasks do not run.
- Notifications are sent. All configured email recipients receive a notification. Any configured webhook fires.
- Status changes to pending. The Checkpoint in the Pipeline panel shows a Pending chip, and its status window is titled Checkpoint Alert - Pending Approval.
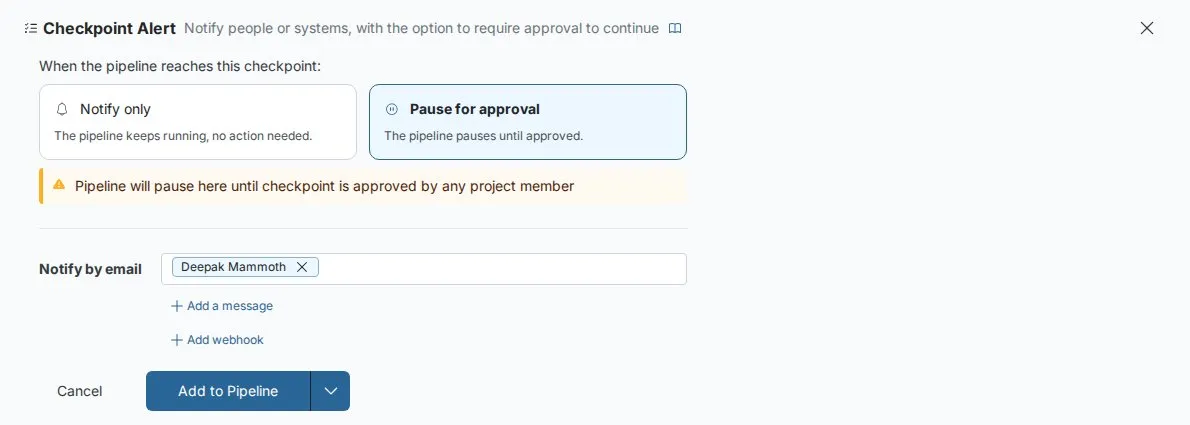
- A reviewer signs in to Mammoth, opens the View, and opens the Checkpoint status window. Any project member can approve.
- The reviewer inspects the data. They can view the pipeline output at this stage—the data is available even though the pipeline is paused.
- The reviewer clicks Approve and Continue. A confirmation, Approve this checkpoint?, asks them to click Yes, Approve.
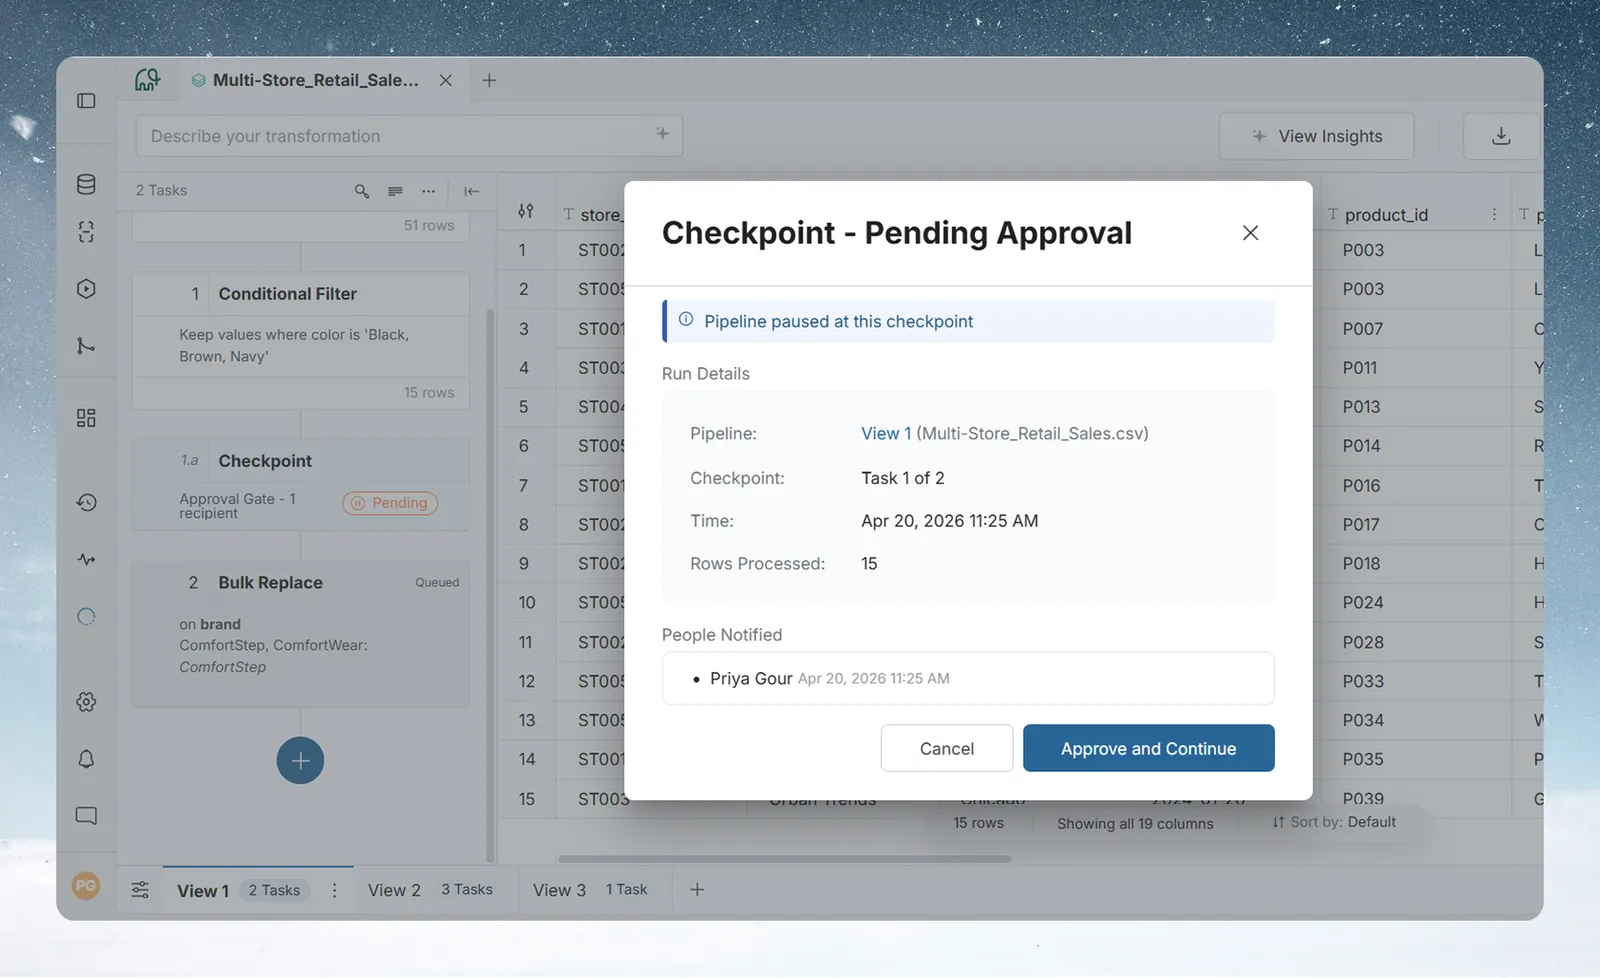
- Pipeline resumes. Mammoth continues execution from the task after the Checkpoint.
- Status changes to Approved. The Checkpoint shows an Approved indicator.
Reviewing and approving a gate
This section is for reviewers who received an approval request email.
You received an email because a data pipeline you oversee has paused at an Approval Gate and is waiting for your review before it continues.
To approve:
- Click the link in the approval email—it takes you directly to the View in Mammoth
- Sign in if prompted (you need a Mammoth account with access to this project)
- In the Pipeline panel, click the Pending chip on the Checkpoint task
- The Checkpoint status window opens—review the Message from pipeline owner and inspect the pipeline data if needed
- Click Approve and Continue
- In the confirmation, Approve this checkpoint?, click Yes, Approve
- The pipeline resumes automatically
Once approved, the Checkpoint shows Approved and the pipeline continues running.
Understanding checkpoint status
| Status | Meaning |
|---|---|
| Sent | An Alert Checkpoint triggered—notifications were sent and the pipeline continued |
| Pending (Pending Approval in the status window) | An Approval Gate triggered—the pipeline is paused, waiting for a reviewer to approve |
| Approved | A reviewer approved the gate—the pipeline has resumed or completed |
| Bypassed | The Checkpoint was skipped during a partial rerun (see below) |
Pending checkpoints
When an Approval Gate Checkpoint is waiting for approval, it appears in the Governance section of the Needs Attention tab in Monitor as Checkpoint: approval required, showing the View and a line such as Task 4 of 8 is waiting for approval.
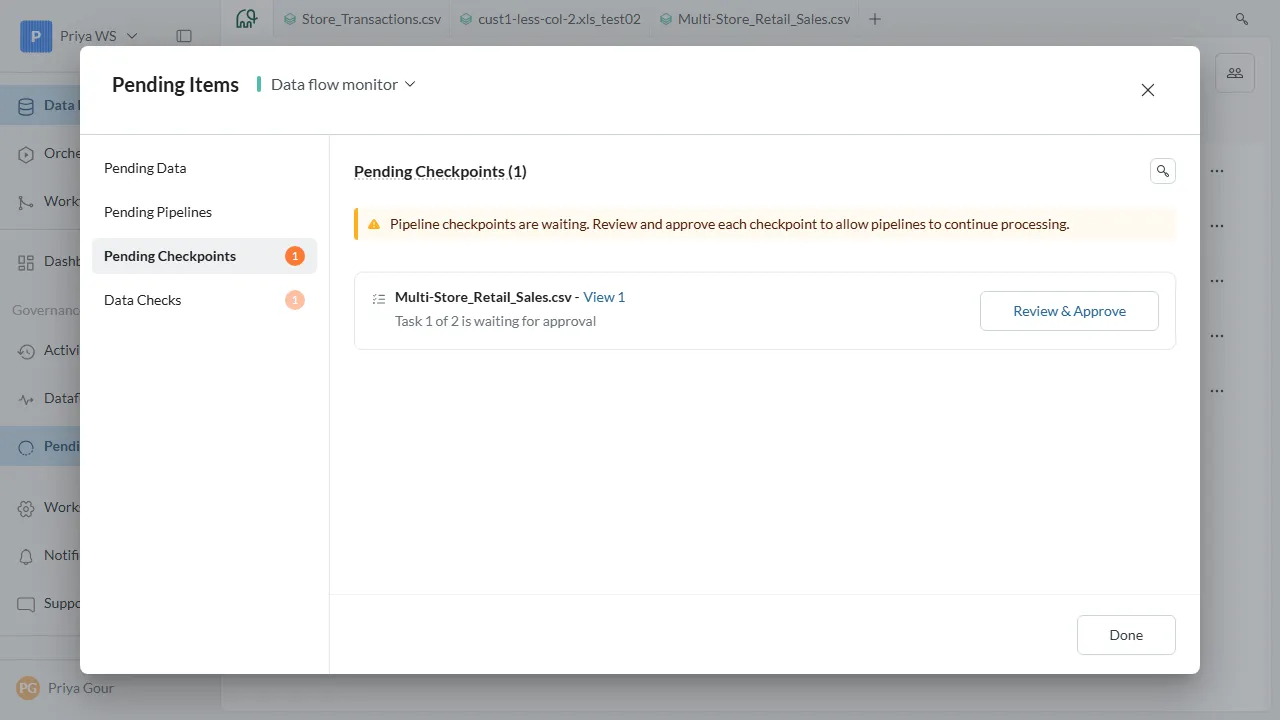
Click Approve on the row to open the View, where you can inspect the data and approve.
Partial rerun behavior
When you rerun a pipeline from a specific task (not from the beginning), Checkpoints that sit before that task are marked Bypassed, unless they are already waiting for approval or approved, in which case they keep that status.
A Bypassed Checkpoint is not triggered again for the partial rerun, so no notification is sent and no approval is requested. The pipeline proceeds past it automatically.
This is expected behavior. If you want the Checkpoint to be re-evaluated from scratch, run the full pipeline from the beginning.