Core concepts
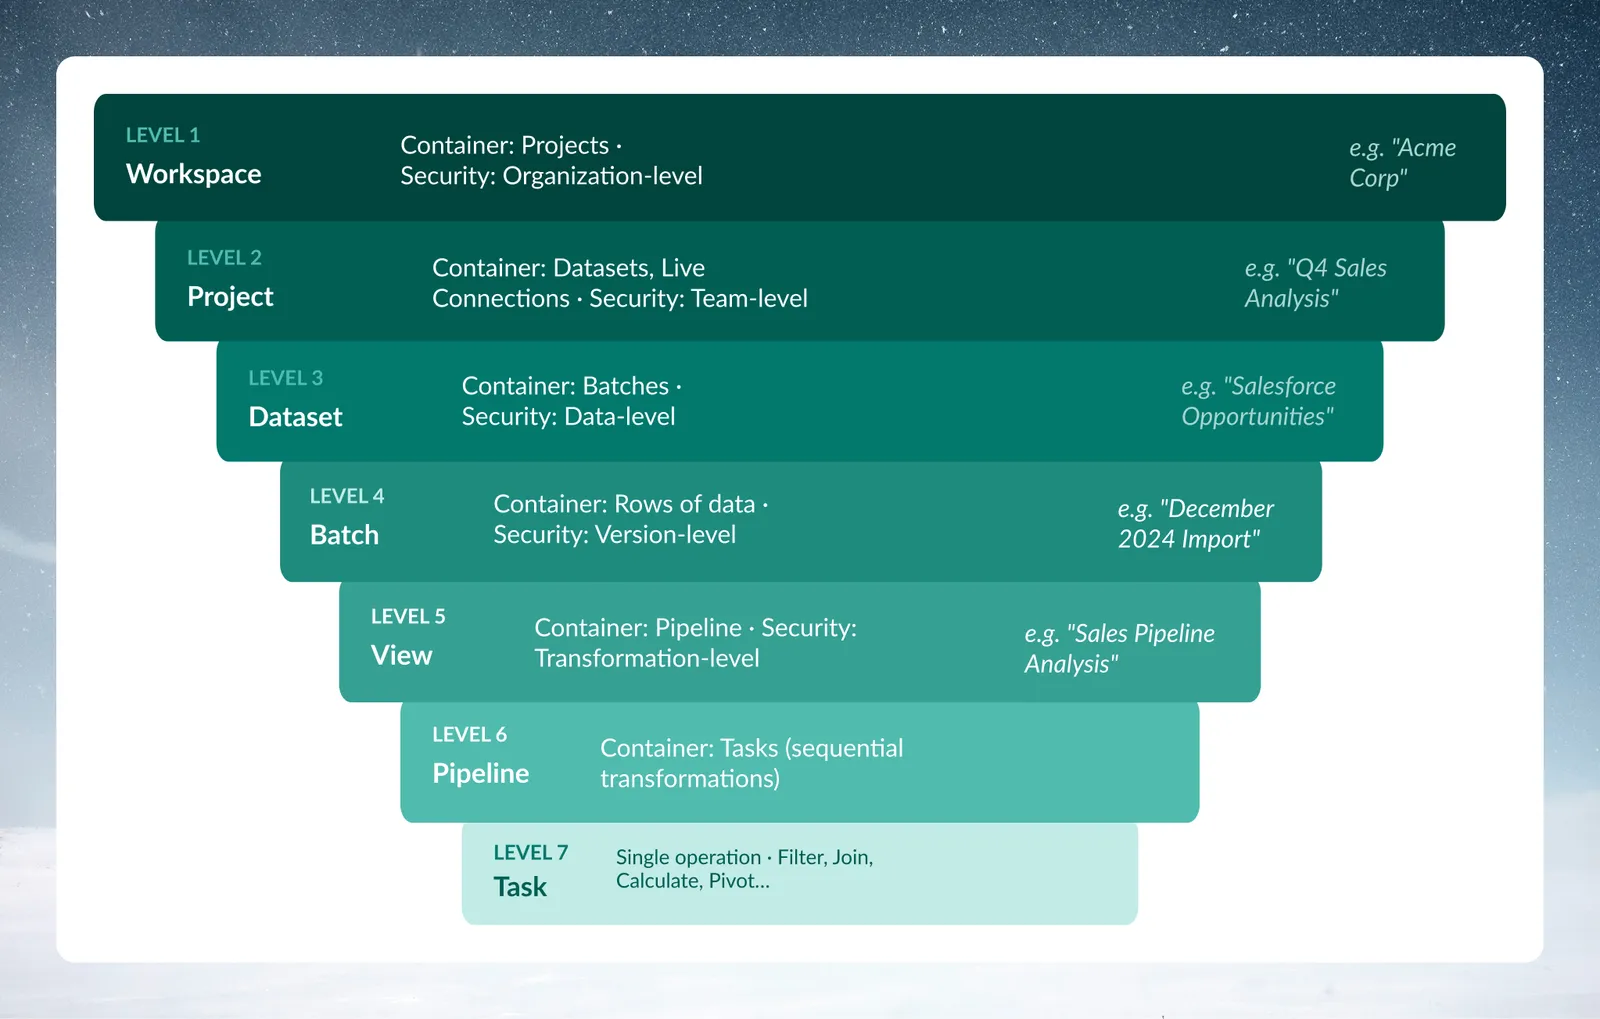
Every platform has its own vocabulary. In Mammoth, Mammoth uses seven core concepts: Workspace, Project, Dataset, Batch, View, Pipeline, and Task. They describe how Mammoth organizes data work.
This page is for new users. It defines each concept with examples and explains how they work together. To build a pipeline right away, go to the Quick start.
Workspace: Your organization's container
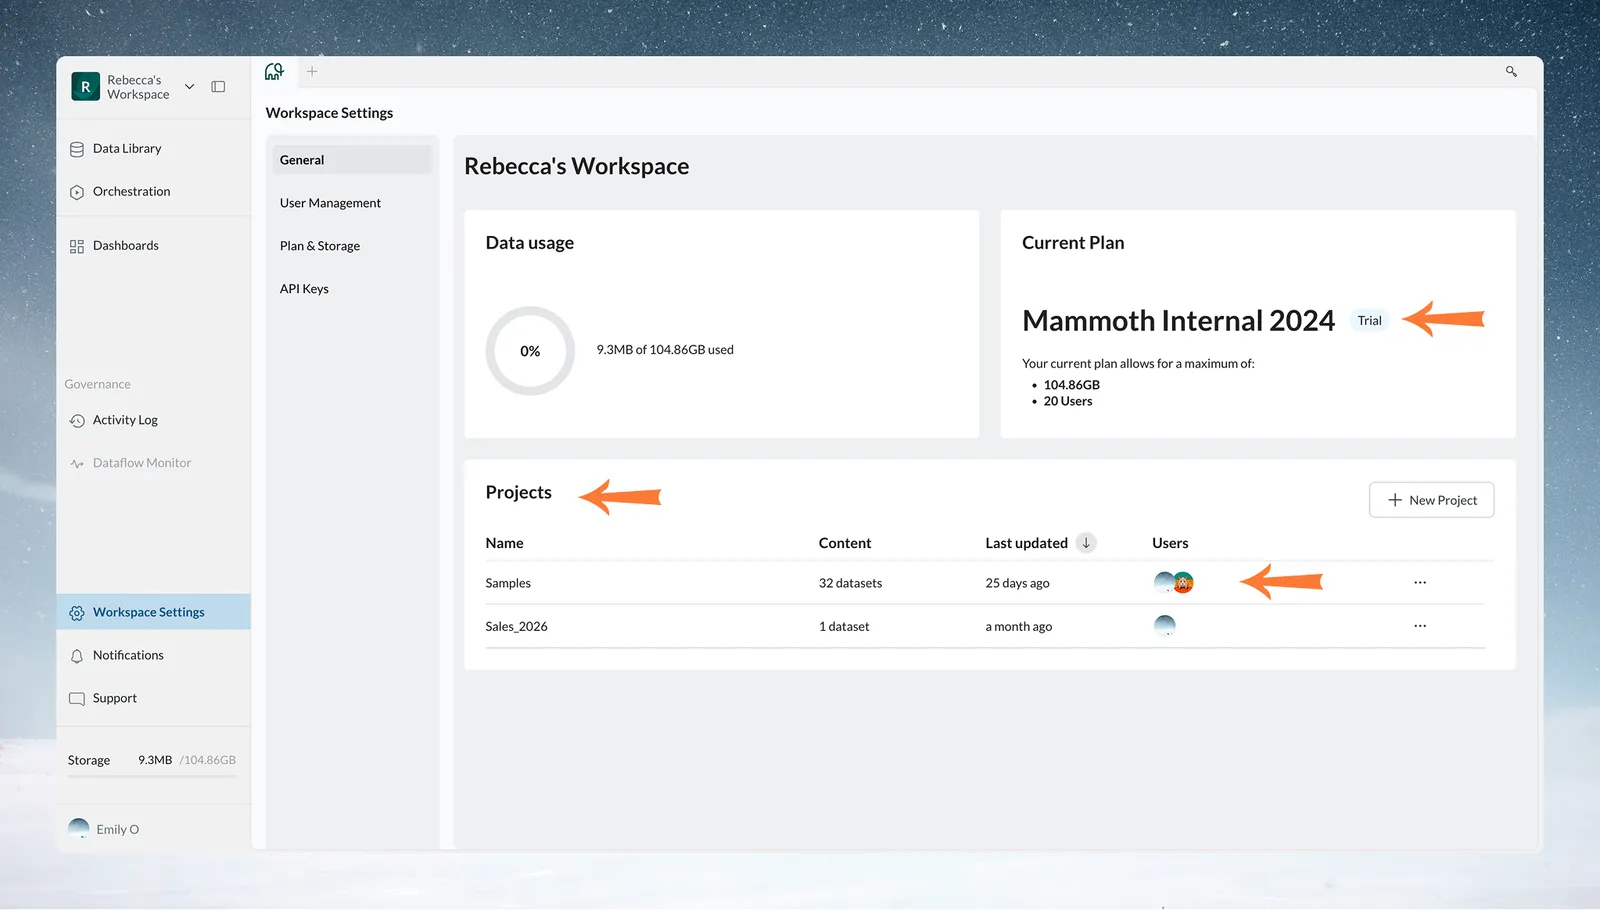
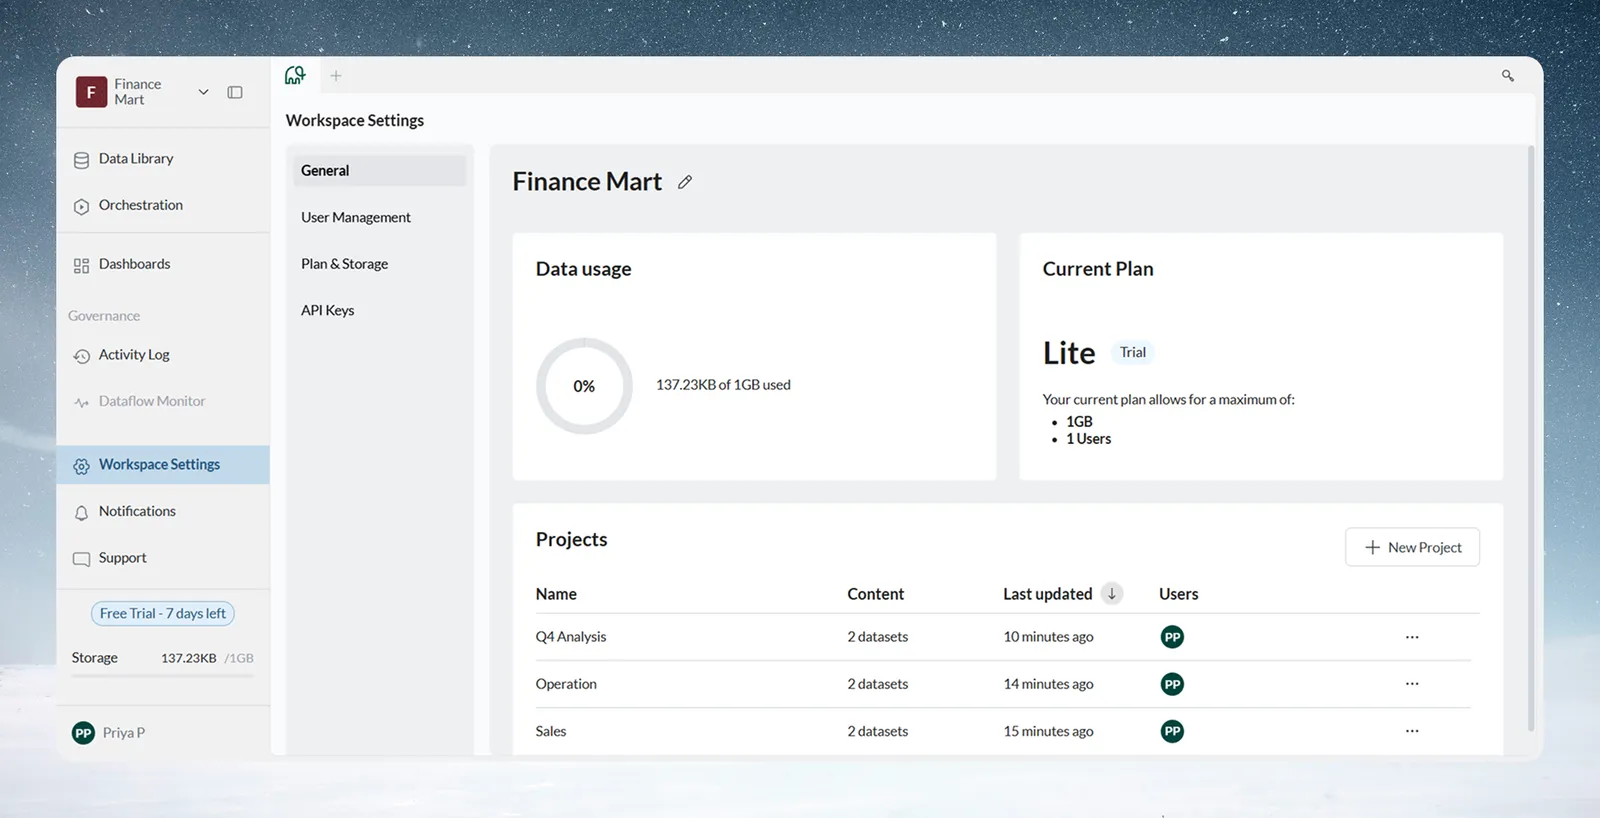
A Workspace represents your entire organization's Mammoth environment. When you sign up, you create or join a Workspace. It's where billing and subscription are managed, users are invited and given permissions, global settings are configured, and all Projects live.
Workspace characteristics
Your Workspace is tied directly to your subscription plan and billing. The Workspace Owner has full administrative control over the environment, including managing users, billing, and security settings. Members have defined roles—Owner or Member—with specific permissions for each level. Complete isolation from other Workspaces creates a secure data boundary for your organization. Each Workspace can contain multiple Projects, and you can see your storage allocation in the interface (like "1.49GB / 2.1GB used").
Real-world analogy: Like a Google Workspace or Slack Workspace—your company's dedicated environment.
Workspace roles and permissions
For the complete table of what each role can do, see the roles and permissions matrix.
Workspace Owner has complete administrative control including:
- Billing management and subscription plan changes
- Invite, remove, and manage all workspace members and their roles
- Assign users to projects, including projects they're not part of
- Manage workspace API tokens and external API keys
Workspace Member capabilities:
- Can create projects and view the Activity Log
- Can be added to projects by Project Admins
- Cannot invite users to the workspace
- Full collaboration capabilities within assigned projects
When you work with a Workspace
You'll work with your Workspace during initial account setup, when adding or removing team members, managing billing and subscription, or viewing cross-project activity if you're an administrator.
Project: Isolated area within a Workspace
A Project provides an isolated area within your Workspace for a specific team, department, or initiative. Each Project contains Datasets specific to that project's purpose, Live Connections scoped to project security, shared team members with project-level permissions, and independent settings and configurations.
Project data isolation and security
Projects provide security boundaries—one project cannot see another's data. Live Connection credentials are stored per-project, ensuring sensitive database access is controlled at the team level. Multiple users can work in the same project with defined permissions like the Project Admin or Project Editor roles.
Real-world analogy: Like folders in Google Drive, but with security boundaries.
Project roles and permissions
Project Admin (assigned automatically to the user who creates the project):
- Rename or delete the project
- Add workspace members to the project, invite external users, and remove users
- Create, update, or delete Live Connections
- All Project Editor capabilities
Project Editor:
- Add, edit, or delete datasets, views, and pipelines
- Create or modify queries from Live Connections
- Cannot manage project settings or users
Common Project organization patterns
Teams typically organize Projects by department ("Marketing", "Finance", "Operations"), by initiative ("Q4 Sales Analysis", "Customer Churn Study"), or by data source ("Salesforce Data", "Financial System Data").
Create Projects based on data access requirements, not just organizational structure. If two teams need the same database credentials, they should share a Project—separate Projects mean maintaining duplicate credentials.
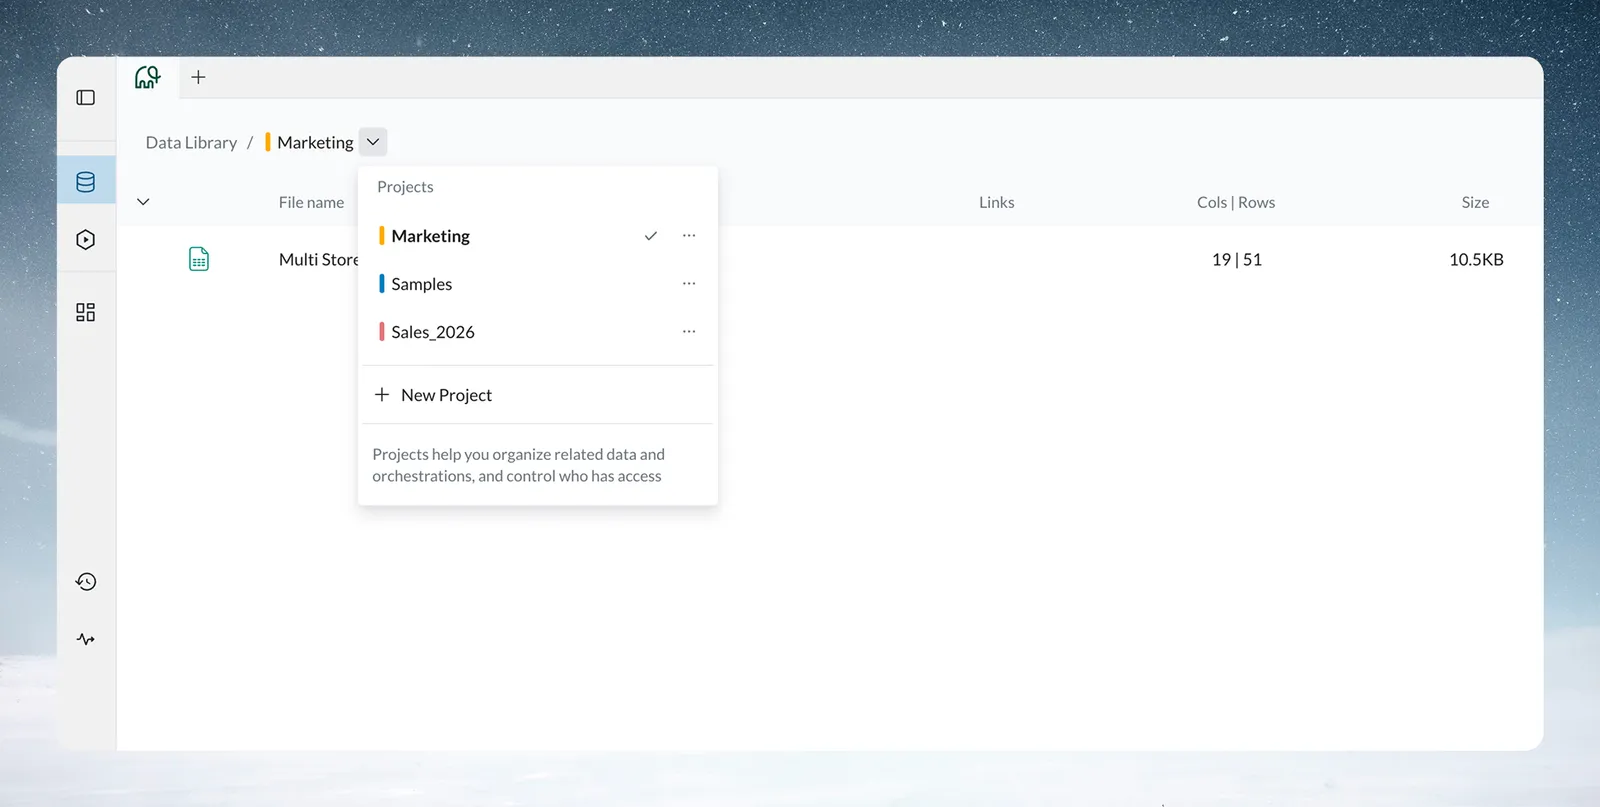
You can also view the Project list in Workspace Settings.
Dataset: Standardized data container
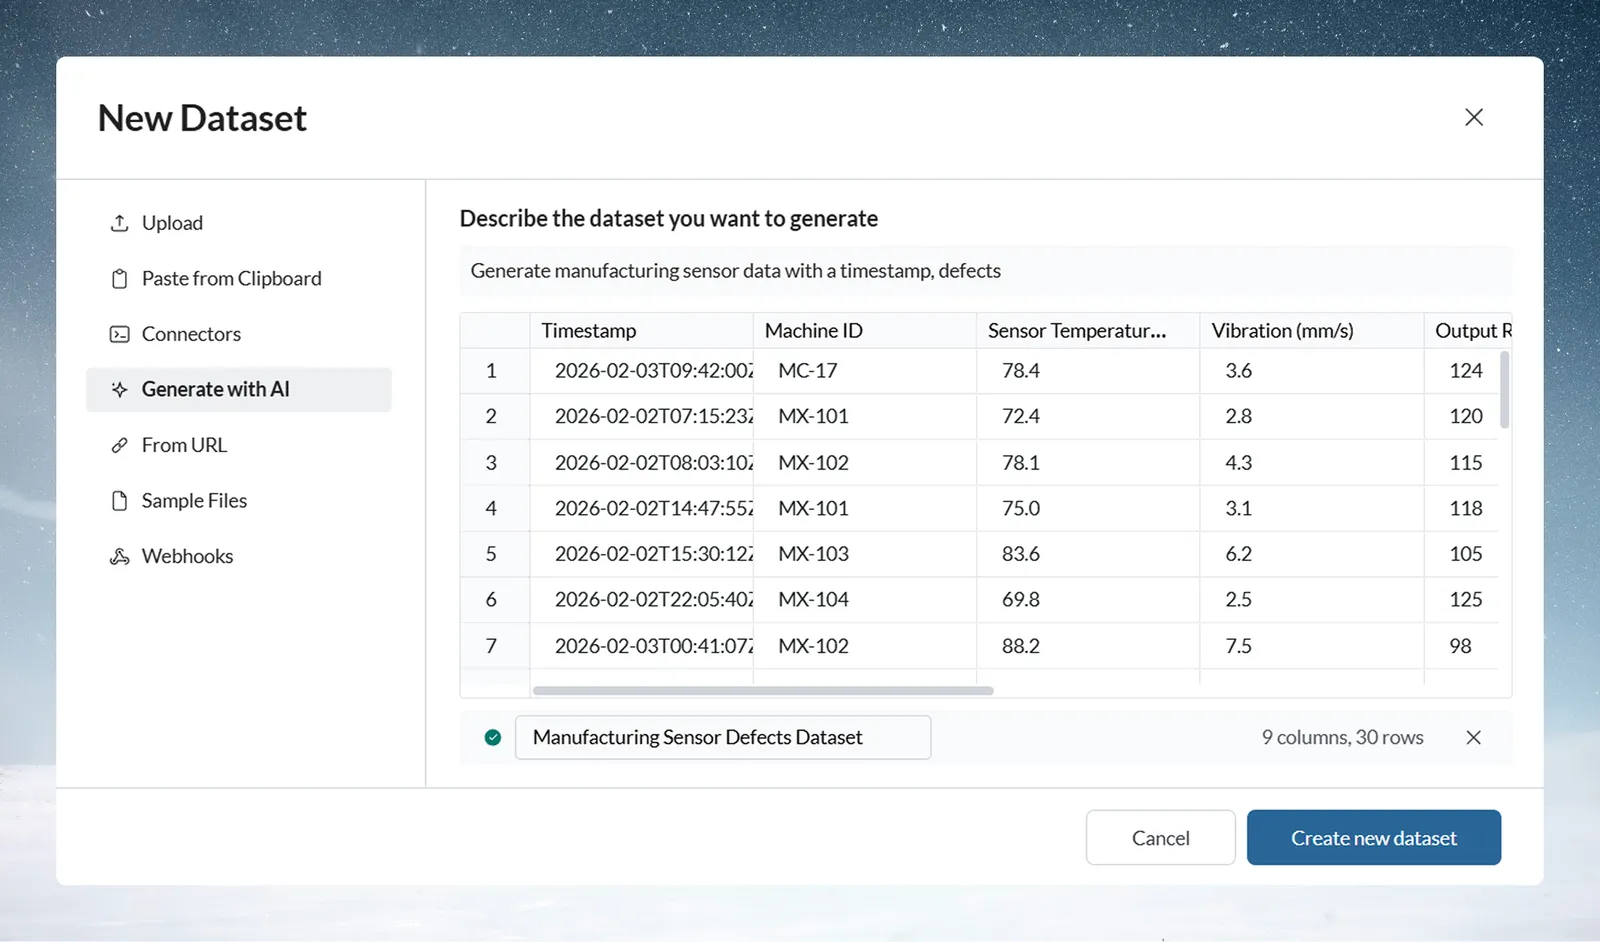
A Dataset is the result of importing data into Mammoth—your working data in standardized form. When you upload a CSV, connect to a database, or pull from an API, Mammoth creates a Dataset complete with schema (column names, data types, validation rules), metadata (source information, import history, row counts), batch collection (one or more data versions), and audit trail (complete lineage tracking).
Datasets are source-agnostic
Datasets are source-agnostic—CSV files, database queries, and API responses all become Datasets. Mammoth is schema-aware, understanding column types and validating data automatically. Datasets are versioned through multiple Batches, and data is stored persistently and securely in Mammoth's cloud infrastructure.
Dataset operations
You can create Datasets using multiple sources, including file uploads, clipboard data, connectors, URLs, webhooks, sample files, or by generating data with AI.
Once created, you can manage data using batch operations such as combine, replace, remove, or suspend. Create Views to transform and explore your data, and export datasets to supported destinations after processing is complete.
Batch: Data version within a Dataset
Each time data is added to a Dataset, it creates a Batch. Batches enable version control by tracking data changes over time, comparison by analyzing differences between time periods, rollback to return to previous data states if needed, and audit trails maintaining complete history of data imports.
Batch characteristics
Each Batch has a unique identifier and timestamp, preserved source information, tracked row count and metadata, and can be combined, replaced, removed, or suspended based on your needs.
Batch operations explained
Replace mode means new data overwrites old—typical for monthly data refreshes. Combine mode appends new data to existing data, perfect for cumulative datasets. Delete removes a batch, while Suspend hides it from all associated views without deleting its data.
Real-world analogy: Like Git commits for your data—every import is tracked and reversible.
Common Batch patterns
Monthly sales reports might have 12 batches per year, with each batch representing one month. Daily transaction feeds could have 365 batches per year in combine mode. One-time historical imports use a single batch with replace on refresh.
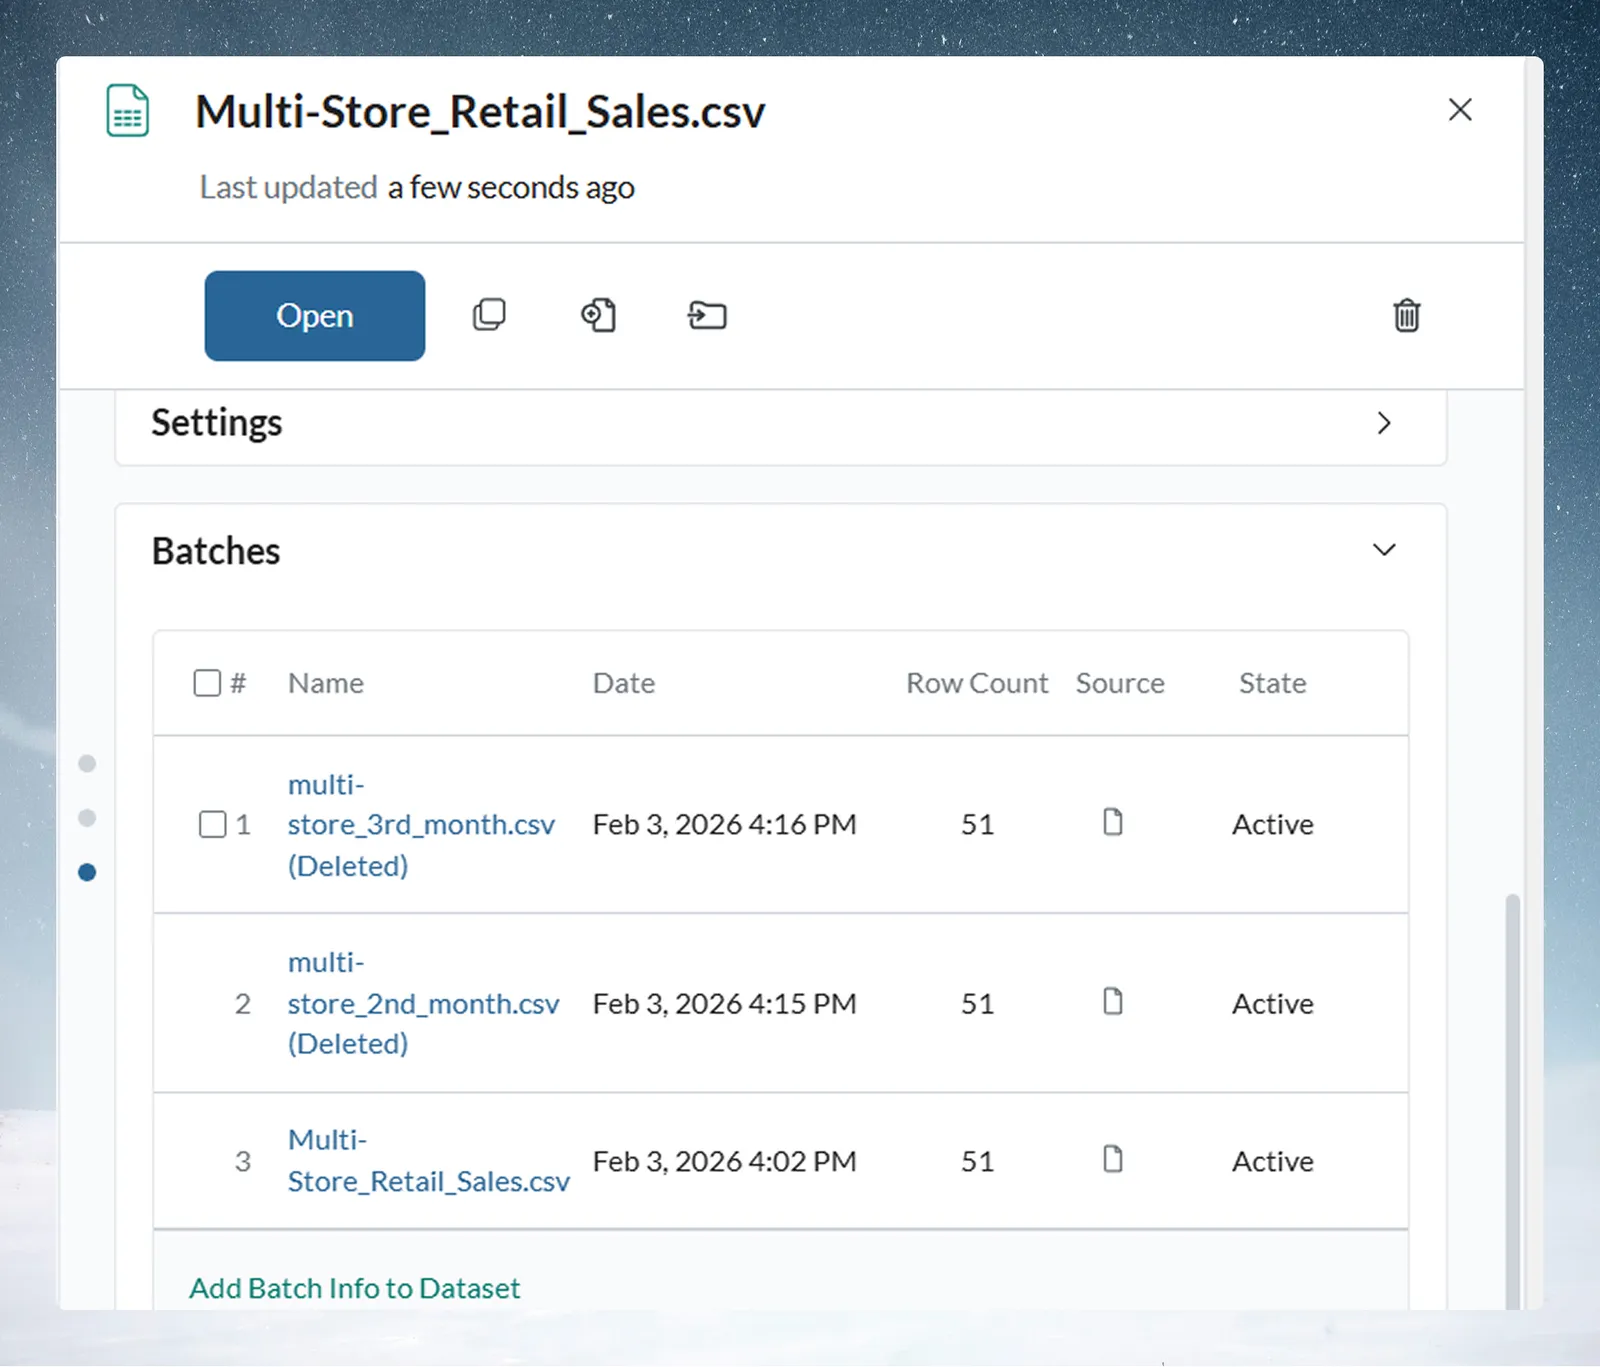
Use Replace mode for reports that need only the latest data. Use Combine mode when building historical datasets over time. Choose based on your analysis requirements.
View: Your interactive transformation workspace
A View is where you interact with your data. It displays all batch data combined by default, provides an interactive data grid for sorting and filtering, shows Explore Cards for automatic profiling, includes a Metrics Panel for calculations, and contains a Pipeline for building transformations.
Views as the starting point for work
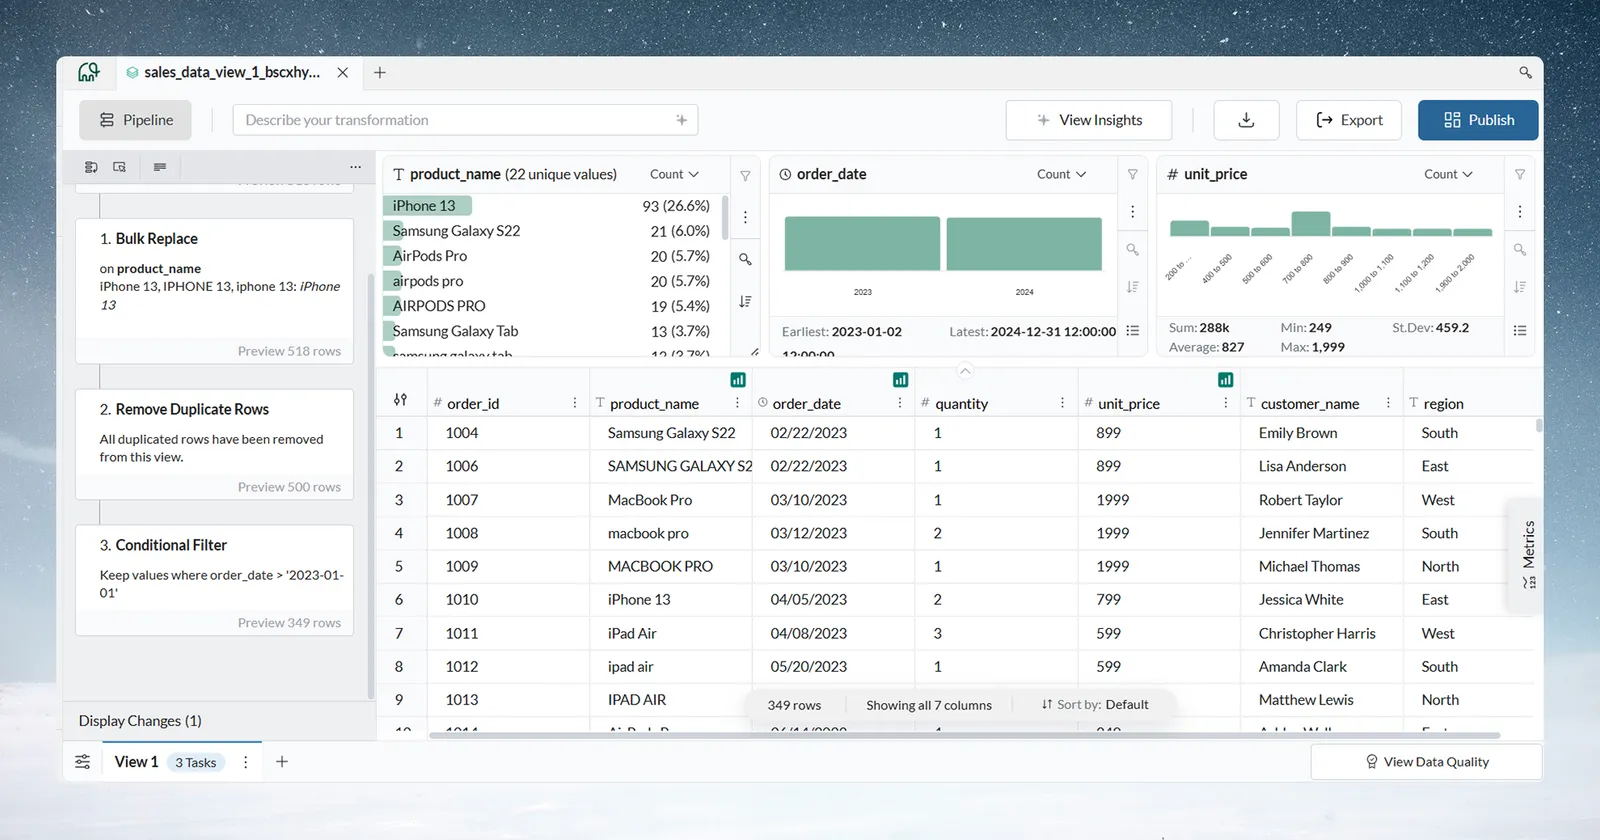
Every Dataset opens in a default View, but you can create multiple Views from one Dataset. Views are non-destructive—changes don't affect source data. Views operate in two modes: display-only changes (like renaming columns or formatting) are temporary and not saved to pipelines, while Pipeline Tasks create automated, reusable transformations.
Display changes versus Pipeline Tasks
New users often confuse the two.
View-level changes (Display changes) modify how data is presented within a specific View. These changes are saved with the View and persist when the View is reopened, but they do not alter the underlying dataset. They are intended for readability, exploration, and analysis within that View only.
Pipeline Tasks transform the actual dataset. They create reusable, automated transformation logic that persists across data refreshes, can be reused across multiple Views, and are included in automation and production workflows.
When to use each: Use view level changes when you want to improve clarity, formatting, or interpretation for a particular View. Use Pipeline Tasks when creating reusable transformation logic for production workflows.
Real-world analogy: A View is like an Excel sheet with saved formatting, filters, and calculated columns.
A Pipeline Task is like a Power Query or ETL operation that permanently reshapes the data before anyone opens the sheet.
Pipeline: Automated transformation sequence
When you perform transformations in a View, they're added to the Pipeline as Tasks. The Pipeline is sequential (tasks execute top-to-bottom in order), reusable (apply same logic to new data automatically), auditable (every task documented and reviewable), editable (modify, reorder, or remove tasks anytime), and previewable (see results at each task).
Build once, run on every refresh
New data automatically flows through the same Pipeline, eliminating manual repetition and ensuring consistency.
Pipeline execution modes: immediate and Draft Mode
Immediate execution (default) runs each task as you add it and shows results in real time, which suits iterative development. Draft Mode queues your changes as Pending Updates that run together when you click Apply now, which suits large datasets, complex workflows, and testing before committing changes.
Real-world analogy: Like a recipe—write once, cook many meals.
Common Pipeline patterns
Data cleaning pipelines typically follow this pattern: Filter → Remove duplicates → Standardize values → Convert types. Data combination workflows use: Join datasets → Select columns → Calculate derived fields. Reporting preparation might include: Filter to period → Aggregate by group → Pivot for layout.
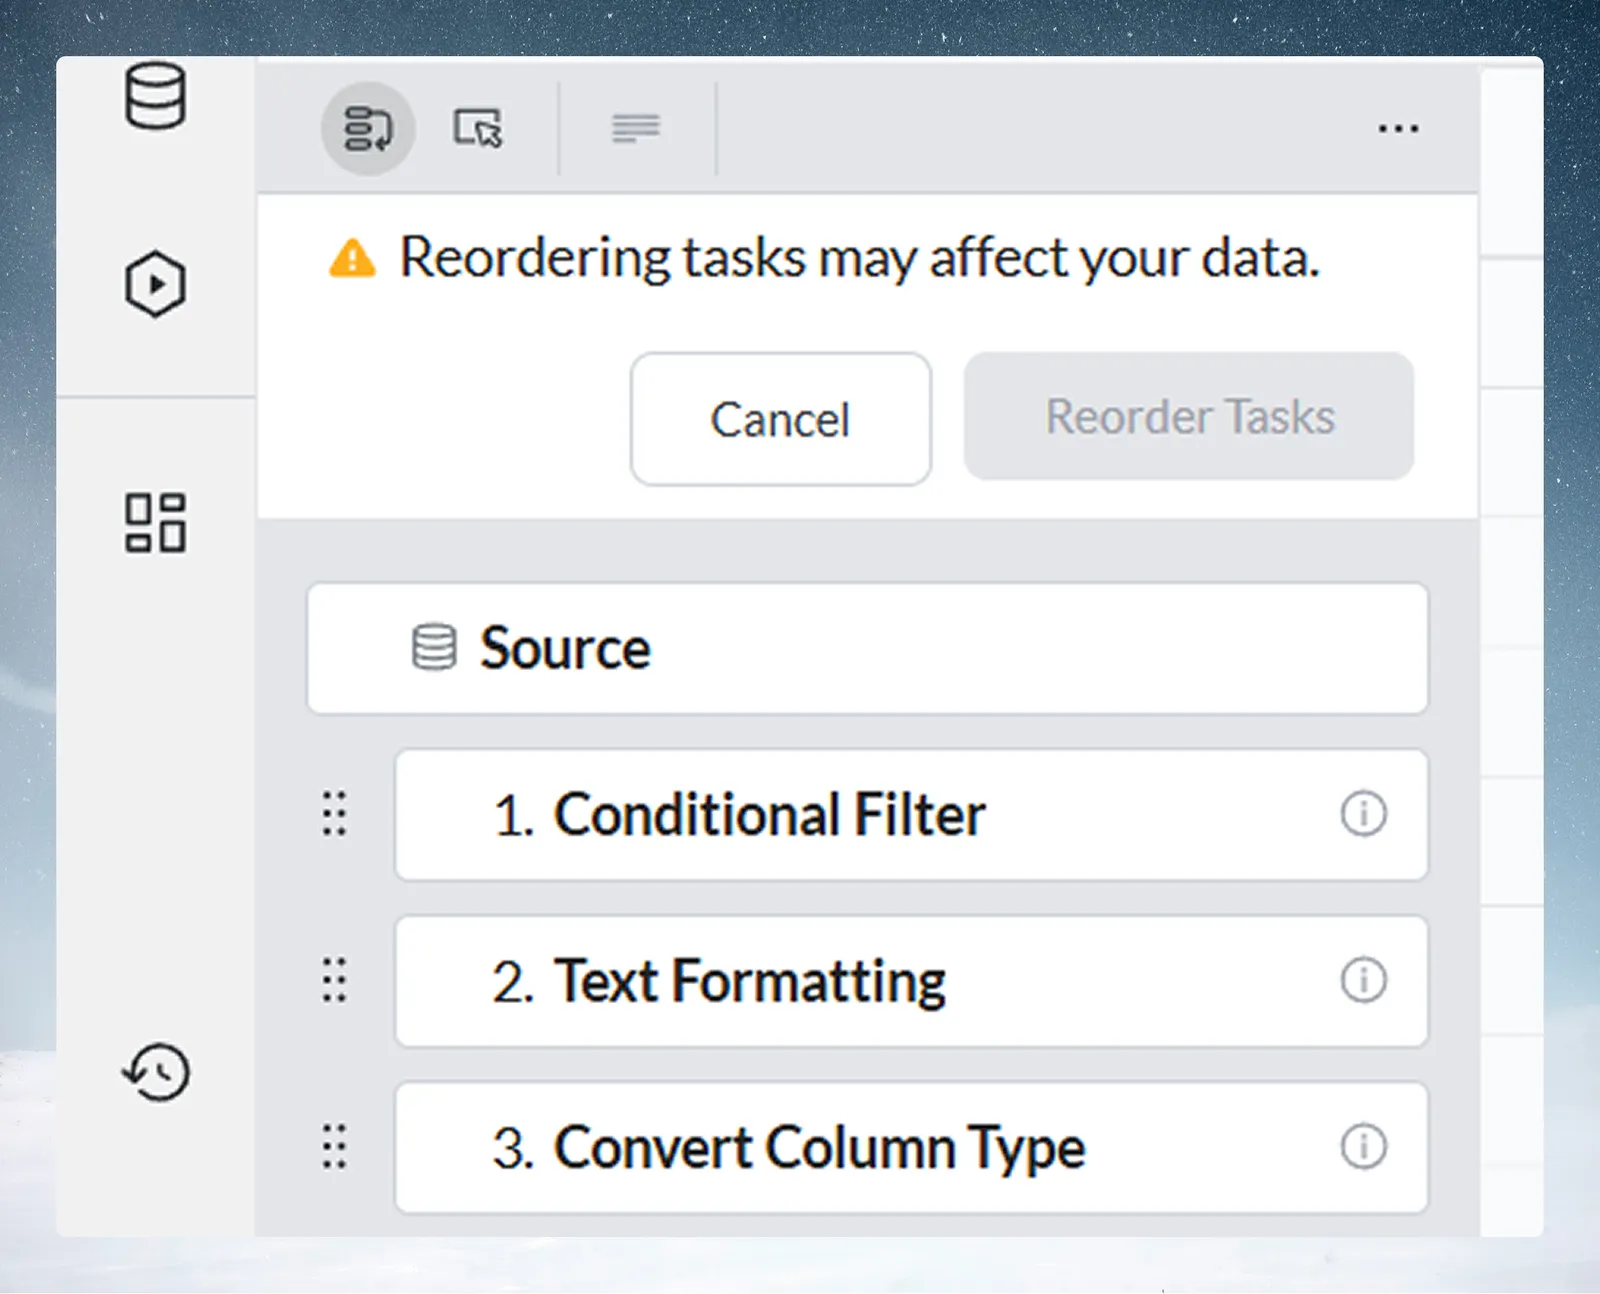
Start building pipelines in immediate execution mode to see results instantly. Once you've validated the logic, switch to Draft Mode when processing large datasets—this batches your changes so they run together.
Task: Individual transformation operation
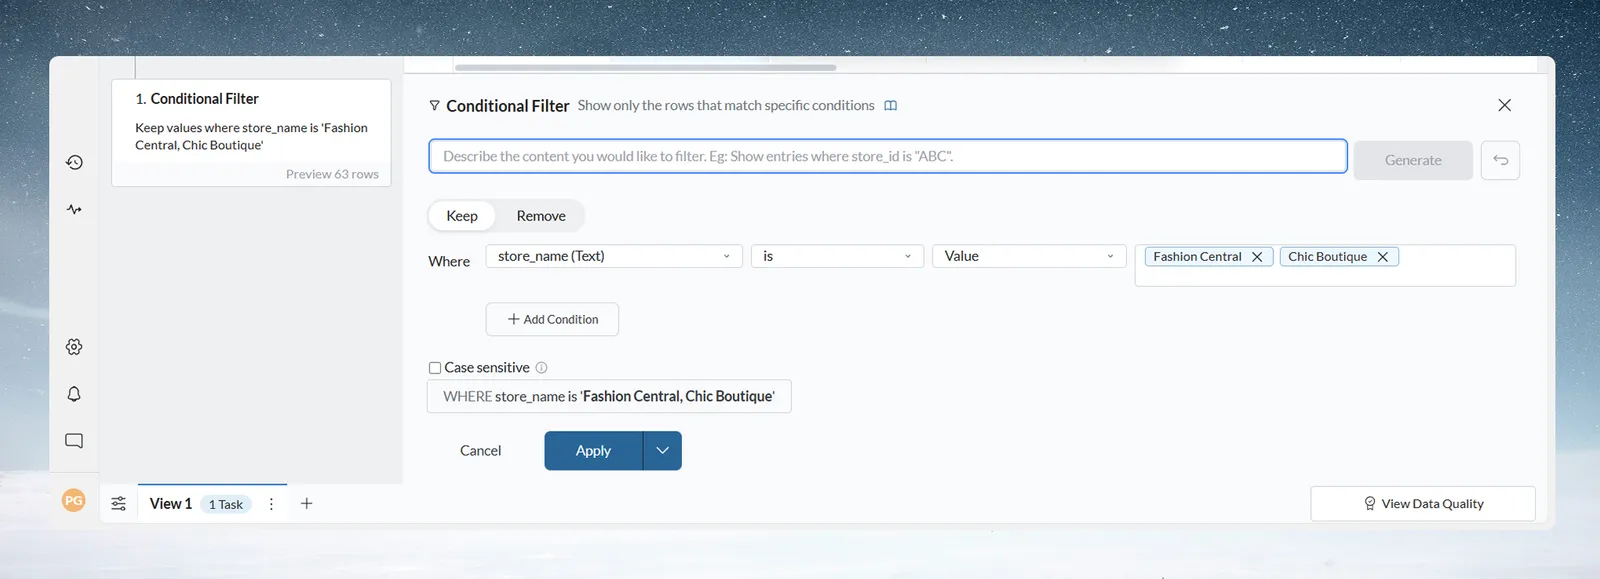
Each transformation you apply creates a Task—a single transformation operation within a Pipeline. Tasks are atomic (one operation per task like filter, join, or calculate), configurable (parameters editable via Function Panel), ordered (position in pipeline determines execution sequence), and previewable (click to see before/after data state).
Task categories
The task picker opens from the + button (tooltip Add a task) and organizes functions into seven categories. AI Powered includes Generative AI, AI SQL Query, Extract Text, Bulk Replace, and Conditional Filter. Filter Label & Replace includes Conditional Filter, Remove Duplicate Rows, Show Top/Bottom Rows, Edit Cells, Label & Insert Values, Fill Missing Values, Bulk Replace, and Find & Replace. Date Numeric & Text includes date functions such as Add / Subtract Date Values, Math Function, Window function, Extract Text, Text Formatting, and Extract JSON. Reshape Group & Pivot includes Group & Pivot and Unpivot. Column Management includes Add Column, Copy Columns, Combine Columns & Text, Convert Column Type, Split Into Multiple Columns, and Remove Column. Unify includes Join, Lookup, and Send to Dataset. Controls includes Data Check and Checkpoint Alert. To describe a transformation in plain language instead, use Describe your transformation in the picker.
Function Panel for configuring a Task
When editing a Task, the Function Panel appears showing task configuration options, real-time preview of results, AI-powered suggestions where available, and validation with error messages. This visual interface removes the need for coding.
Real-world analogy: Like a single operation in an Excel formula, but visual and reusable.
How concepts work together
The seven concepts nest inside one another, as the following example and table show.
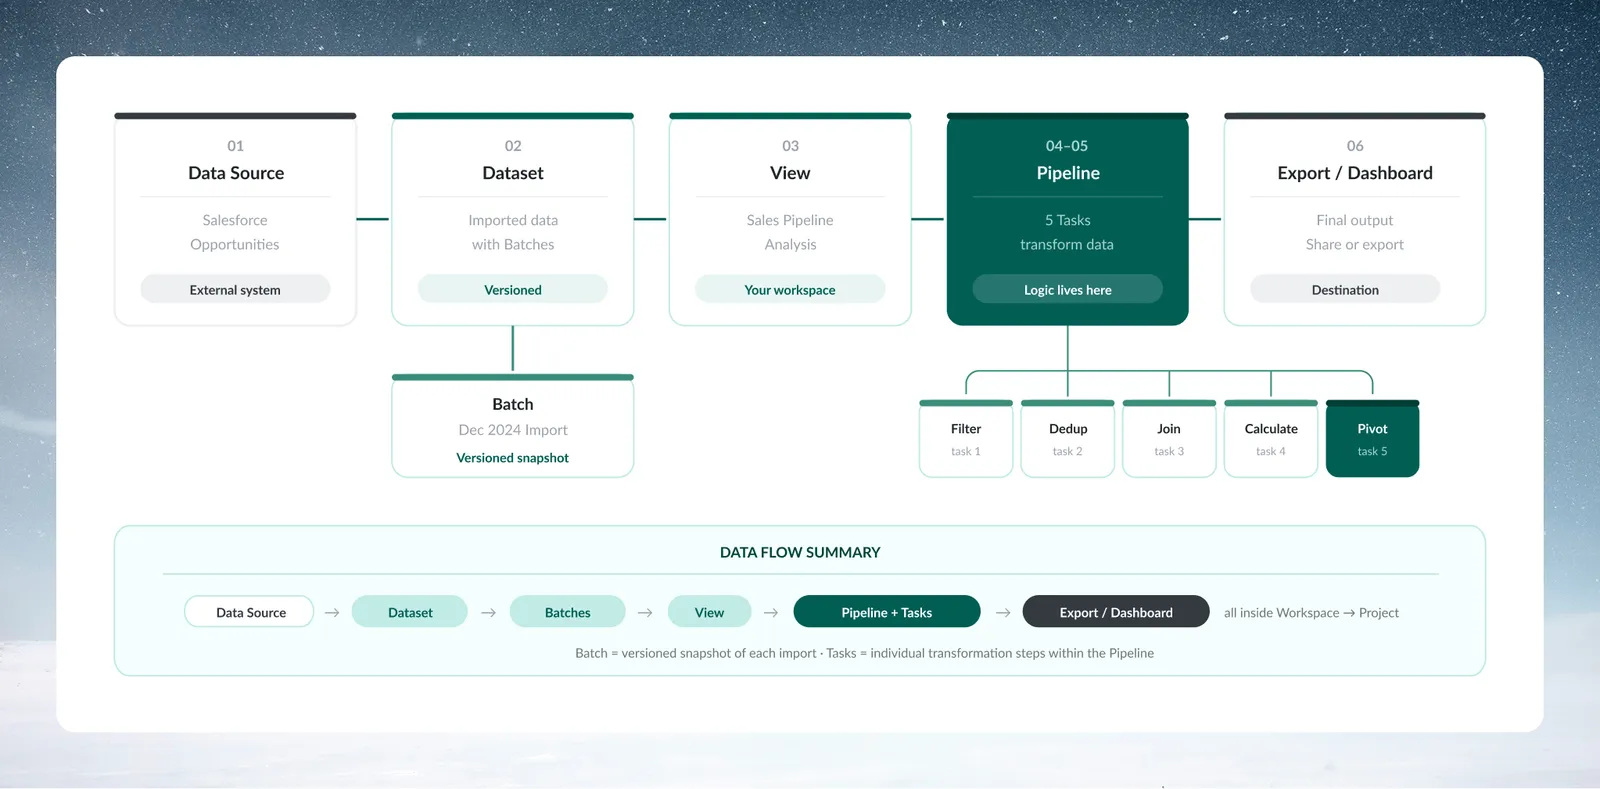
Complete workflow example with all seven concepts
This scenario uses all seven concepts:
- Workspace: "Acme Corp" (your company)
- Project: "Q4 Sales Analysis" (your team's area)
- Dataset: "Salesforce Opportunities" (imported data)
- Batch: "December 2024 Import" (this month's data)
- View: "Sales Pipeline Analysis" (your workspace)
- Pipeline: 5 Tasks transforming the data
- Tasks: Filter → Remove Duplicates → Join → Calculate → Pivot
Data flow summary
Data flows from source through Mammoth like this: Data Source → Import → Dataset (with Batches) → View (with Pipeline of Tasks) → Export/Dashboard.
Concept hierarchy summary
This table shows how the concepts nest within each other:
| Level | Container | What it holds | Security boundary | Primary roles |
|---|---|---|---|---|
| 1 | Workspace | Projects | Organization-level | Workspace Owner, Member |
| 2 | Project | Datasets, Live Connections | Team/department-level | Project Admin, Project Editor |
| 3 | Dataset | Batches | Data-level | Project members |
| 4 | Batch | Rows of data | Version-level | Project members |
| 5 | View | Pipeline | Transformation-level | Project members |
| 6 | Pipeline | Tasks | Workflow-level | Project members |
| 7 | Task | Single operation | Task-level | Project members |
Common questions about core concepts
Where is my data stored?
Your data is stored in your Workspace, organized by Project → Dataset → Batch, in Mammoth's cloud infrastructure.
What's the difference between a Dataset and a View?
A Dataset is the imported data container—the raw or source data. A View is the interactive workspace where you explore and transform that data. One Dataset can have multiple Views, each with different transformation logic.
Why do I need Projects?
Projects provide security boundaries and organization. The Marketing team can't see Finance's data, and Live Connection credentials are scoped to Projects for data security. This ensures sensitive information stays within appropriate teams.
What happens to my Pipeline when I add new data?
New Batches automatically flow through the existing Pipeline. Your transformation logic is reused without any manual work—this is the core automation benefit of Pipelines.
Can I have multiple Pipelines on the same Dataset?
Yes! Create multiple Views from one Dataset, each with its own Pipeline for different purposes. For example, one View for executive reporting and another for detailed analysis.
Industry-specific examples
Financial services
Scenario: Monthly regulatory reporting
Workspace: First National Bank
Project: SOX Compliance
Dataset: General Ledger Transactions
Batch: December 2024 (Replace mode)
View: Regulatory Report View
Pipeline: Filter → Categorize → Validate → Aggregate
Tasks: Remove test transactions, categorize by account type, validate amounts
Manufacturing
Scenario: Production quality tracking
Workspace: Acme Manufacturing
Project: Quality Control
Dataset: Production Line Data
Batch: Daily production runs (Combine mode)
View: Quality Metrics Dashboard
Pipeline: Calculate defect rates → Flag outliers → Trend analysis
Tasks: Math functions for percentages, conditional filters for thresholds
Hospitality
Scenario: Multi-property revenue analysis
Workspace: Hotel Chain Corp
Project: Revenue Management
Dataset: Property Management System Data
Batch: Nightly revenue reports (Replace mode)
View: Executive Revenue Dashboard
Pipeline: Combine properties → Calculate RevPAR → Compare periods
Tasks: Union operations, math functions, pivot tables
Security and compliance summary
Mammoth's hierarchical structure provides multiple layers of security:
- Workspace isolation: Complete separation between organizations
- Project boundaries: Teams cannot access each other's data
- Live Connection scoping: Database credentials secured at project level
- Role-based permissions: Workspace Owner and Member roles, and Project Admin and Project Editor roles, with specific capabilities
- Activity Log: Workspace activity is recorded in the Activity Log
Next steps
Now that you understand Mammoth's core concepts, you're ready to start using the platform.
Quick start: See these concepts in action by building your first workflow → Quick start guide
Roles and permissions: Role-based access control in detail → Roles and permissions matrix
Draft Mode: Execution modes and performance → Draft Mode in the Pipeline
Your first pipeline: Hands-on tutorial with transformations → Build your first pipeline
Glossary and limits: Look up a term or check a limit → Glossary and Limits and quotas